Answers and Solutions: 12 – 1
Chapter 12
Corporate Valuation and Financial Planning
ANSWERS TO END-OF-CHAPTER QUESTIONS
12-1 a. The operating plan provides detailed implementation guidance designed to
accomplish corporate objectives. It details who is responsible for what particular
function, and when specific tasks are to be accomplished. The financial plan details
the financial aspects of the corporation’s operating plan.
b. Spontaneous liabilities are the first source of expansion capital as these accounts
will be lower. A firm’s payout ratio is calculated as dividends per share divided by
earnings per share. The less of its income a company distributes as dividends, the
larger its addition to retained earnings. Therefore, the firm’s need for external
financing will be lower.
Answers and Solutions: 12 – 2
needed
increase
liab. sspontaneou
earnings
AFN = (A0*/S0)S – (L0*/S0)S – MS1(1 – Payout rate)
Capital intensity is the dollar amount of assets required to produce a dollar of sales.
The capital intensity ratio is the reciprocal of the total assets turnover ratio. It is
calculated as Assets/Sales. The sustainable growth rate is the maximum growth rate
the firm could achieve without having to raise any external capital. A firm’s self-
supporting growth rate can be calculated as follows:
Self-supporting g =
)S)(POR1(M *L *A
)S)(POR1(M
000
0
−−−
−
d. The forecasted financial statement approach using percent of sales develops a
complete set of financial statements that can be used to calculate projected EPS, free
cash flow, various other financial ratios, and a projected stock price. This approach
first forecasts sales, the required assets, the funds that will be spontaneously
generated, and then net income, dividends, and retained earnings.
e. A firm has excess capacity when its sales can grow before it must add fixed assets
Answers and Solutions: 12 – 3
12-2 Accounts payable, accrued wages, and accrued taxes increase spontaneously. Retained
earnings may or may not increase, depending on profitability and dividend payout policy.
12-3 The equation gives good forecasts of financial requirements if the ratios A0*/S and L0*/S,
the profit margin, and payout ratio are stable. This equation assumes that ratios are
12-4 The five key factors that impact a firm’s external financing requirements are: Sales
growth, capital intensity, spontaneous liabilities-to-sales ratio, profit margin, and payout
ratio.
12-5 The self-supporting growth rate is the maximum rate a firm can achieve without having
to raise external capital. The self-supporting growth rate is calculated using the AFN
equation, setting AFN equal to zero, replacing the term ΔS with the term g × S0, and
replacing the term S1 with S0 × (1 + g). Once the AFN equation is rewritten with these
modifications, you can now solve for g. This “g” obtained is the firm’s self-supporting
growth rate.
Answers and Solutions: 12 – 4
SOLUTIONS TO END-OF-CHAPTER PROBLEMS
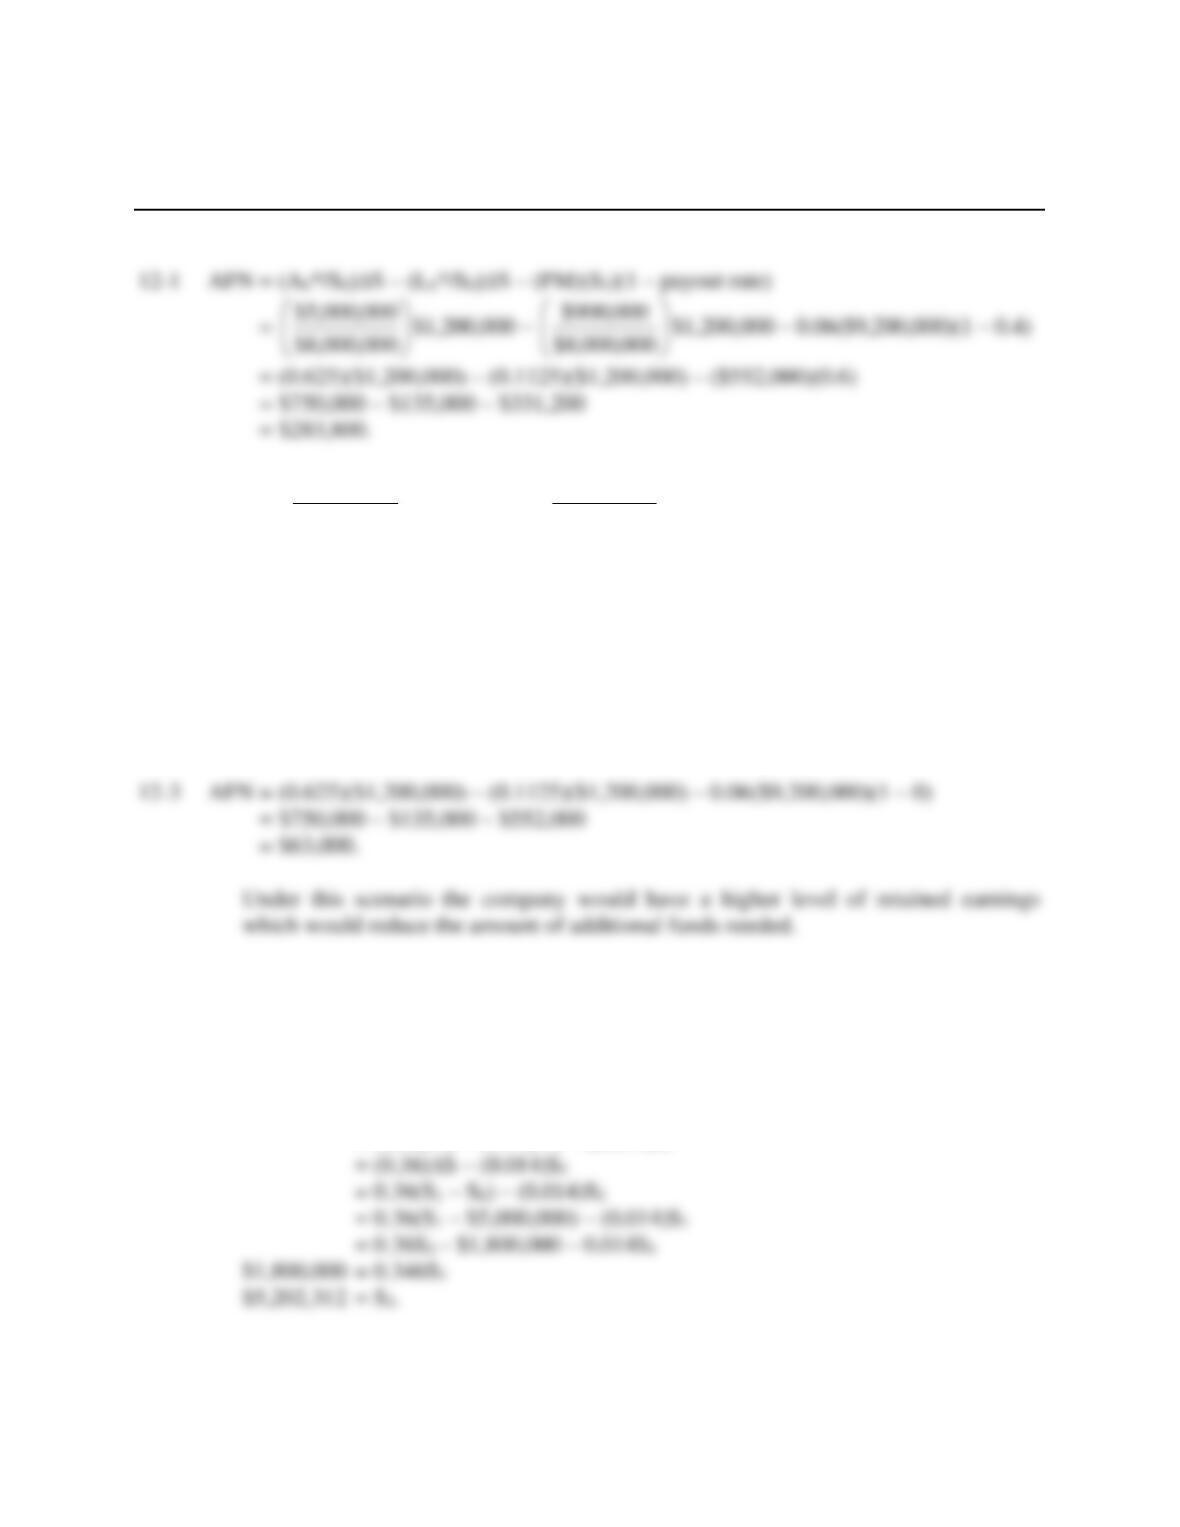
12-2 AFN =
000,000,8$
000,000,7$
$1,200,000 –
000,000,8$
000,900$
$1,200,000 – 0.06($9,200,000)(1 – 0.4)
= (0.875)($1,200,000) – $135,000 – $331,200
= $1,050,000 – $466,200
= $583,800.
The capital intensity ratio is measured as A0*/S0. This firm’s capital intensity ratio is
higher than that of the firm in Problem 9-1; therefore, this firm is more capital
intensive—it would require a large increase in total assets to support the increase in
sales.
12-4 S0 = $5,000,000; A0* = $2,500,000; CL = $700,000; NP = $300,000; AP = $500,000;
Accruals = $200,000; M = 7%; payout ratio = 80%; A0*/S0 = 0.50; L0* = (AP +
Accruals)/S0 = ($500,000 + $200,000)/$5,000,000 = 0.14.
AFN = (A0*/S0)∆S – (L0*/S0)∆S – (M)(S1)(1 – payout rate)
= (0.50)∆S – (0.14) ∆S – (0.07)(S1)(1 – 0.8)
= (0.50)∆S – (0.14)∆S – (0.014)S1
000,000,8$
000,000,5$
000,000,8$
Answers and Solutions: 12 – 5
Sales can increase by $5,202,312 – $5,000,000 = $202,312 without additional funds
being needed.
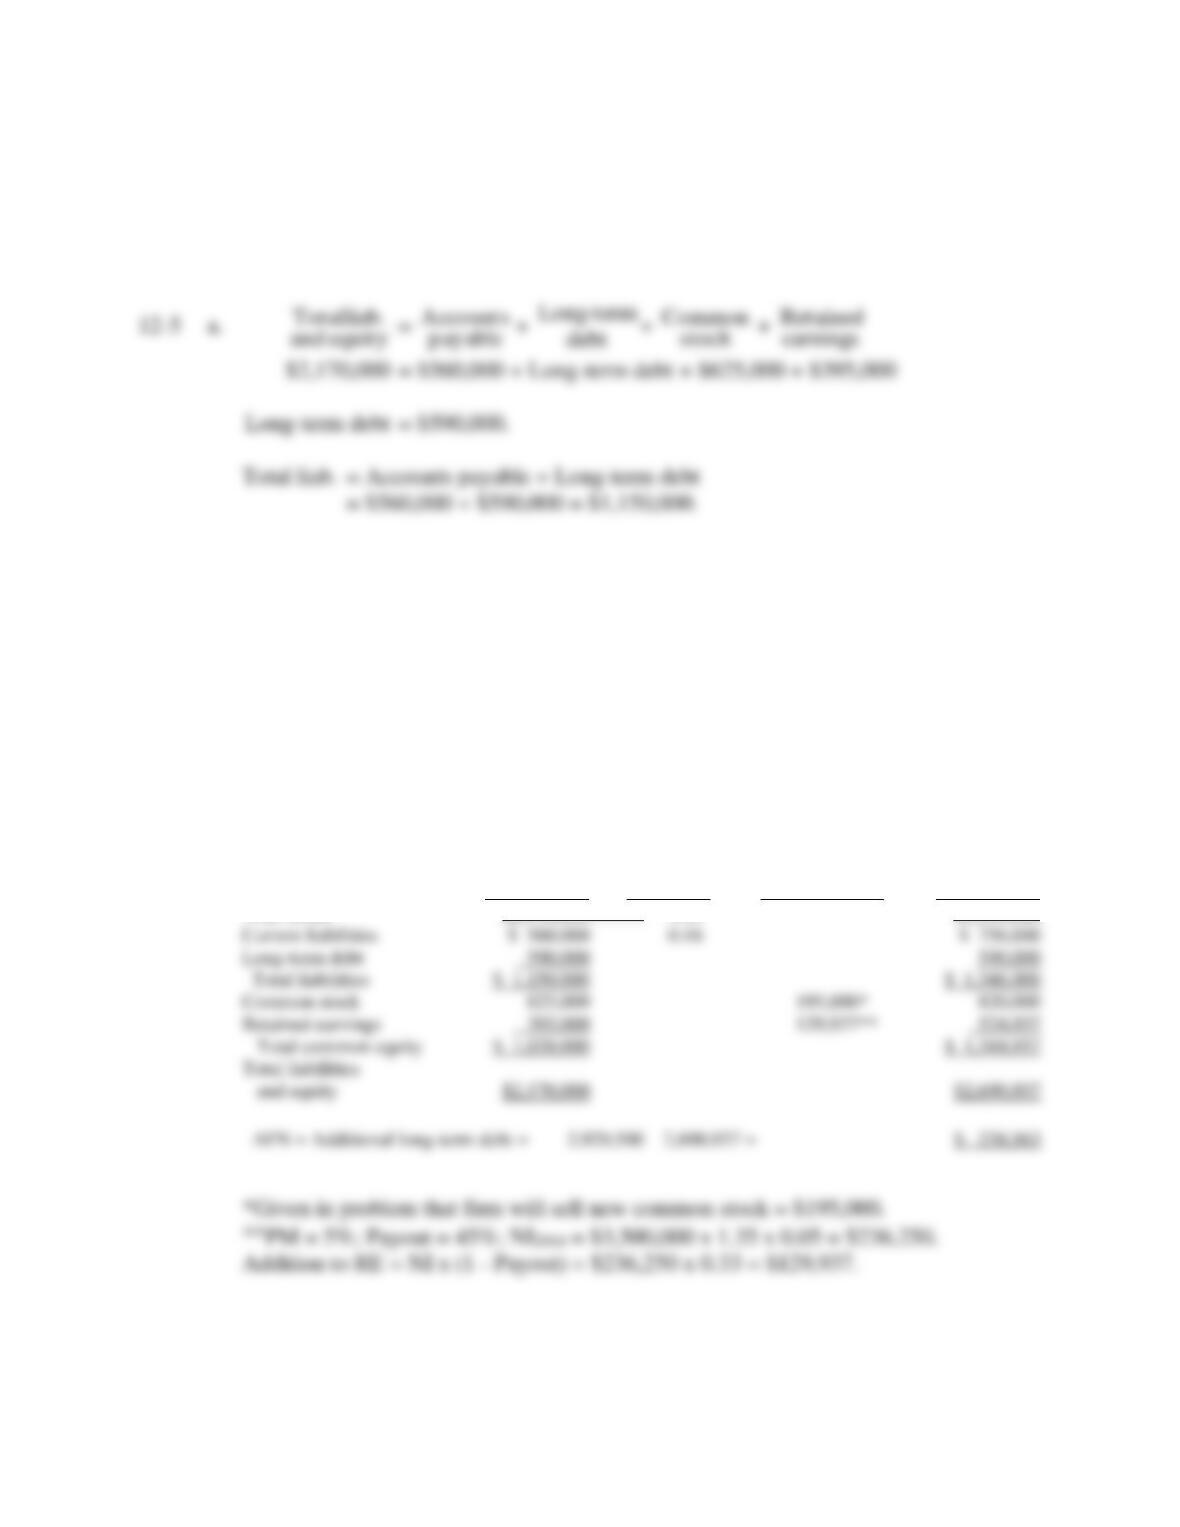
b. Assets/Sales (A0*/S0) = $2,170,000/$3,500,000 = 62%.
L0*/Sales = $560,000/$3,500,000 = 16%.
2014 Sales = (1.35)($3,500,000) = $4,725,000.
AFN = (A0*/S0)(∆S) – (L0*/S0)(∆S) – (M)(S1)(1 – payout) – New common stock
= (0.62)($1,225,000) – (0.16)($1,225,000) – (0.05)($4,725,000)(0.55) – $195,000
= $759,500 – $196,000 – $129,937 – $195,000 = $238,563.
Alternatively, using the forecasted financial statement method:
Forecast
Basis % Additions (New
2013 2014 Sales Financing, R/E) 2014
Total assets $2,170,000 0.62 $2,929,500
Answers and Solutions: 12 – 6
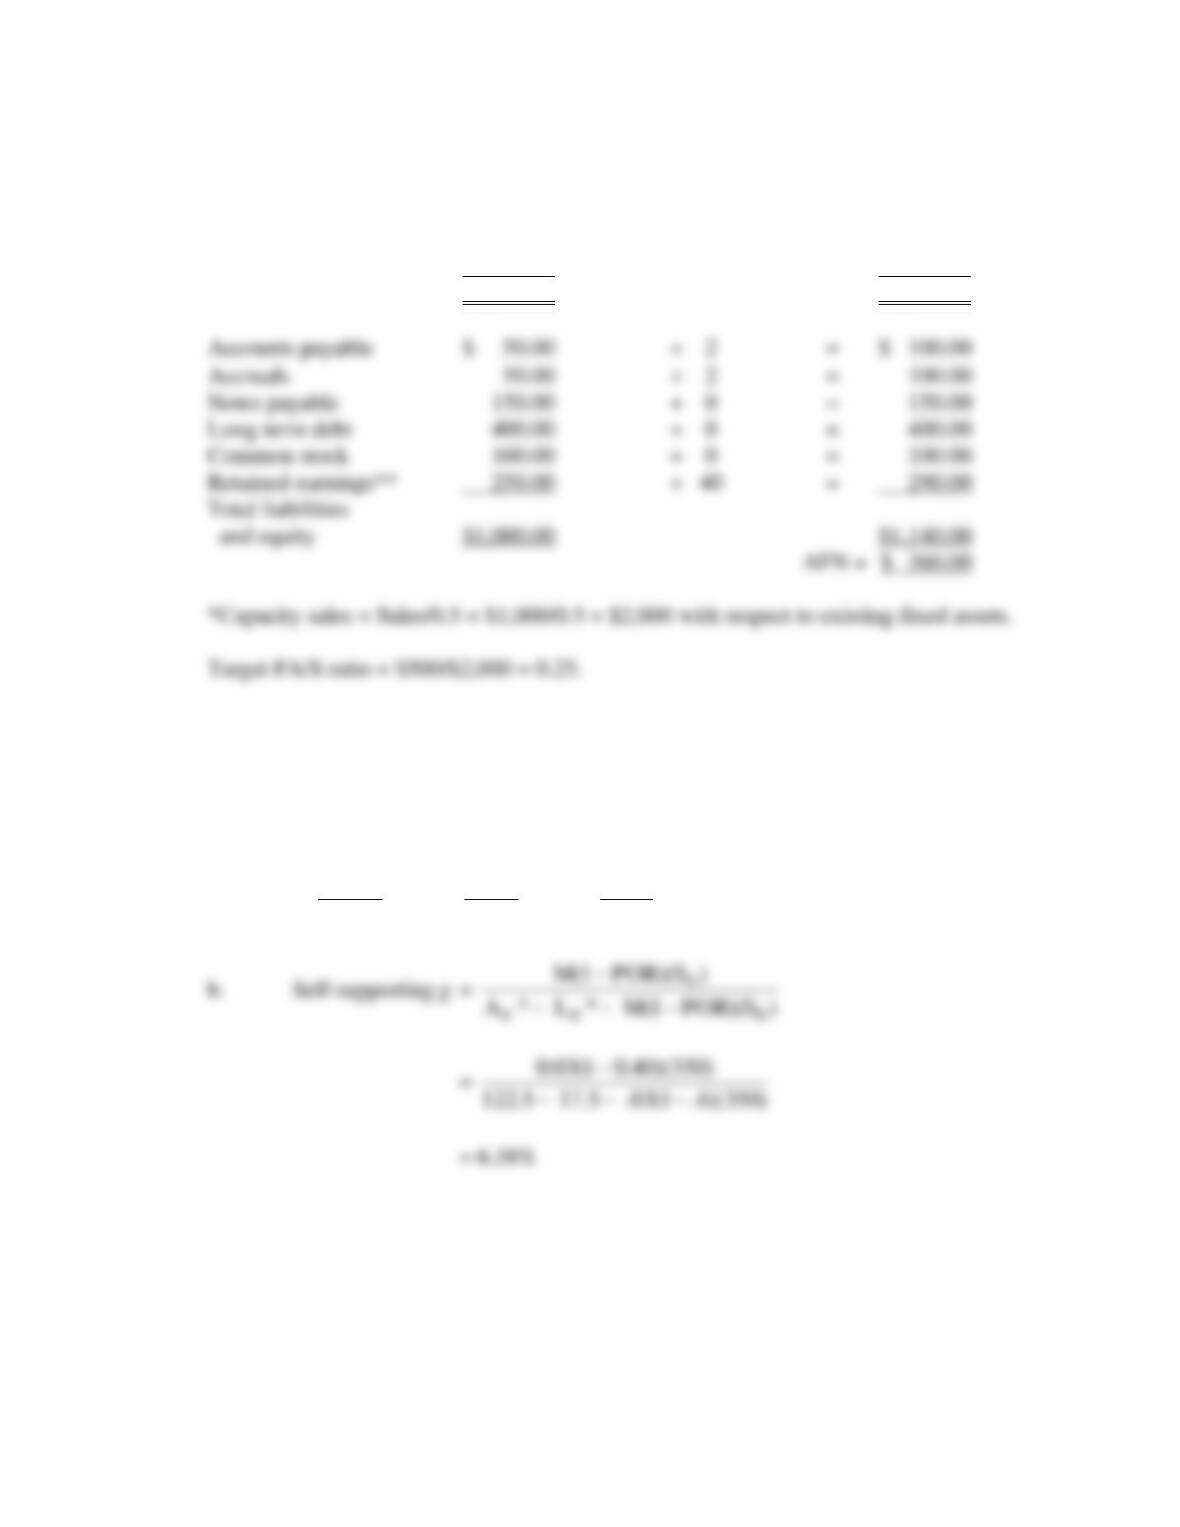
12-6 Cash $ 100.00 2.0 = $ 200.00
Accounts receivable 200.00 2.0 = 400.00
Inventories 200.00 2.0 = 400.00
Net fixed assets* 500.00 1.0 = 500.00
Total assets $1,000.00 $1,500.00
Target FA = 0.25($2,000) = $500 = Required FA. Since the firm currently has $500 of
fixed assets, no new fixed assets will be required.
**Addition to RE = (M)(S1)(1 – Payout ratio) = 0.05($2,000)(0.4) = $40.
12-7 a. AFN = (A0*/S0)(S) – (L0*/S0)(S) – (M)(S1)(1 – payout)
=
350$
5.122$
($70) –
350$
5.17$
($70) –
350$
5.10$
($420)(0.6) = $13.44 million.
Answers and Solutions: 12 – 7
c. Upton Computers
Pro Forma Balance Sheet
December 31, 2014
(Millions of Dollars)
2013
Forecast
Basis %
2014 Sales
Additions
2014 Pro
Forma
Financing
2014 Pro
Forma after
Financing
Cash
$ 3.5
0.0100
$ 4.20
$ 4.20
Receivables
26.0
0.0743
31.20
31.20
Inventories
58.0
0.1657
69.60
69.60
Total current assets
$ 87.5
$105.00
$105.00
Net fixed assets
35.0
0.100
42.00
42.00
Total assets
$122.5
$147.00
$147.00
Accounts payable
$ 9.0
0.0257
$ 10.80
$ 10.80
Notes payable
18.0
18.00
18.00
Line of credit
+13.44
Accruals
8.5
0.0243
10.20
10.20
Total current liabilities
$ 35.5
$ 39.00
$ 52.44
Mortgage loan
Common stock
15.0
15.00
15.00
Total liab. and equity
$122.5
$133.56
$147.00
$ 13.44
Answers and Solutions: 12 – 8
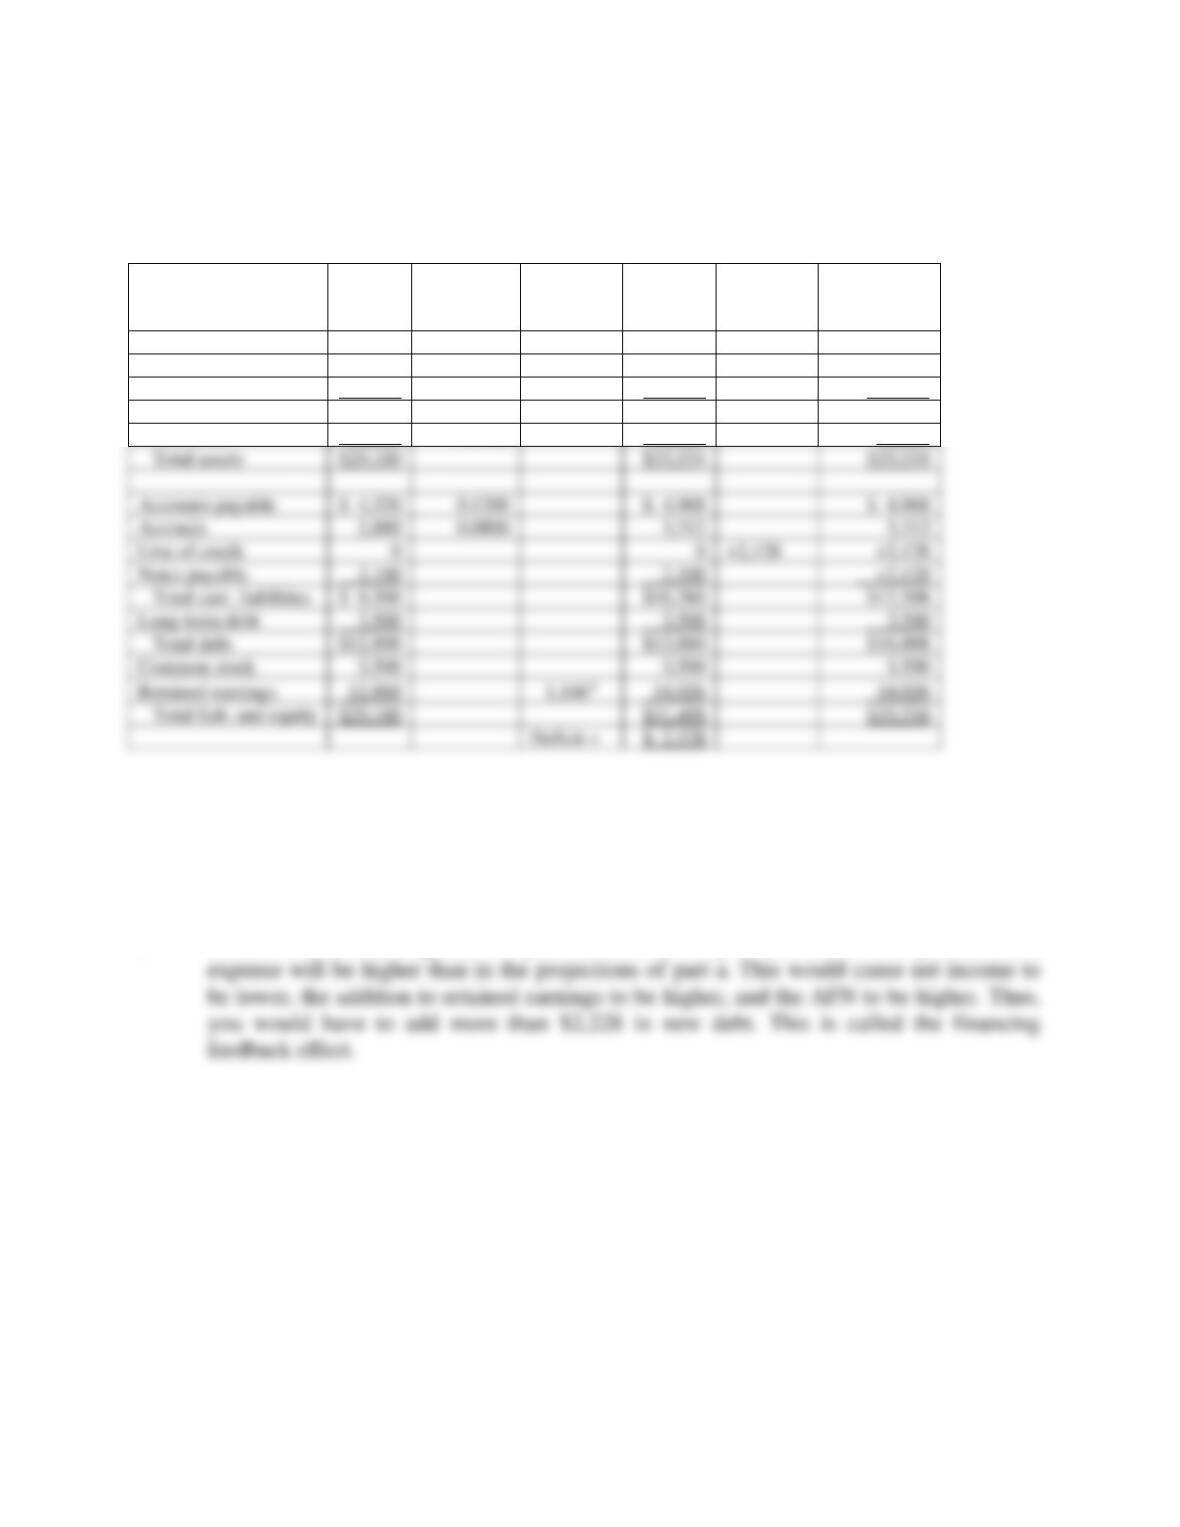
12-8 Stevens Textiles
Pro Forma Income Statement
December 31, 2014
(Thousands of Dollars)
a.
2014
Forecast 2014
2013 Basis Pro Forma
Sales $36,000 1.15 Sales13 $41,400
Operating costs 32,440 0.9011 Sales14 37,306
Answers and Solutions: 12 – 9
Stevens Textiles
Pro Forma Balance Sheet
December 31, 2014
(Thousands of Dollars)
2013
Forecast
Basis %
2014 Sales
Additions
2014 Pro
Forma
2014
Financing
2014 Pro
Forma after
Financing
Cash
$ 1,080
0.0300
$ 1,242
$ 1,242
Accts receivable
6,480
0.1800
7,452
7,452
Inventories
9,000
0.2500
10,350
10,350
Total curr. assets
$16,560
$19,044
$19,044
Fixed assets
12,600
0.3500
14,490
14,490
*From income statement.
b. Line of credit = $2,128 (thousands of $).
c. If debt is added throughout the year rather than only at the end of the year, interest
Total assets
$29,160
$33,534
$33,534
Accounts payable
$ 4,320
0.1200
$ 4,968
$ 4,968
Accruals
2,880
0.0800
3,312
3,312
Line of credit
+2,128
Notes payable
2,100
2,100
Total curr. liabilities
$ 9,300
$10,380
$12,508
Long-term debt
3,500
3,500
3,500
Total debt
$12,800
$13,880
$16,008
Common stock
3,500
3,500
3,500
Retained earnings
12,860
14,026
14,026
Total liab. and equity
$29,160
$31,406
$33,534
Deficit =
$ 2,128
Answers and Solutions: 12 – 10
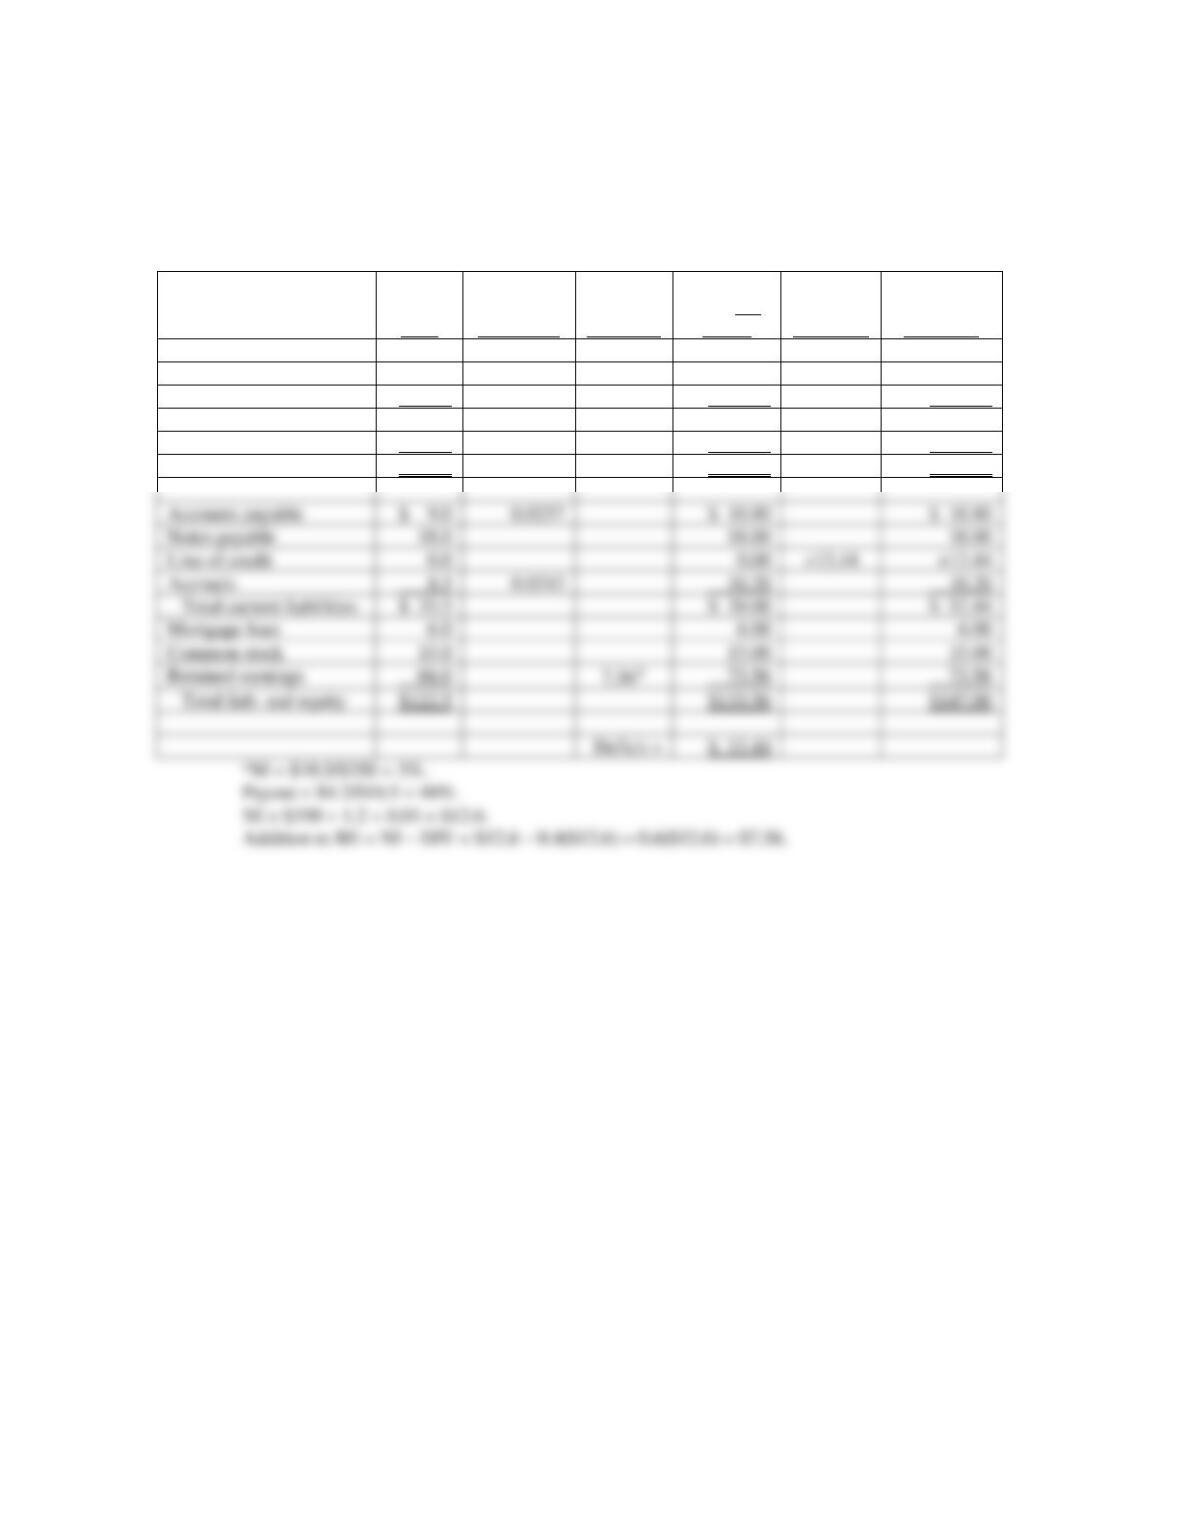
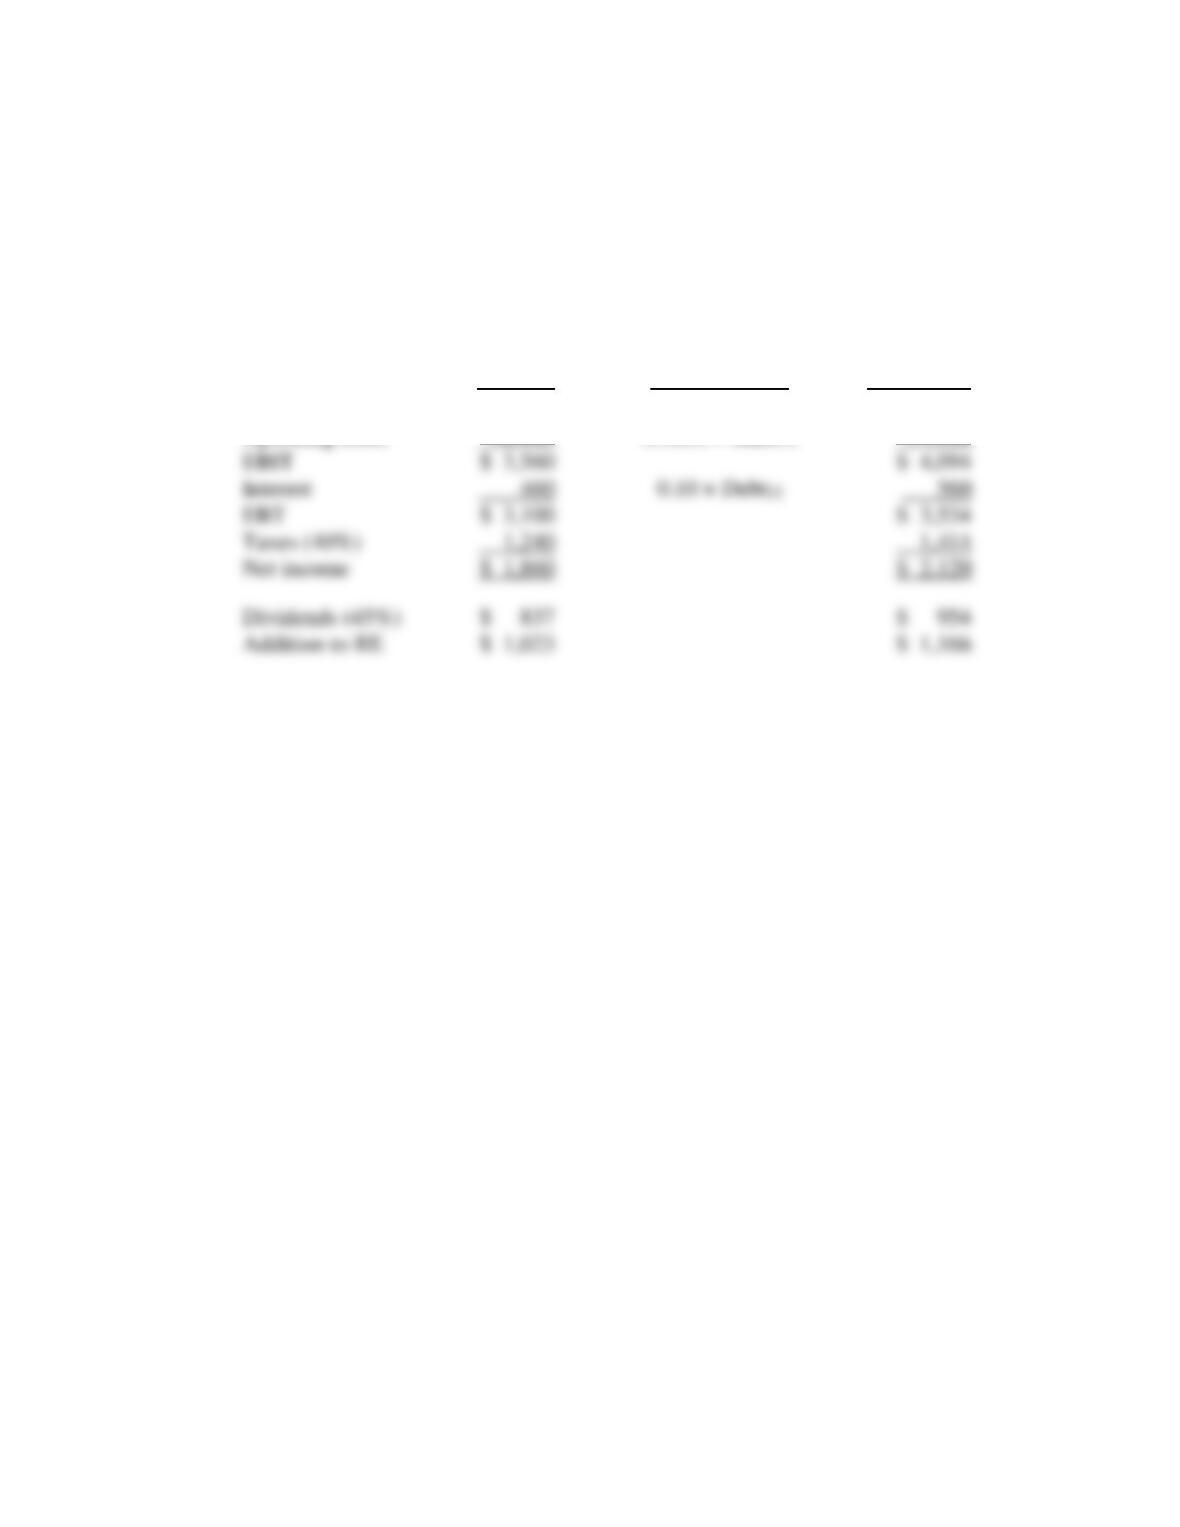
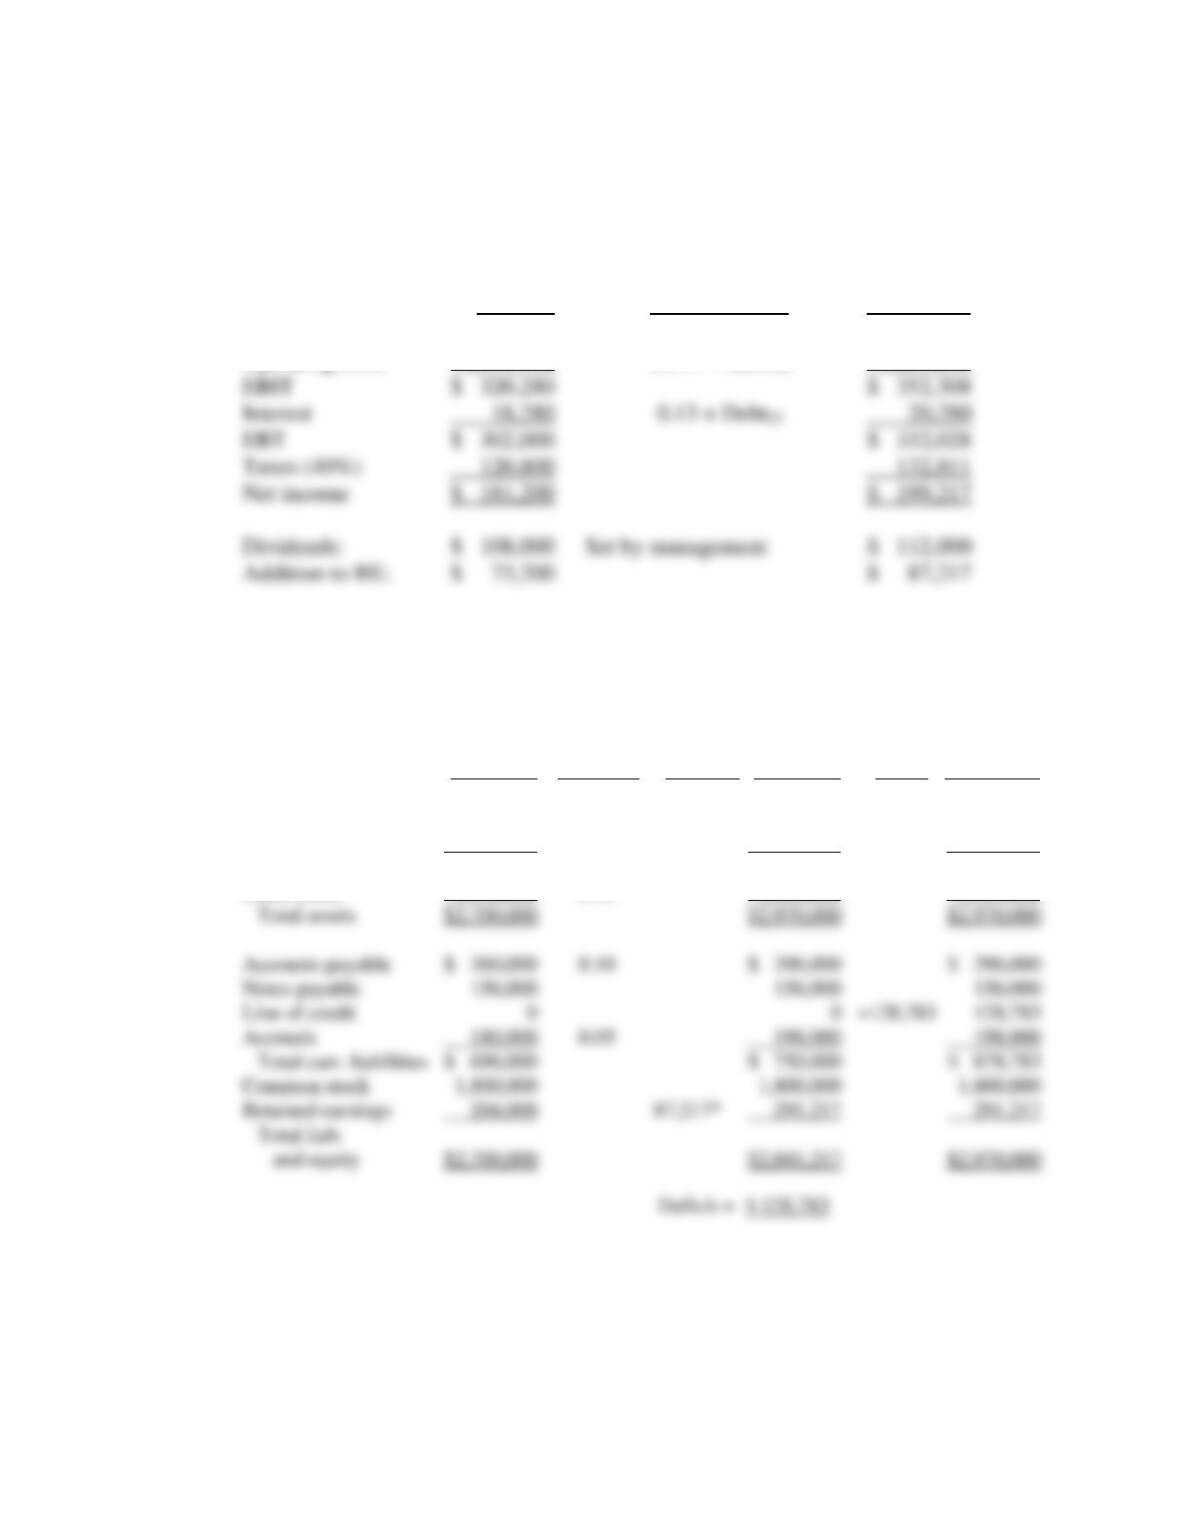
12-9 Garlington Technologies Inc.
Pro Forma Income Statement
December 31, 2014
Forecast Pro Forma
2013 Basis 2014
Sales $3,600,000 1.10 Sales13 $3,960,000
Operating costs 3,279,720 0.911 Sales14 3,607,692
Garlington Technologies Inc.
Pro Forma Balance Statement
December 31, 2014
Forecast
Basis % AFN With AFN
2013 2014 Sales Additions 2014 Effects 2014
Cash $ 180,000 0.05 $ 198,000 $ 198,000
Receivables 360,000 0.10 396,000 396,000
Inventories 720,000 0.20 792,000 792,000
Total curr. assets $1,260,000 $1,386,000 $1,386,000
Fixed assets 1,440,000 0.40 1,584,000 1,584,000
*See income statement.

Answers and Solutions: 12 – 11
SOLUTION TO SPREADSHEET PROBLEMS
12-11 The detailed solution for is available in the file Ch12 P10 Build a Model Solution.xls at
the textbook’s Web site.
Mini Case: 12 – 12
MINI CASE
Hatfield Medical Supplies’s stock price had been lagging its industry averages, so its
board of directors brought in a new CEO, Jaiden Lee. Lee had brought in Ashley Novak, a
finance MBA who had been working for a consulting company, to replace the old CFO, and
Lee asked Ashley to develop the financial planning section of the strategic plan. In her
previous job, Novak’s primary task had been to help clients develop financial forecasts, and
that was one reason Lee hired her.
Novak began as she always did, by comparing Hatfield’s financial ratios to the
industry averages. If any ratio was substandard, she discussed it with the responsible manager
to see what could be done to improve the situation. The following data shows Hatfield’s latest
financial statements plus some ratios and other data that Novak plans to use in her analysis.
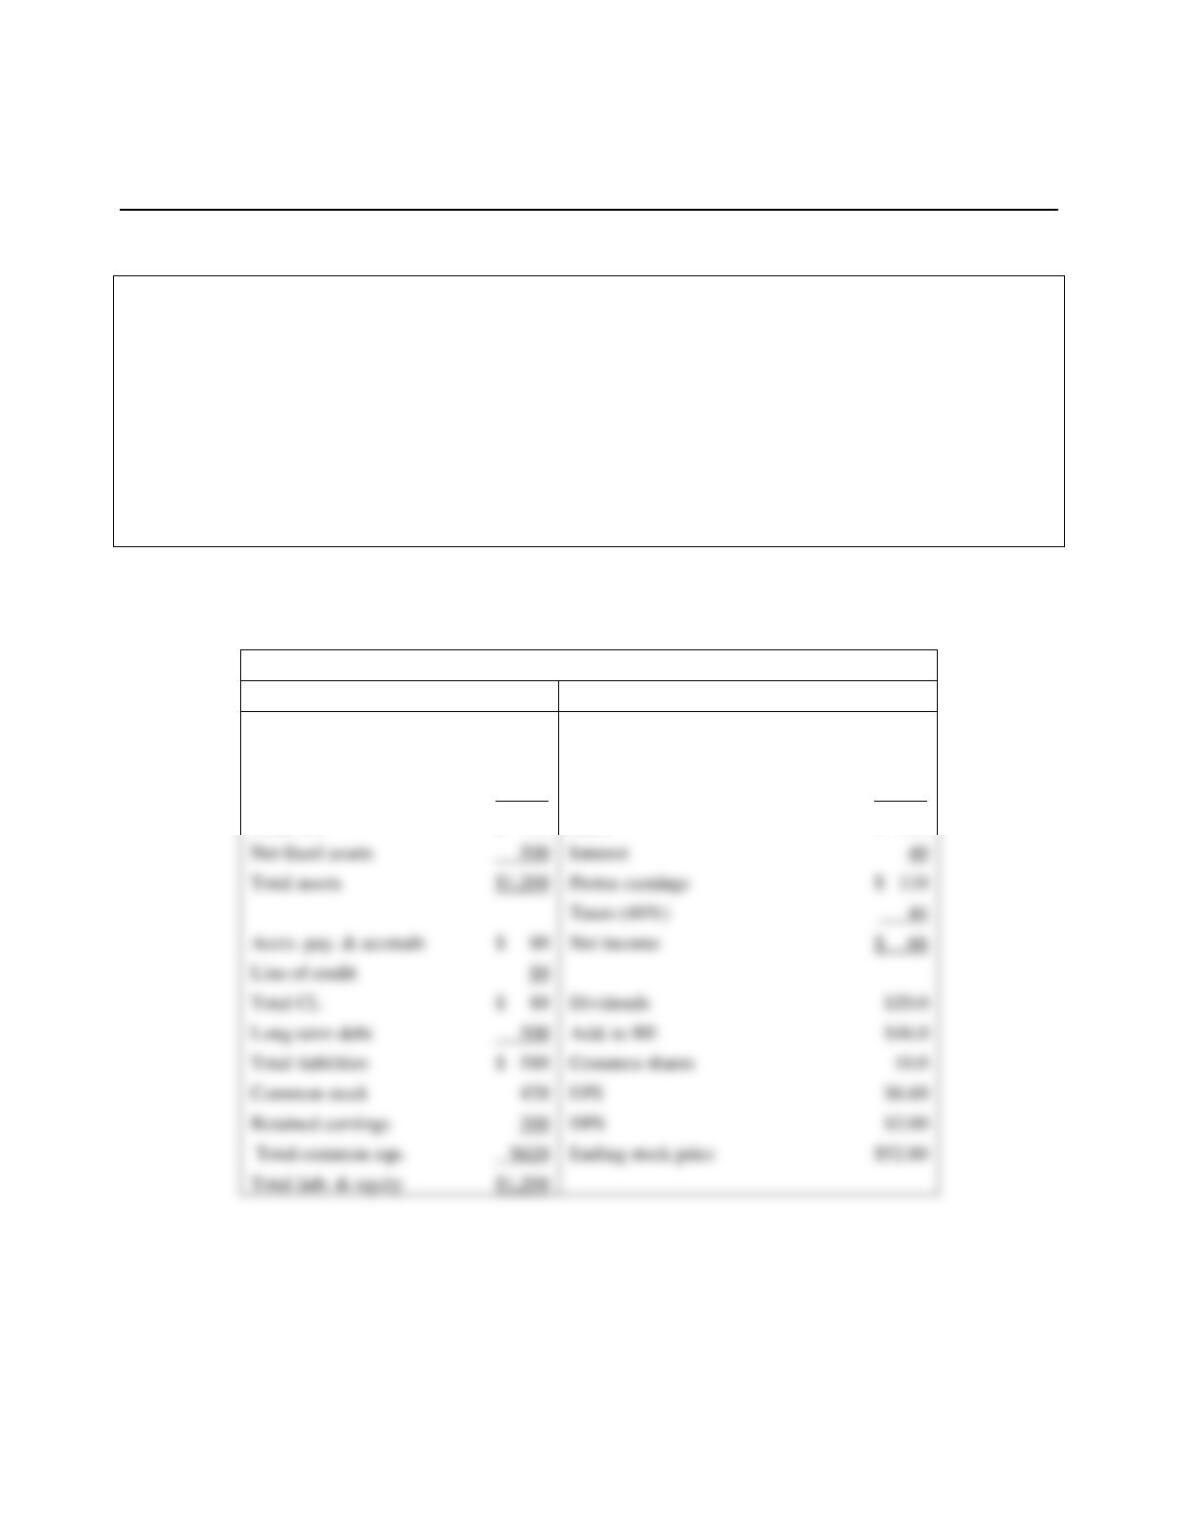
Hatfield Medical Supplies (Millions of Dollars Except Per Share Data)
Balance Sheet, 12/31/2013
Income Statement, Year Ending 2013
Cash
$ 20
Sales
$2,000
Accts. rec.
280
Op. costs (excl. depr.)
1,800
Inventories
400
Depreciation
50
Total CA
$ 700
EBIT
$ 150
Net fixed assets
500
Interest
Total assets
$1,200
Pretax earnings
$ 110
Taxes (40%)
Accts. pay. & accruals
$ 80
Net income
$ 66
Line of credit
Total CL
$ 80
Dividends
$20.0
Long-term debt
500
Add. to RE
$46.0
Total liabilities
$ 580
Common shares
Common stock
420
EPS
$6.60
Retained earnings
200
DPS
$2.00
Total common equ.
$620
Ending stock price
$52.80
Total liab. & equity
$1,200
Mini Case: 12 – 13
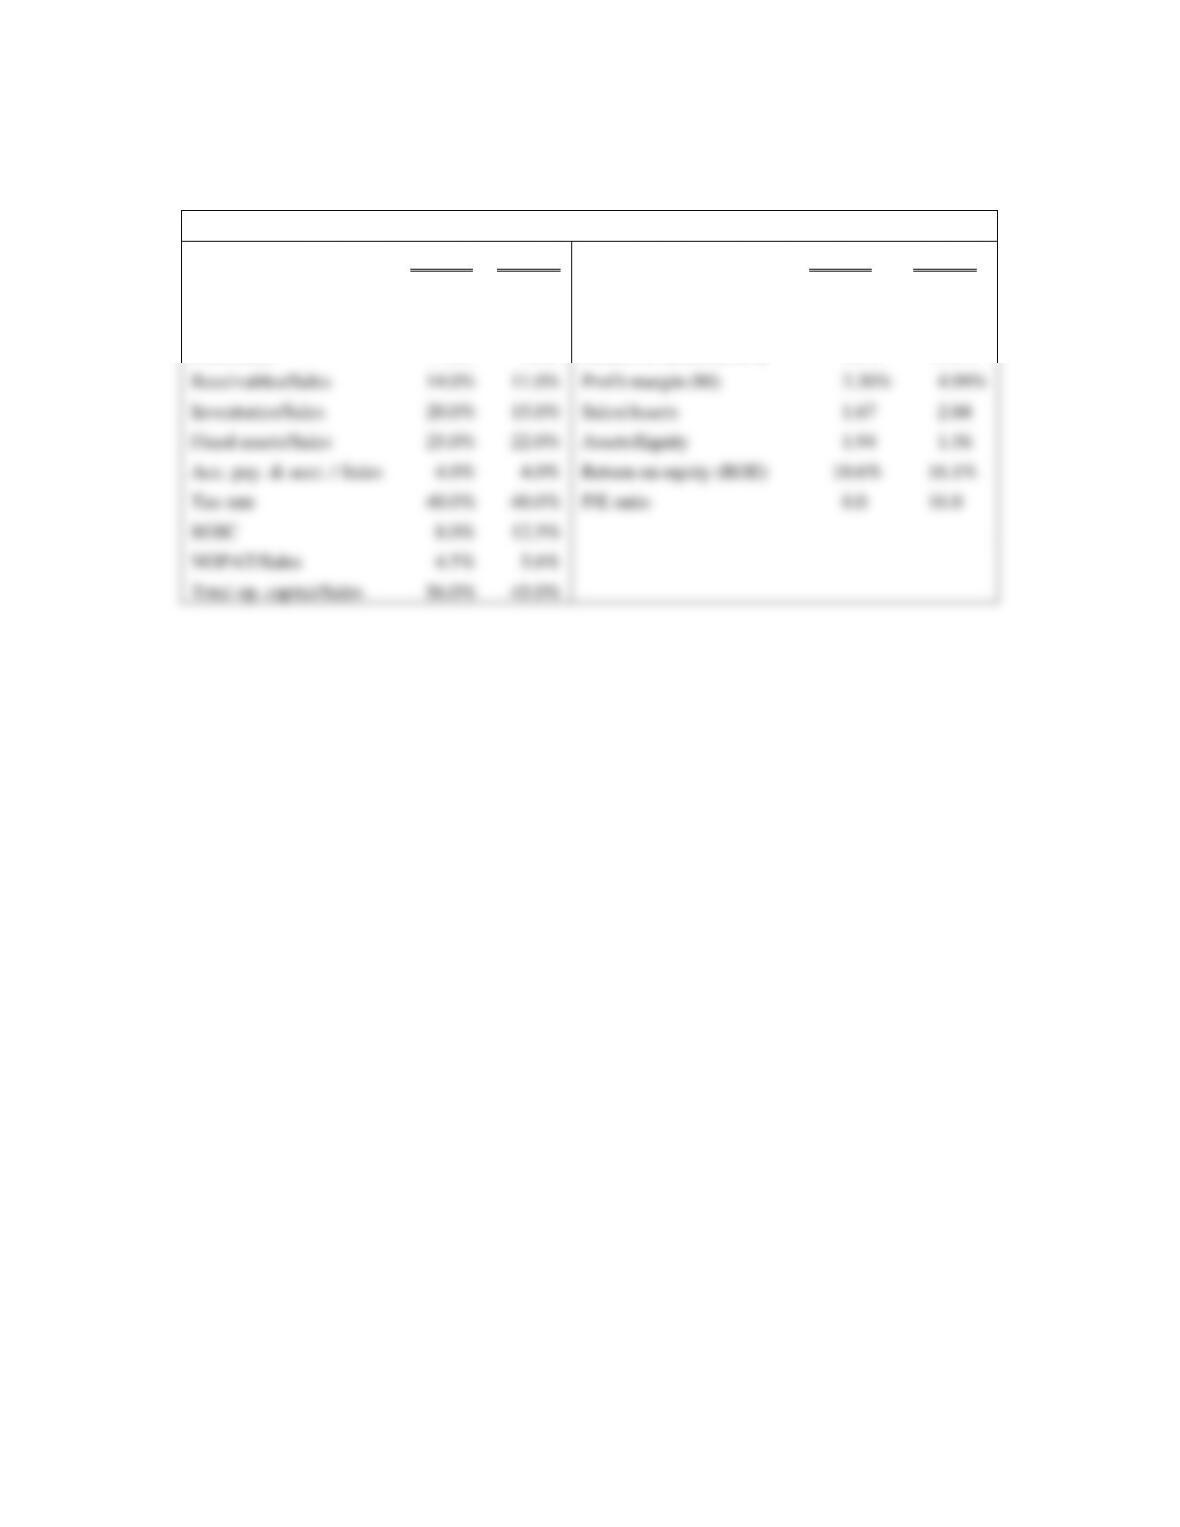
Selected Additional Data for 2013
Hatfield
Industry
Hatfield
Industry
Op. costs/Sales
90.0%
88.0%
Total liability/Total assets
48.3%
36.7%
Depr./FA
10.0%
12.0%
Times interest earned
3.8
8.9
Cash/Sales
1.0%
1.0%
Return on assets (ROA)
5.5%
10.2%
Note: Hatfield was operating at full capacity in 2013. Also, you may observe small differences in items like the ROE
when calculated in different ways. Any such differences are due to rounding, and they can be ignored.
Receivables/Sales
14.0%
11.0%
Profit margin (M)
3.30%
4.99%
Inventories/Sales
20.0%
15.0%
Sales/Assets
2.04
Fixed assets/Sales
25.0%
22.0%
Assets/Equity
1.94
Acc. pay. & accr. / Sales
4.0%
4.0%
Return on equity (ROE)
10.6%
16.1%
Tax rate
40.0%
40.0%
P/E ratio
8.0
16.0
ROIC
8.0%
12.5%
NOPAT/Sales
4.5%
5.6%
Total op. capital/Sales
56.0%
45.0%
Mini Case: 12 – 14
a. Using Hatfield’s data and its industry averages, how well run would you say
Hatfield appears to be in comparison with other firms in its industry? What are its
primary strengths and weaknesses? Be specific in your answer, and point to various
ratios that support your position. Also, use the Du Pont equation (see Chapter 3) as
one part of your analysis.
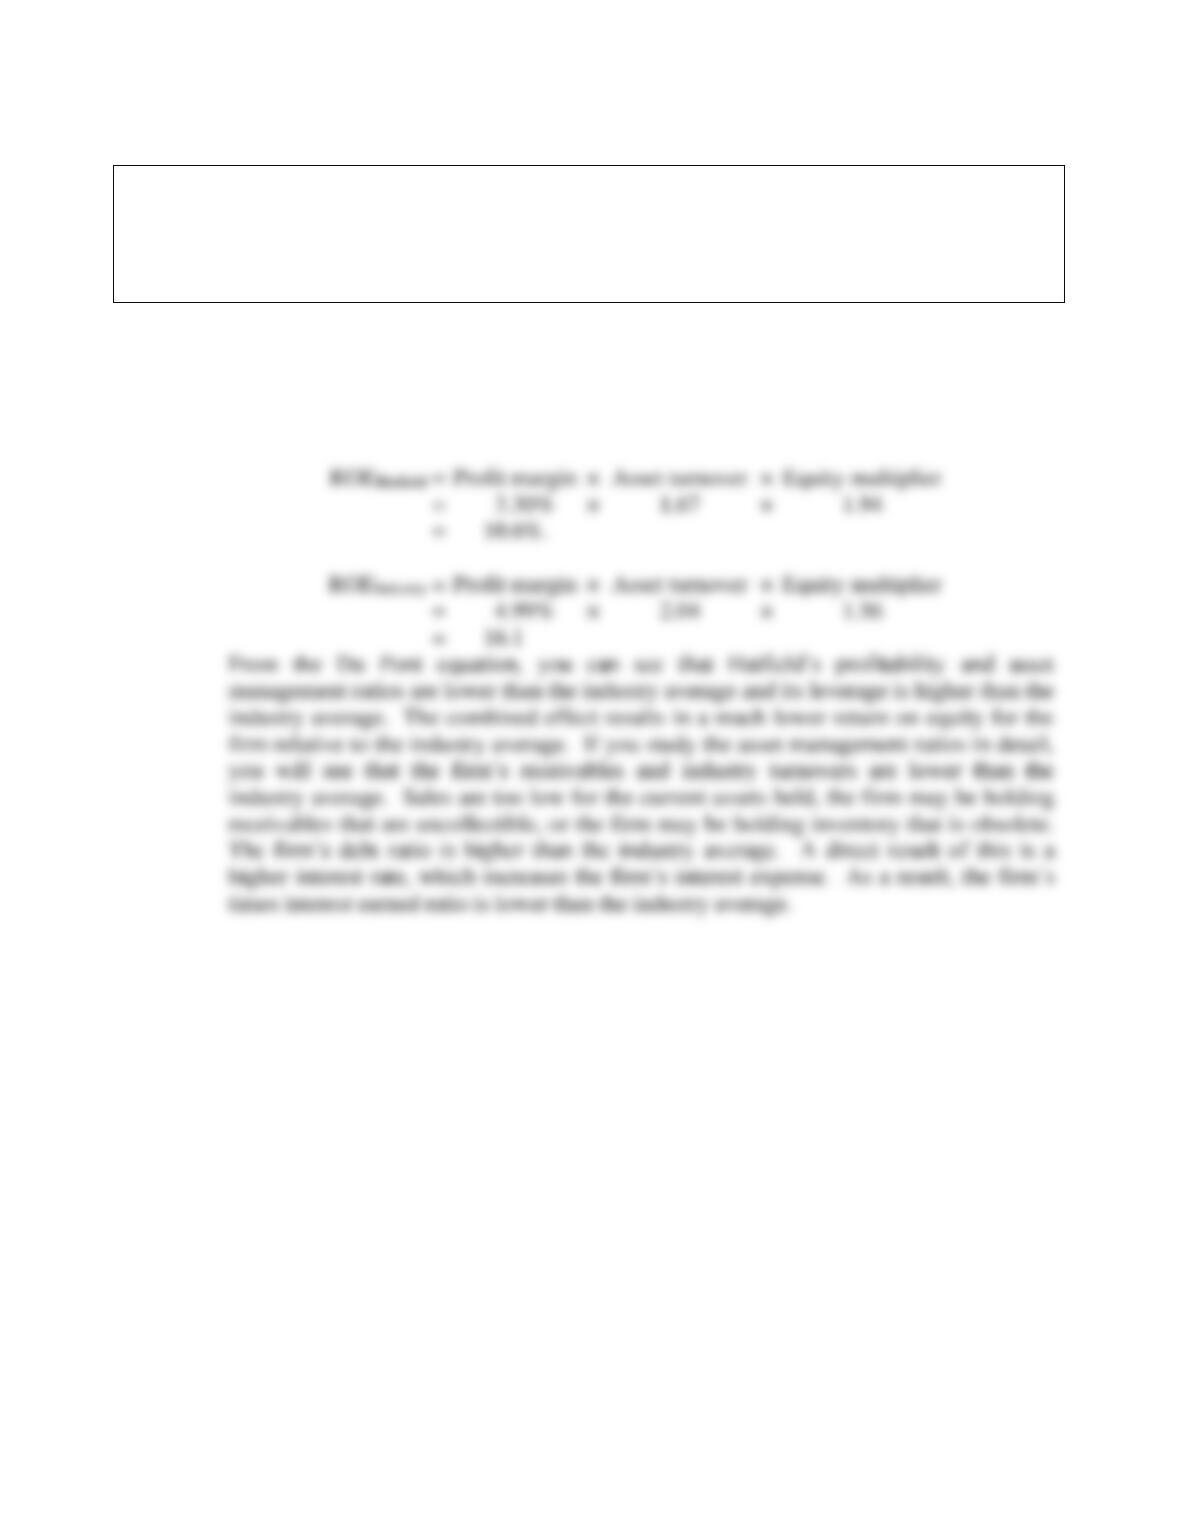
Answer: The Du Pont equation shows the relationship among asset management, profitability
ratios, and leverage. By examining this equation we can determine where Hatfield falls
short of the industry.
Mini Case: 12 – 15
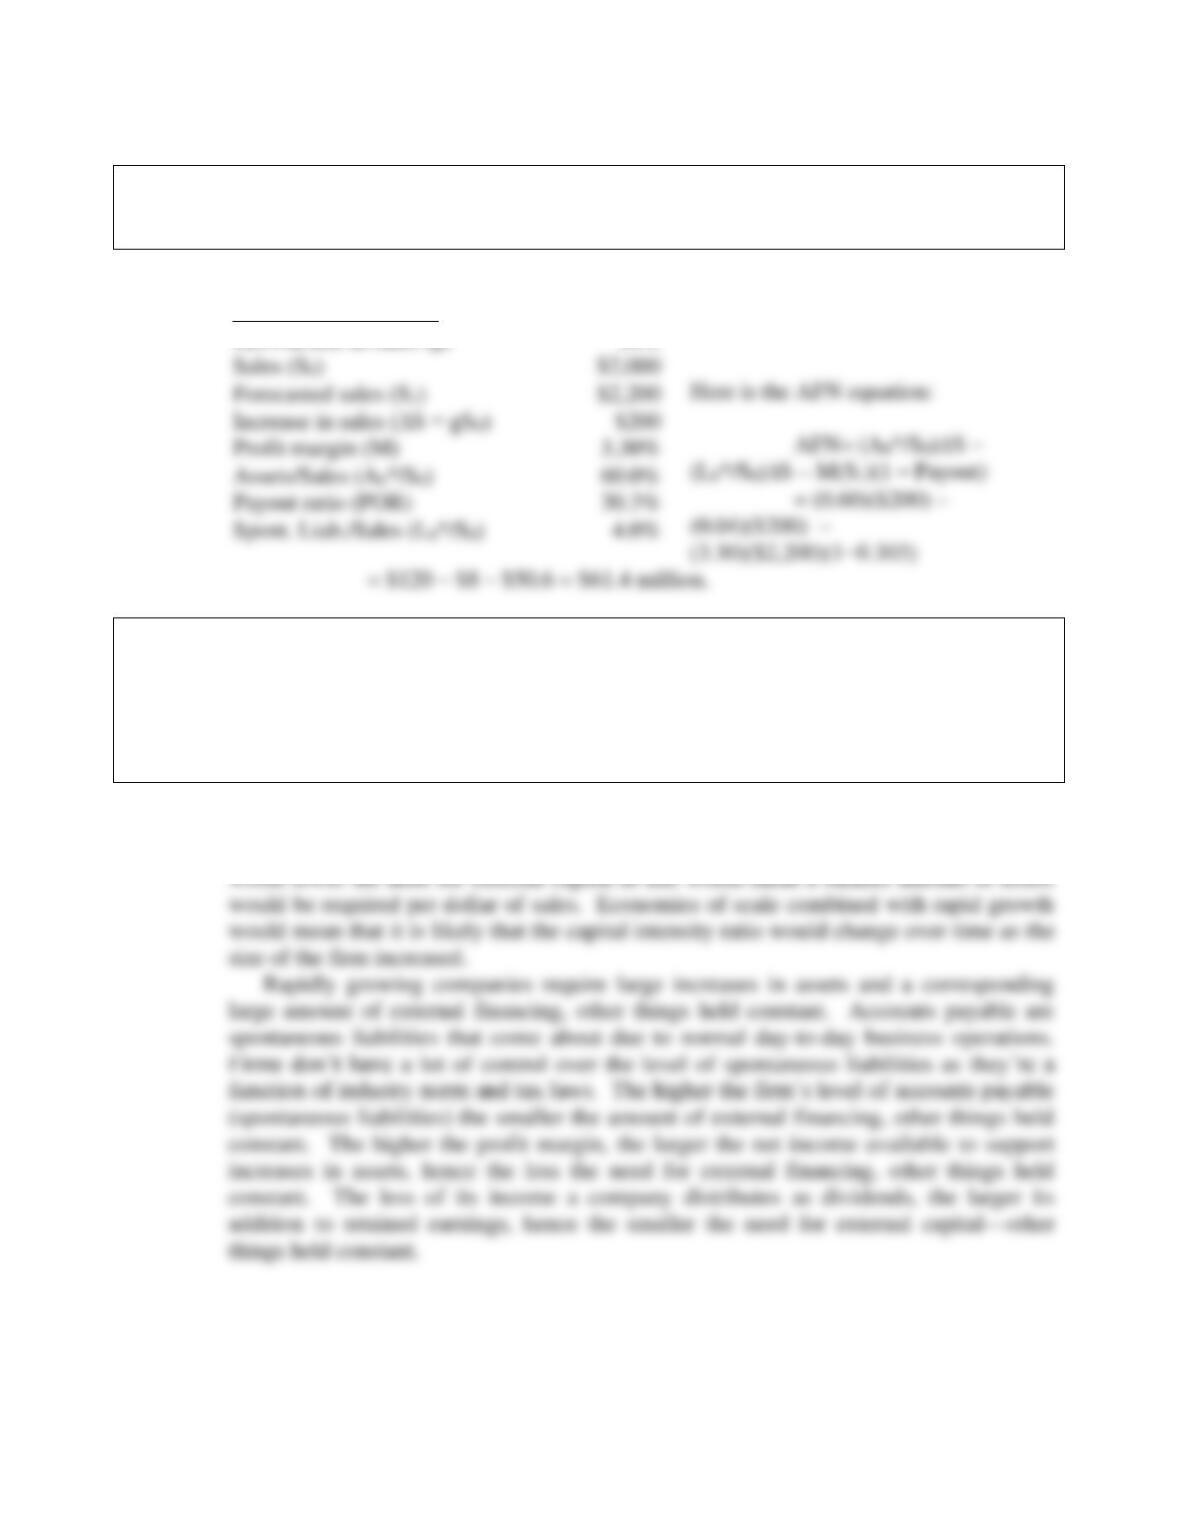
b. Use the AFN equation to estimate Hatfield’s required new external capital for 2014
if the sale growth rate is 10%. Assume that the firm’s 2013 ratios will remain the
same in 2014. (Hint: Hatfield was operating at full capacity in 2013.)
Answer:
Here is the AFN equation:
c. Define the term capital intensity. Explain how a decline in capital intensity would
affect the AFN, other things held constant. Would economies of scale combined
with rapid growth affect capital intensity, other things held constant? Also, explain
how changes in each of the following would affect AFN, holding other things
constant: the growth rate, the amount of accounts payable, the profit margin, and
the payout ratio.
Answer: The capital intensity ratio is the amount of assets required per dollar of sales, A0*/S0, and
it has a major effect on capital requirements. A decline in the capital intensity ratio
Data for AFN Method
Growth rate in sales (g)
10%
Sales (S0)
Forecasted sales (S1)
Profit margin (M)
Payout ratio (POR)
Spont. Liab./Sales (L0*/S0)
Mini Case: 12 – 16
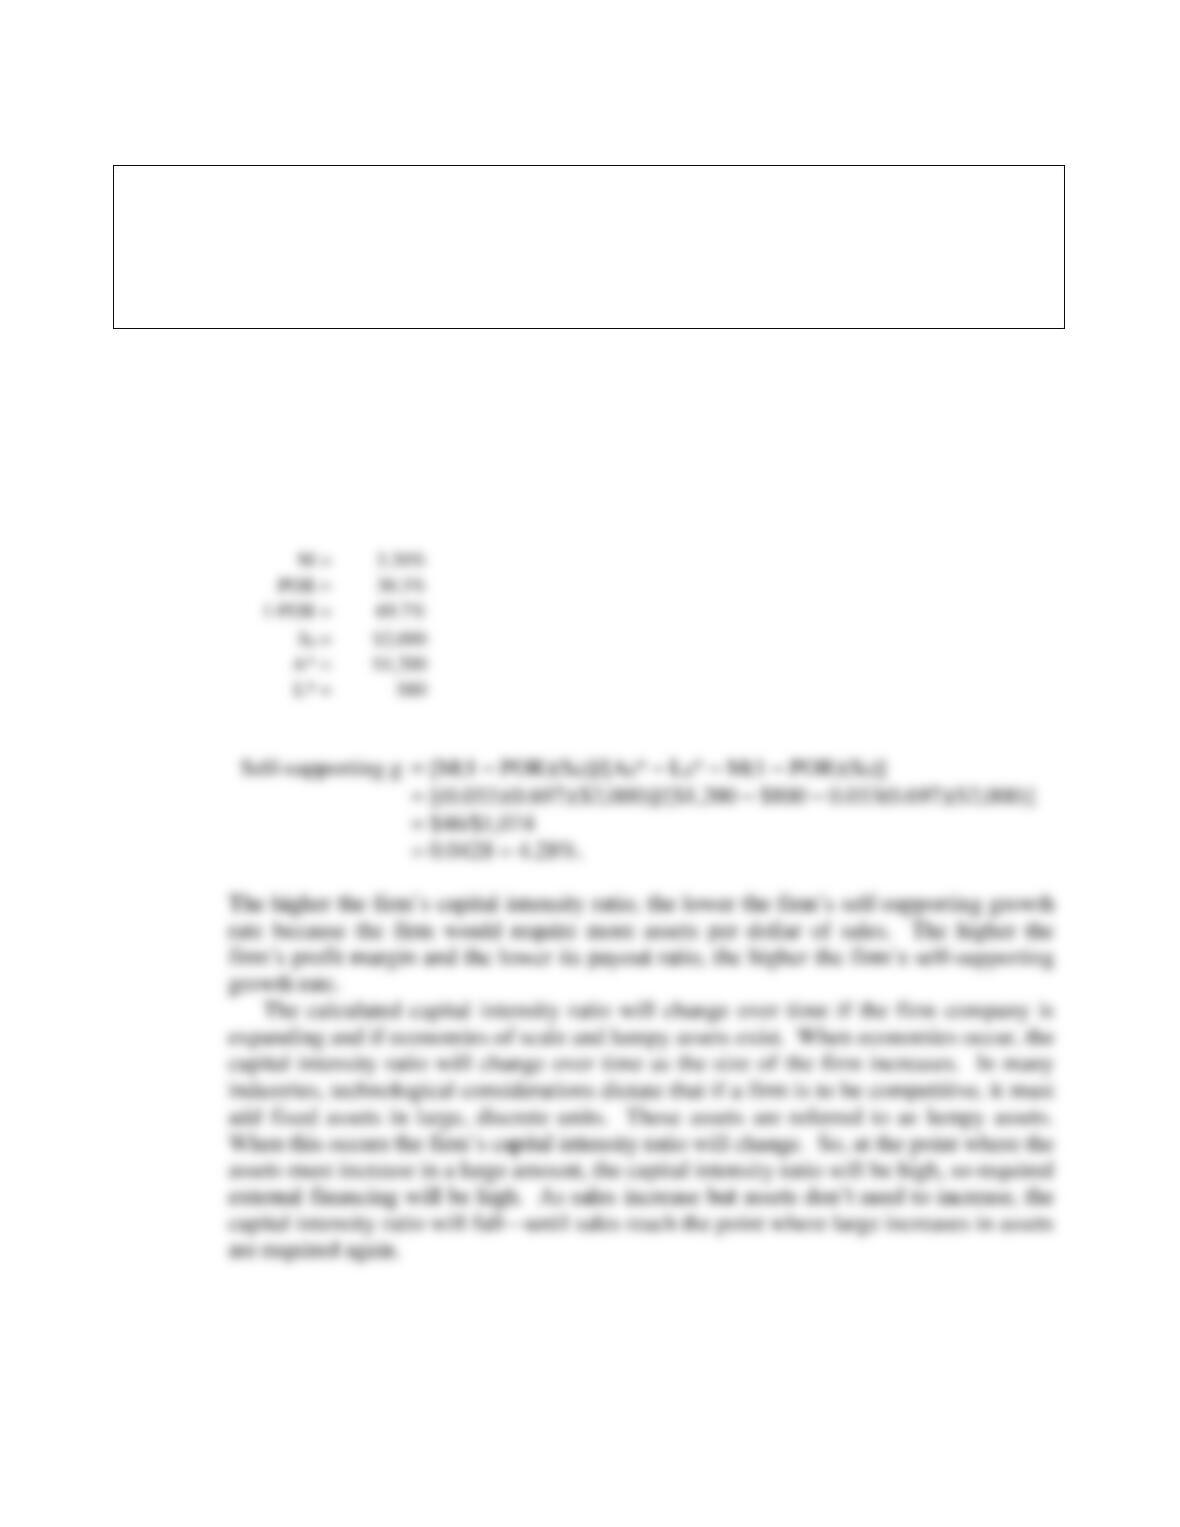
d. Define the term self-supporting growth rate. What is Hatfield’s self-supporting
growth rate? Would the self-supporting growth rate be affected by a change in the
capital intensity ratio or the other factors mentioned in the previous question?
Other things held constant, would the calculated capital intensity ratio change over
time if the company were growing and were also subject to economies of scale
and/or lumpy assets?
Answer: The self-supporting growth rate is the maximum growth rate the firm could achieve if it
had no access to external capital. From the data given, Hatfield’s self-supporting growth
rate is calculated as:
Self-supporting g = [M(1 – POR)(S0)]/[A0* – L0* – M(1 – POR)(S0)]
Mini Case: 12 – 17
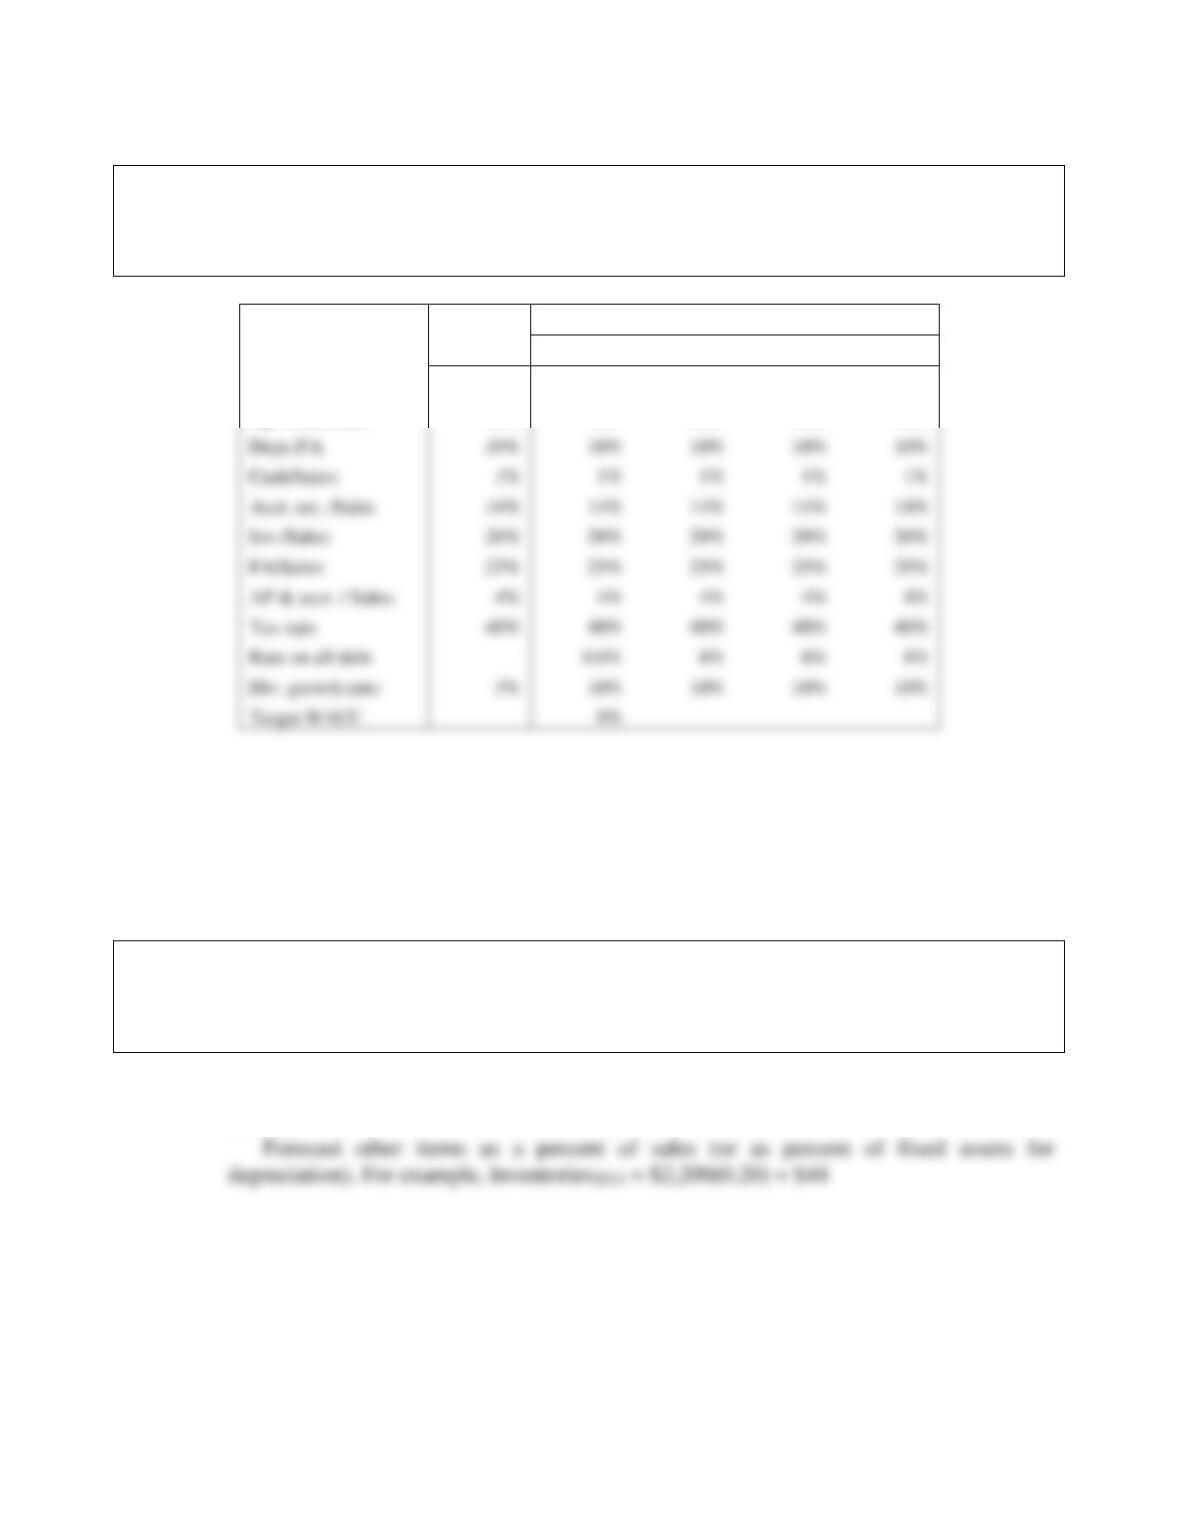
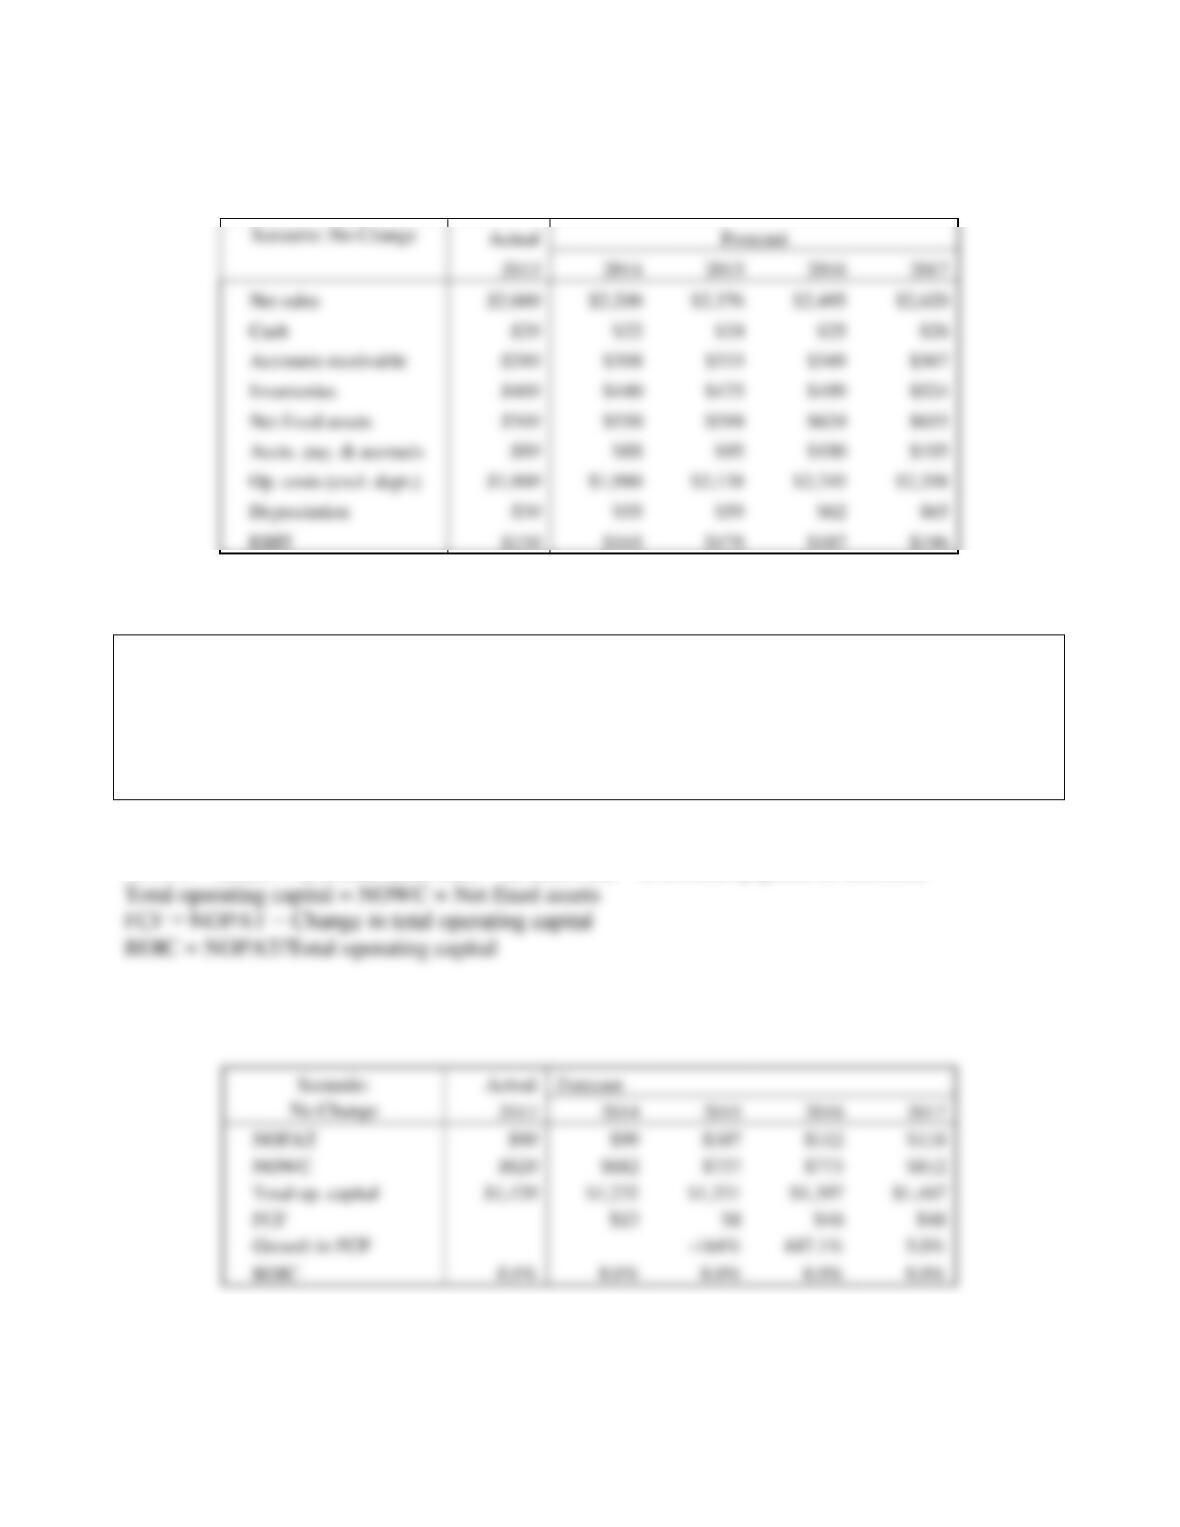
e. Use the following assumptions to answer the questions below: (1) Operating ratios
remain unchanged. (2) Sales will grow by 10%, 8%, 5%, and 5% for the next four
years. (3) The target weighted average cost of capital (WACC) is 9%. This is the
No Change scenario because operations remain unchanged.
Actual
Forecast
Inputs
2013
2014
2015
2016
2017
Sales growth rate:
10%
8%
5%
5%
Op. costs/Sales:
90%
90%
90%
90%
90%
e. 1. For each of the next four years, forecast the following items: sales, cash, accounts
receivable, inventories, net fixed assets, accounts payable & accruals, operating
costs (excluding depreciation), depreciation, and earnings before interest and taxes
(EBIT).
Forecast sales as Salest = Salest-1(1+gt). For example, Sales2014 = $2,000(1+0.10) =
$2,200.
Depr./FA
10%
10%
10%
10%
10%
Acct. rec. /Sales
14%
14%
14%
14%
14%
Inv./Sales:
20%
20%
20%
20%
20%
FA/Sales:
25%
25%
25%
25%
25%
AP & accr. / Sales:
4%
4%
4%
4%
Tax rate:
40%
40%
40%
40%
40%
Rate on all debt
8%
8%
8%
Div. growth rate:
10%
10%
10%
10%
Target WACC
9%
Mini Case: 12 – 18
e. 2. Using the previously forecasted items, calculate for each of the next four years the
net operating profit after taxes (NOPAT), net operating working capital, total
operating capital, free cash flow, (FCF), annual growth rate in FCF, and return on
invested capital. What does the forecasted free cash flow in the first year imply
about the need for external financing? Compare the forecasted ROIC compare
with the WACC. What does this imply about how well the company is performing?
NOPAT = EBIT(1-T)
NOWC = (Cash + accounts receivable + inventories) − (Accounts payable & accruals)
Mini Case: 12 – 19
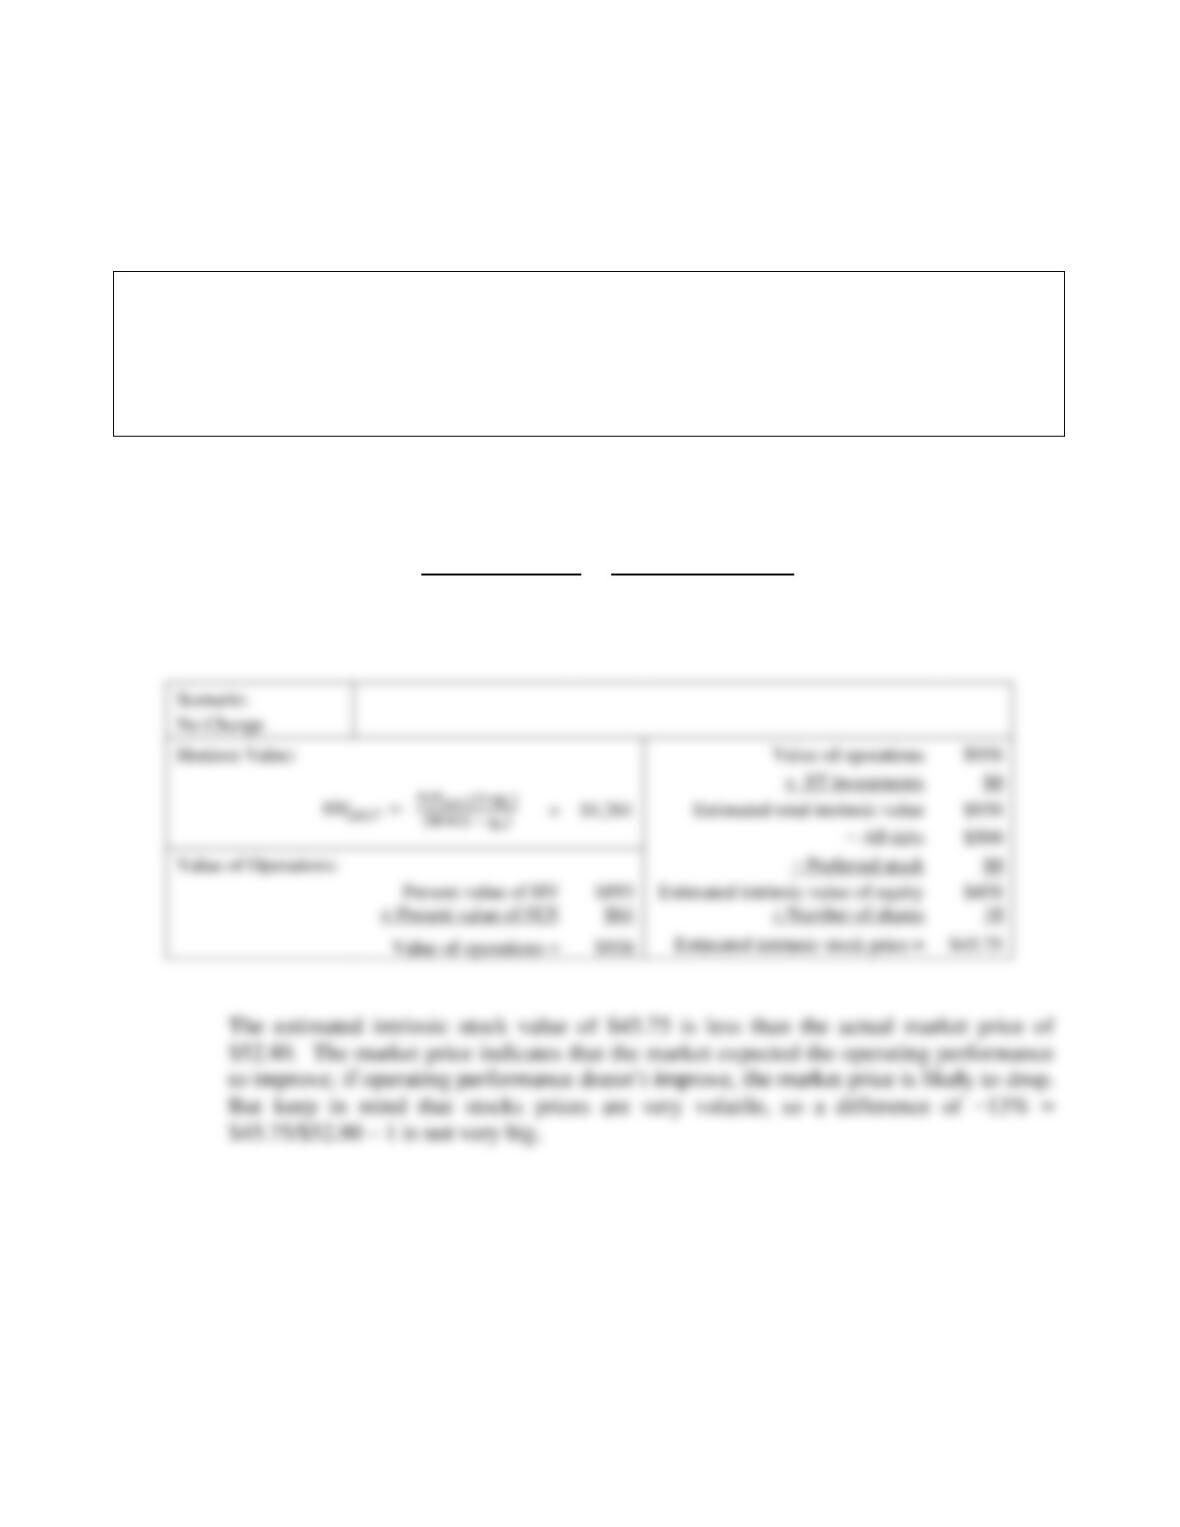
e. 3. Assume that FCF will continue to grow at the growth rate for the last year in the
forecast horizon (Hint: 5%). What is the horizon value at 2017? What is the present
value of the horizon value? What is the present value of the forecasted FCF? (Hint:
use the free cash flows for 2014 through 2017). What is the current value of
operations? Using information from the 2013 financial statements, what is the
current estimated intrinsic stock price?
With no rounding in intermediate steps, FCF2017 = $48.025.
HV2017 = FCF2017(1 + gL)
(WACC − gL)=$48.025(1 + 0.05)
(0.09 − 0.05)=$1,261
Mini Case: 12 – 20
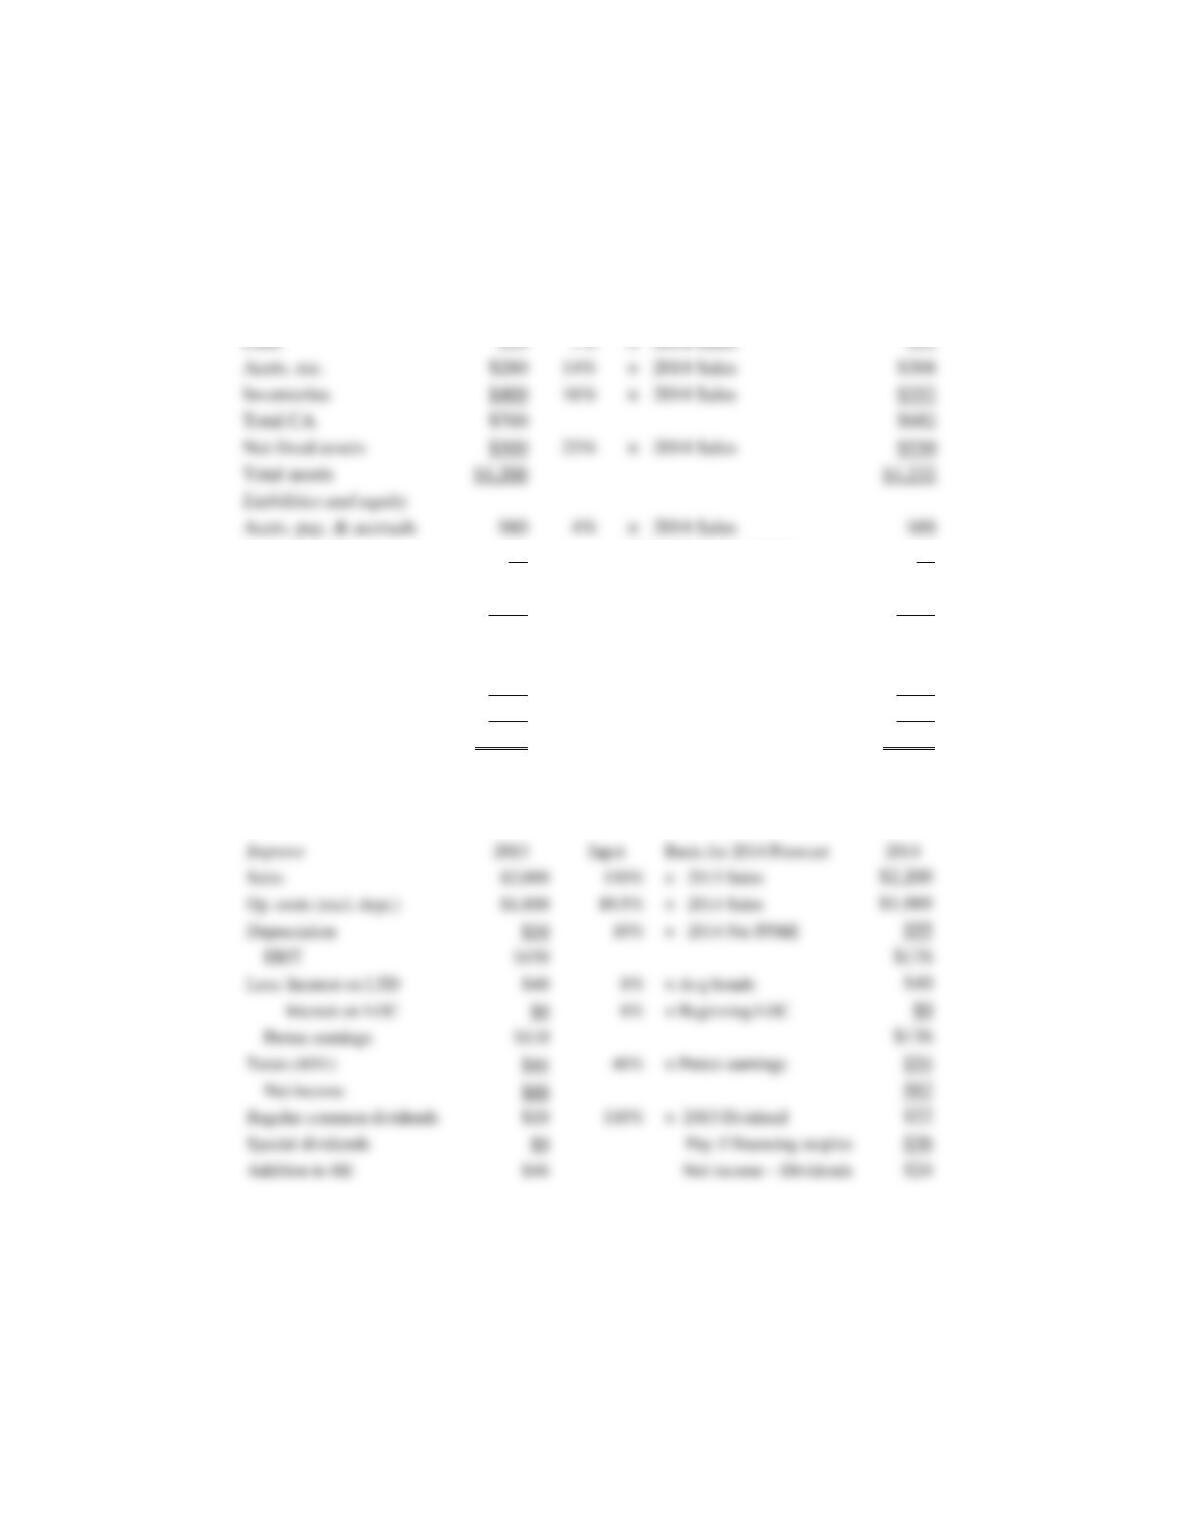
f. Continue with the same assumptions for the No Change scenario from the previous
question, but now forecast the balance sheet and income statements for 2014 (but
not for the following three years) using the following preliminary financial policy.
(1) Regular dividends will grow by 10%. (2) No additional long-term debt or
common stock will be issued. (3) The interest rate on all debt is 8%. (4) Interest
expense for long-term debt is based on the average balance during the year. (5) If
the operating results and the preliminary financing plan cause a financing deficit,
eliminate the deficit by drawing on a line of credit. The line of credit would be
tapped on the last day of the year, so it would create no additional interest expenses
for that year. (6) If there is a financing surplus, eliminate it by paying a special
dividend. After forecasting the 2014 financial statements, answer the following
questions.
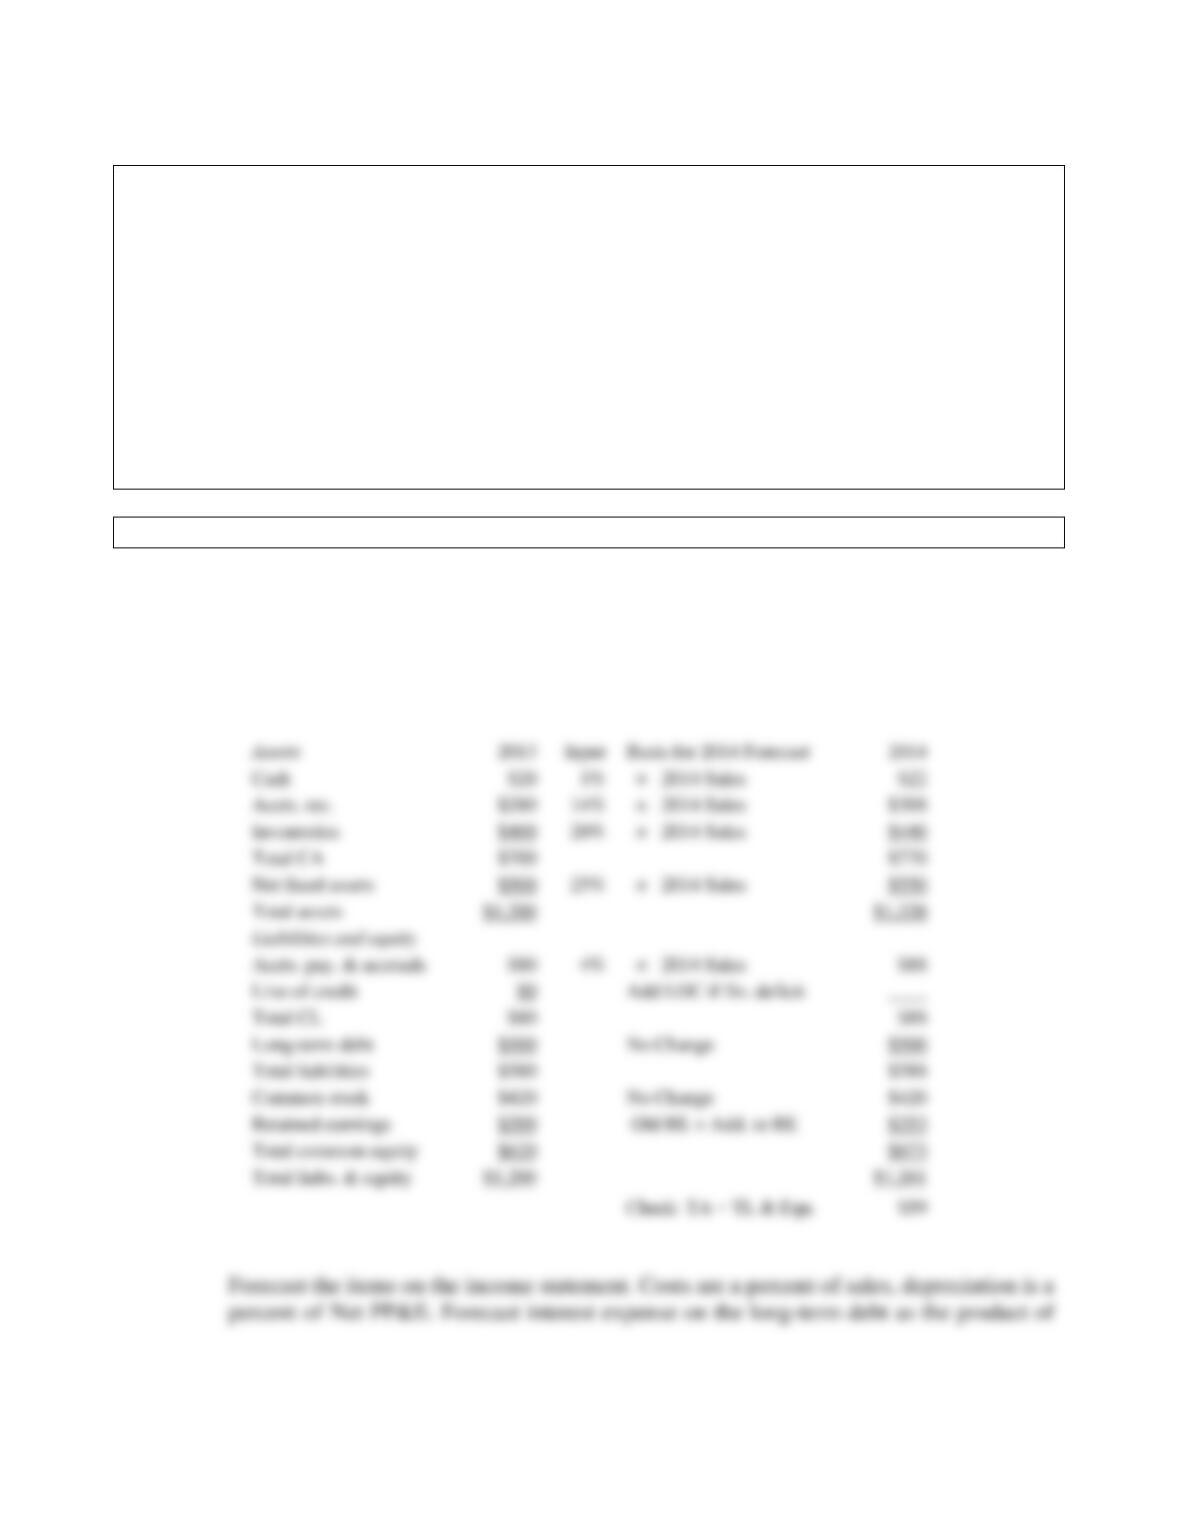
f. 1. How much will Hatfield need to draw on the line of credit?
Answer: Forecast sales and then items on the balance sheet. The forecast of sales is $2,200.
Forecast the operating items as a percent of sales. The preliminary financial policy
specifies no change in the long-term debt or common stock. Retained earnings increase
by the addition to retained earnings from the forecasted income statement. Leave the line
of credit blank for now.
Mini Case: 12 – 21
the interest rate and the average balance on the long-term debt (i.e., the average of the
beginning value and the ending value). Pay a regular dividend. Leave the special
dividend blank for now.
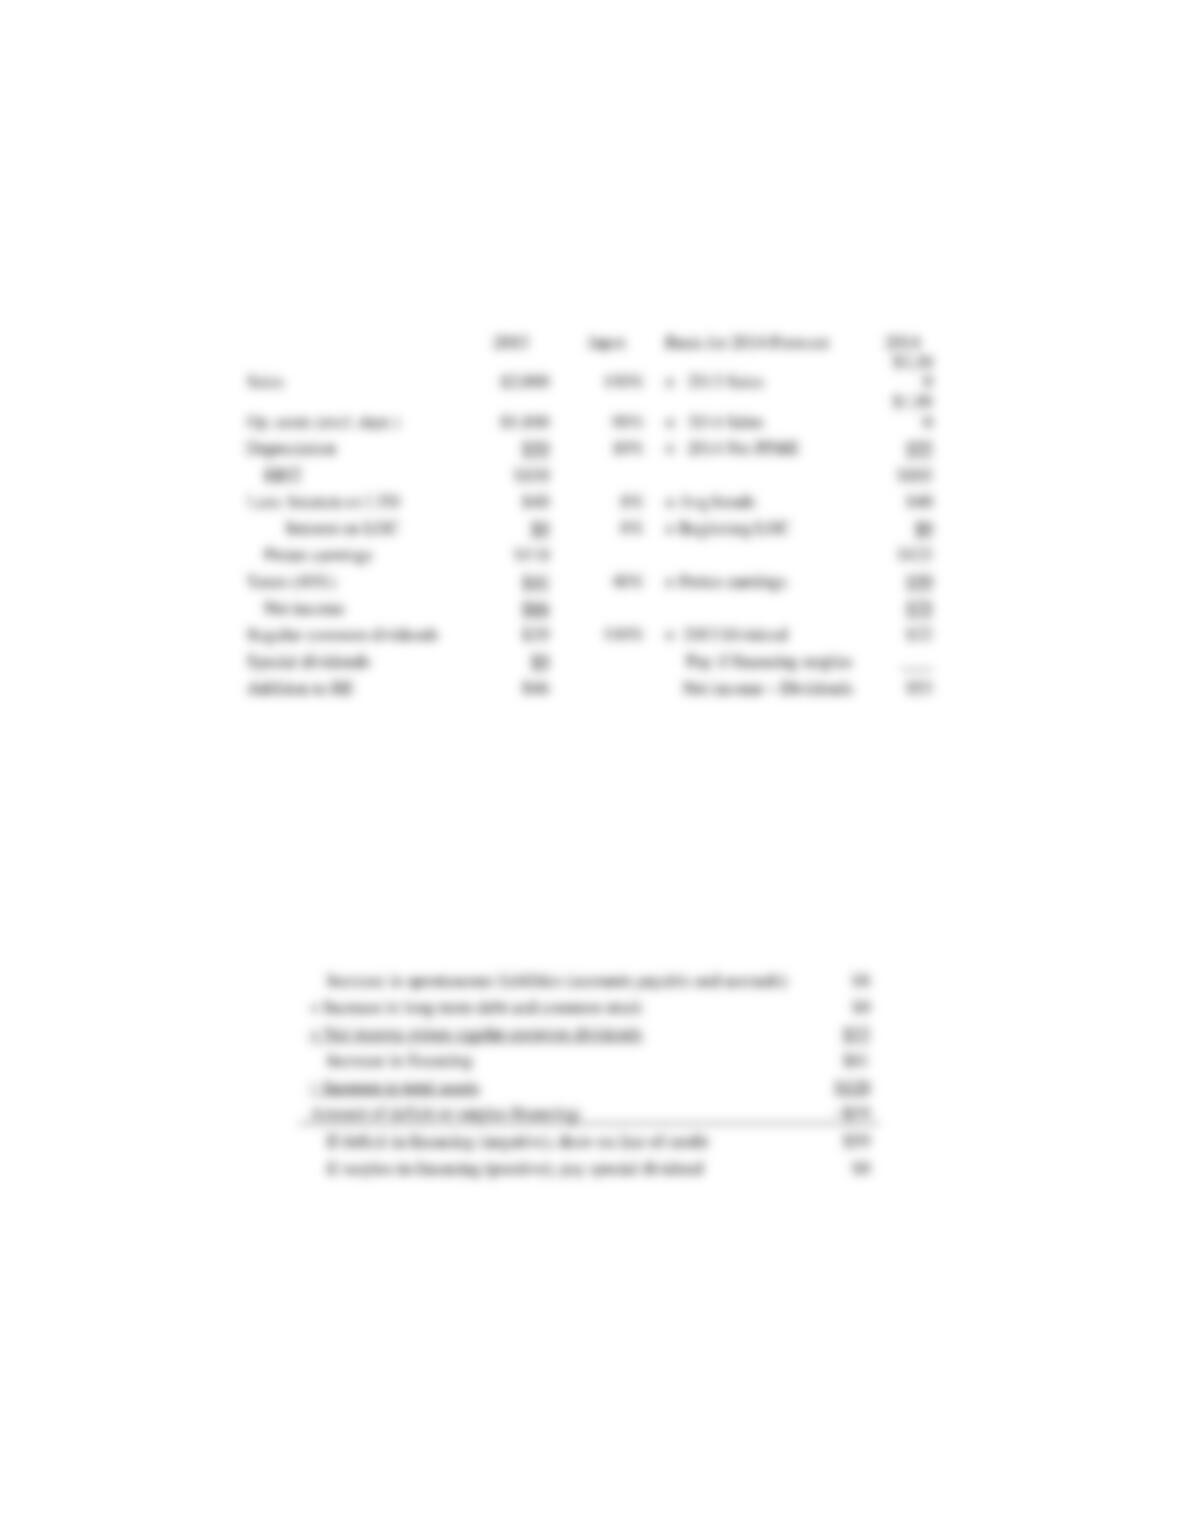
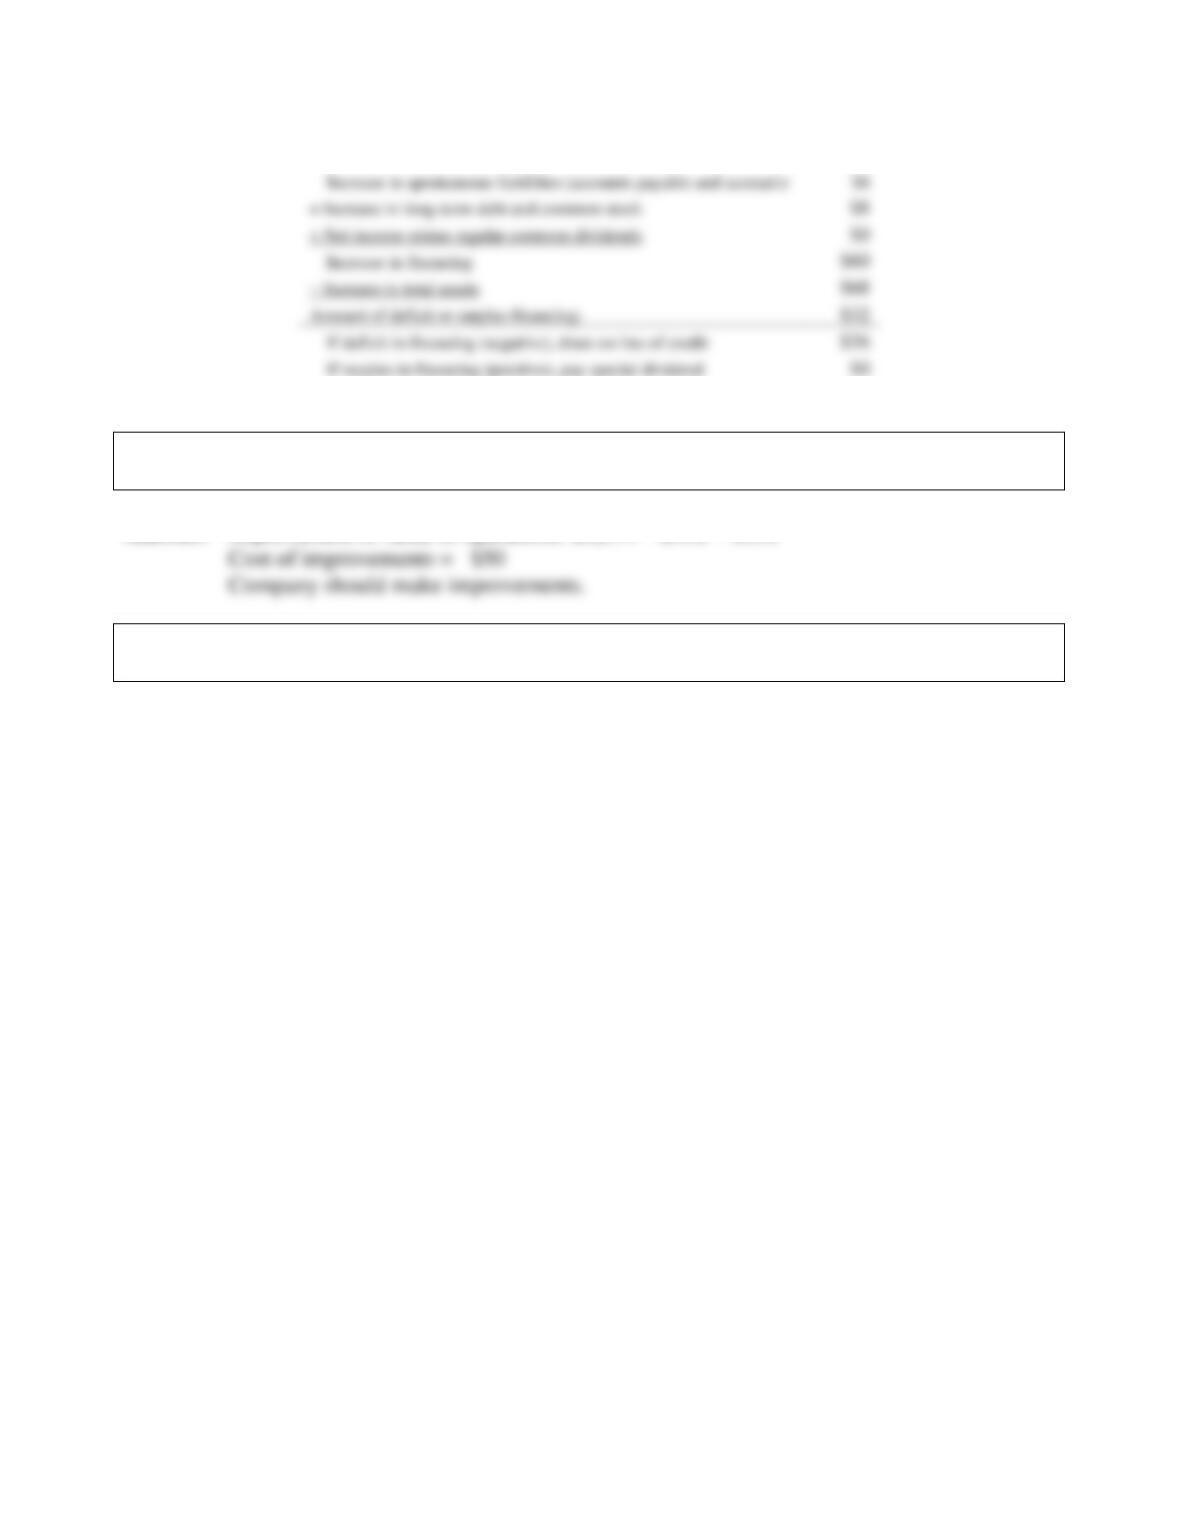
The next step is to identify the financing surplus or deficit. Start with the additions to
operating assets, subtract the increase in spontaneous liabilities (accounts payable and
accruals), subtract any new external financing from long-term debt or common stock,
and subtract the amount of reinvested net income (the amount that is not paid out in
common dividends). The result is the financing deficit (if it is negative) or the financing
surplus (if it is positive). If there is a deficit, draw on the LOC. If there is a surplus, pay a
special dividend.
Mini Case: 12 – 22
There is a deficit of $59, so update the balance sheets by adding $59 to the line of credit.
Because the LOC is added at the end of the year, there is no additional interest, so there
is no need to update the income statement. If the LOC were instead added earlier in the
year, there would be additional interest, which would cause lower net income, which
would cause a lower addition to retained earnings, which would cause a bigger financial
deficit. This is called financing feedback. See Ch12 Tool Kit.xls and look at the
worksheet CFO Model for a simple way to resolve financing feedback and for an
extension of the 1-year forecasted financial statements to multiple years.
f. 2. What are some alternative ways than those in the preliminary financial policy that
Hatfield might choose to eliminate the financing deficit?
Answer: Here are some alternative ways to eliminate the deficit:
Cut dividends.
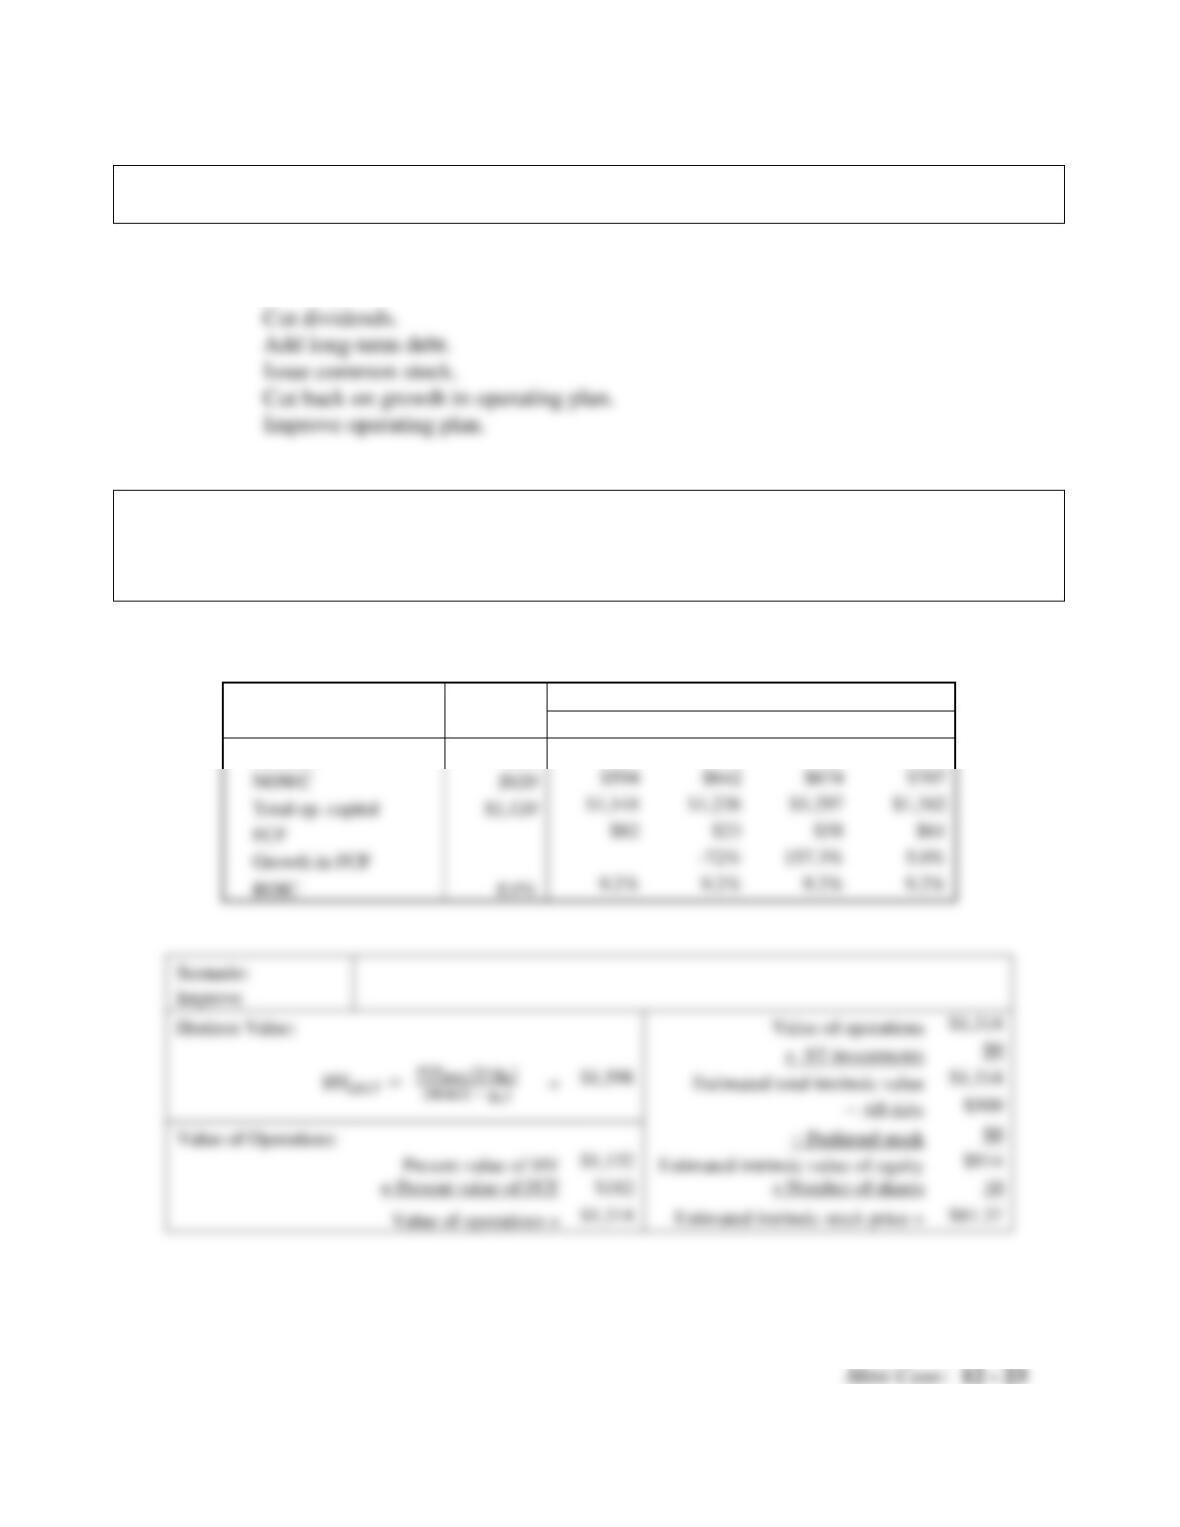
g. Repeat the analysis performed the previous question but now assume that Hatfield
is able to improve the following inputs: (1) reduce operating costs (excluding
depreciation)/sales to 89.5% at a cost of $40 million; and (2) reduce
inventories/sales to 16% at a cost of $10 million. This is the Improve scenario.
Answer: The impact on the operating plan is shown below:
Scenario:
Actual
Forecast
Improve
2013
2014
2015
2016
2017
NOPAT
$90
$106
$114
$120
$126
NOWC
$594
$642
$674
$707
Total op. capital
FCF
Growth in FCF
ROIC
Scenario:
Horizon Value:
Value of Operations:
Mini Case: 12 – 24
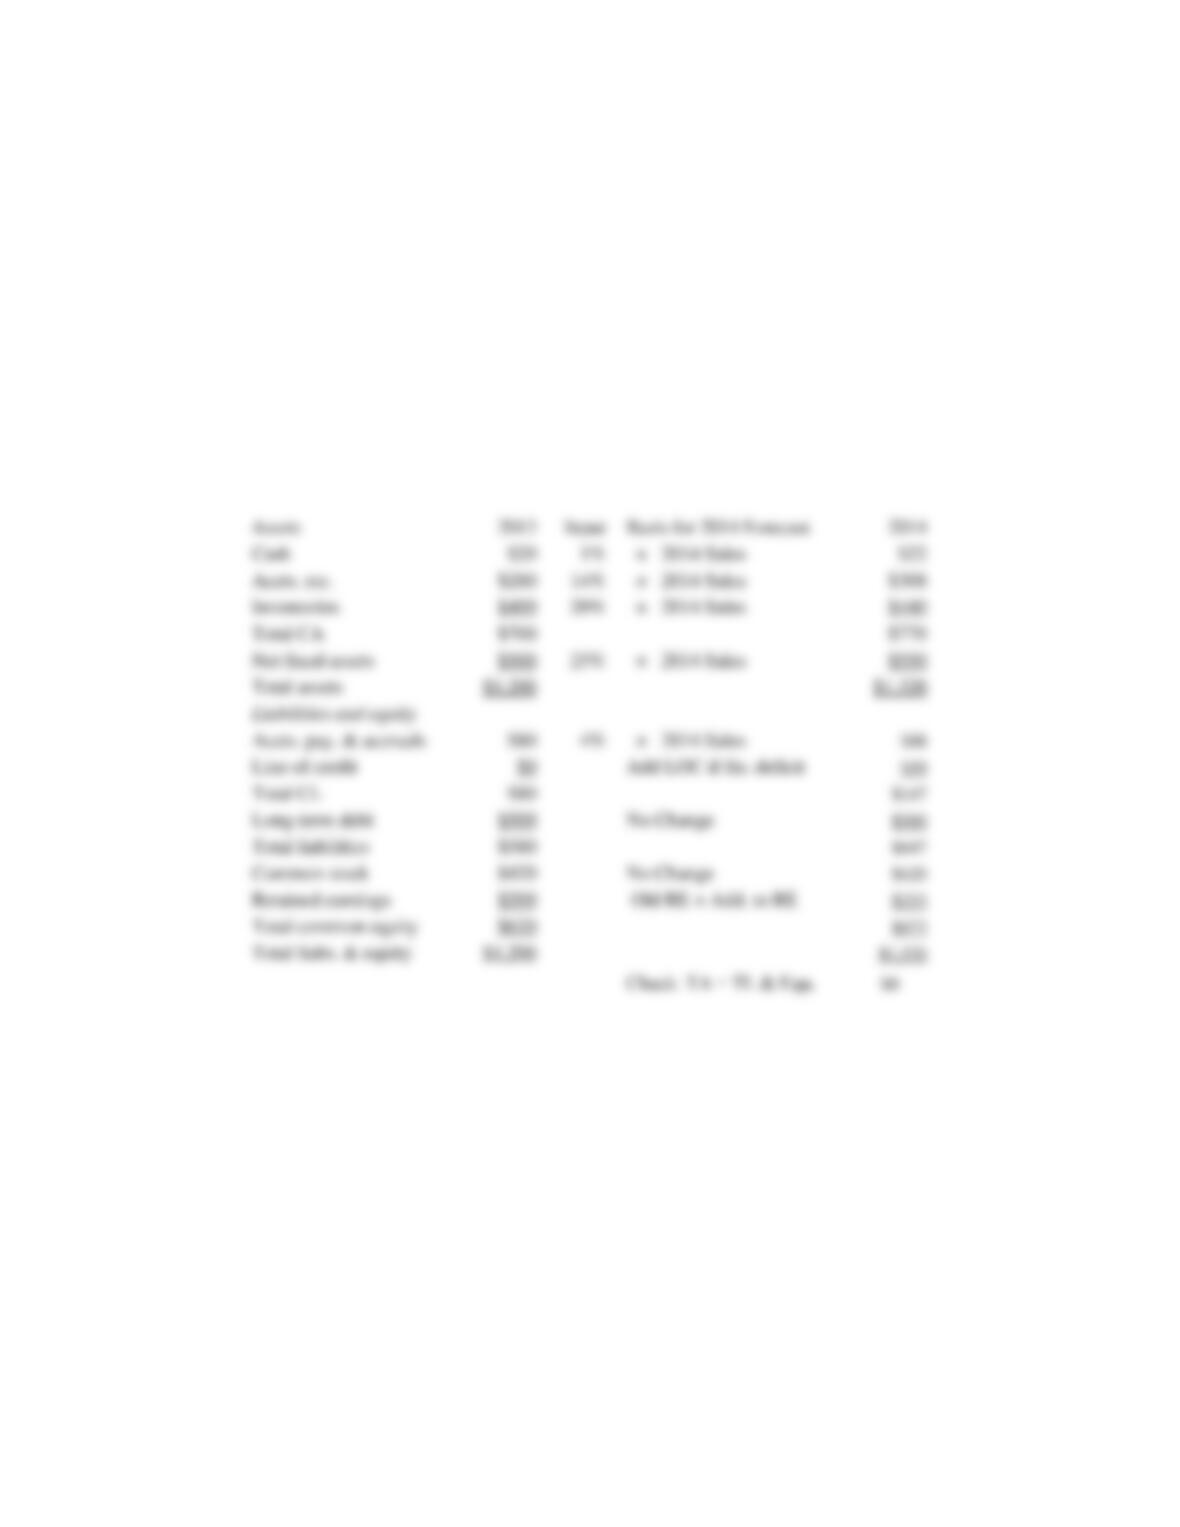
The impact on the financial statements is shown below.
Scenario:
Improve
Assets
2013
Input
Basis for 2014 Forecast
2014
Line of credit
$0
Add LOC if fin. deficit
$0
Total CL
$80
$88
Long-term debt
$500
No Change
$500
Total liabilities
$580
$588
Common stock
$420
No Change
$420
Retained earnings
$200
Old RE + Add. to RE
$224
Total common equity
$620
$644
Total liabs. & equity
$1,200
$1,232
Check: TA − TL & Equ.
$0
Cash
$20
$22
Accts. rec.
$280
$308
Inventories
$400
$352
Total CA
$700
$682
Net fixed assets
$500
$550
Total assets
$1,200
$1,232
Liabilities and equity
Accts. pay. & accruals
$80
$88
Mini Case: 12 – 25
g. 1. Should Hatfield implement the plans? How much value would they add to the
company?
Answer: Improvement in value of operations: $1,314 − $958 = $356
g. 2. How much can Hatfield pay as a special dividend in the Improve Scenario? What
else might Hatfield do with the financing surplus?
Answer: Hatfield can pay a special dividend of $35. Instead, Hatfield could repurchase stock,
repay debt, or purchase marketable securities.