Solution 12/7/2012
Chapter: 12
Problem: 10
Key Input Data: Used in the
forecast
Tax rate 40%
Dividend growth rate 8%
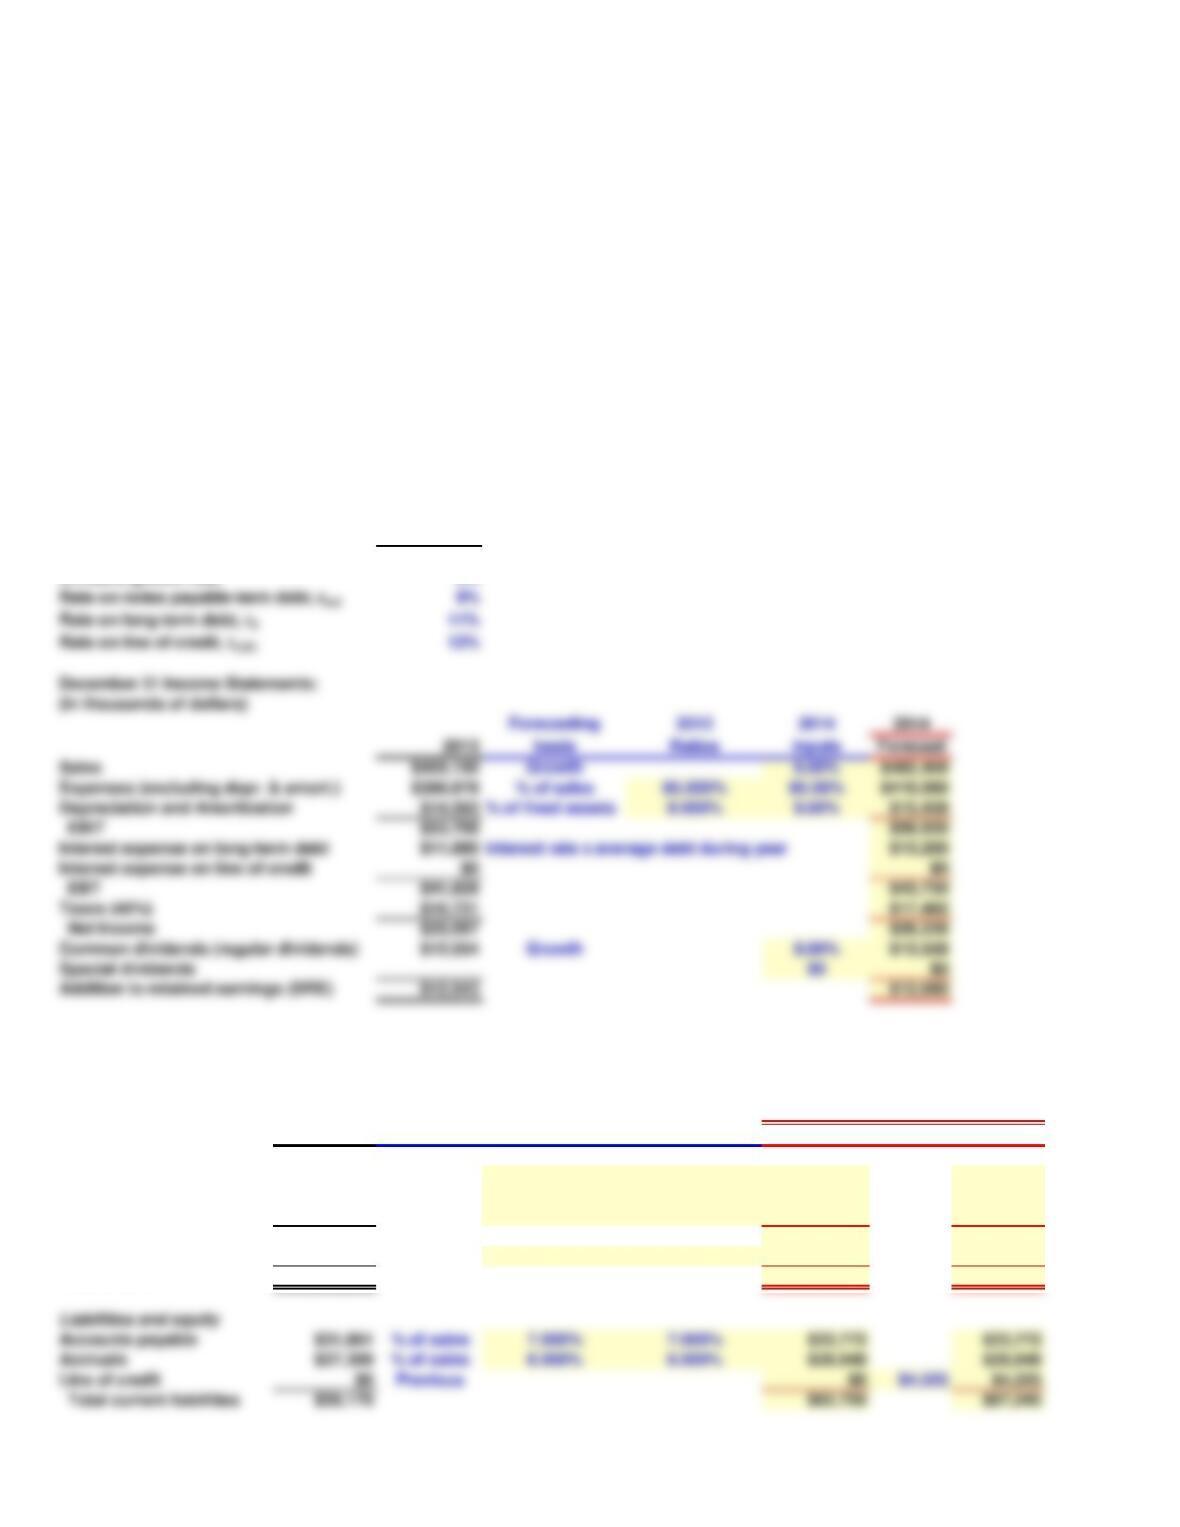
December 31 Balance Sheets
(in thousands of dollars)
Forecasting 2013 2014 2014
2013 basis Ratios Inputs Without adj. Adj. With Adj.
Assets:
Cash $18,206 % of sales 4.000% 4.000% $19,298 $19,298
Accounts Receivable $100,133 % of sales 22.000% 22.000% $106,141 $106,141
Inventories $45,515 % of sales 10.000% 10.000% $48,246 $48,246
Total current assets $163,854 $173,685 $173,685
Fixed assets $182,060 % of sales 40.000% 40.000% $192,984 $192,984
Total assets $345,914 $366,669 $366,669
Accounts payable $31,861 % of sales 7.000% 7.000% $33,772 $33,772
Accruals $27,309 % of sales 6.000% 6.000% $28,948 $28,948
Line of credit $0 Previous $0 $4,525 $4,525
Total current liabilities $59,170 $62,720 $67,245
Start with the partial model in the file Ch12 P10 Build a Model.xls on the textbook’s Web site, which contains the
2013 financial statements of Zieber Corporation. Forecast Zeiber’s 2014 income statement and balance sheets. Use
the following assumptions: (1) Sales grow by 6%. (2) The ratios of expenses to sales, depreciation to fixed assets,
cash to sales, accounts receivable to sales, and inventories to sales will be the same in 2014 as in 2013. (3) Zeiber
will not issue any new stock or new long-term bonds. (4) The interest rate is 11% for long-term debt and the interest
expense on long-term debt is based on the average balance during the year . (5) No interest is earned on cash. (6)
Dividends grow at an 8% rate. (6) Calculate the additional funds needed (AFN). If new financing is required, assume
it will be raised by drawing on a line of credit with an interest rate of 12%. Assume that any draw on the line of credit
will be made on the last day of the year, so there will be no additional interest expense for the new line of credit. If
surplus funds are available, pay a special dividend.
a. What are the forecasted levels of notes payable and special dividends?
December 31 Income Statements:
(in thousands of dollars)
Expenses (excluding depr. & amort.) $386,878 % of sales 85.000% 85.00% $410,090
Depreciation and Amortization $14,565 % of fixed assets 8.000% 8.00% $15,439
EBIT $53,708 $56,930
Interest expense on long-term debt $11,880 Interest rate x average debt during year $13,200
Interest expense on line of credit $0 $0
EBT $41,828 $43,730
Taxes (40%) $16,731 $17,492
Net Income $25,097 $26,238
Common dividends (regular dividends) $12,554 Growth 8.00% $13,558
Special dividends $0 $0
Addition to retained earnings (DRE) $12,543 $12,680
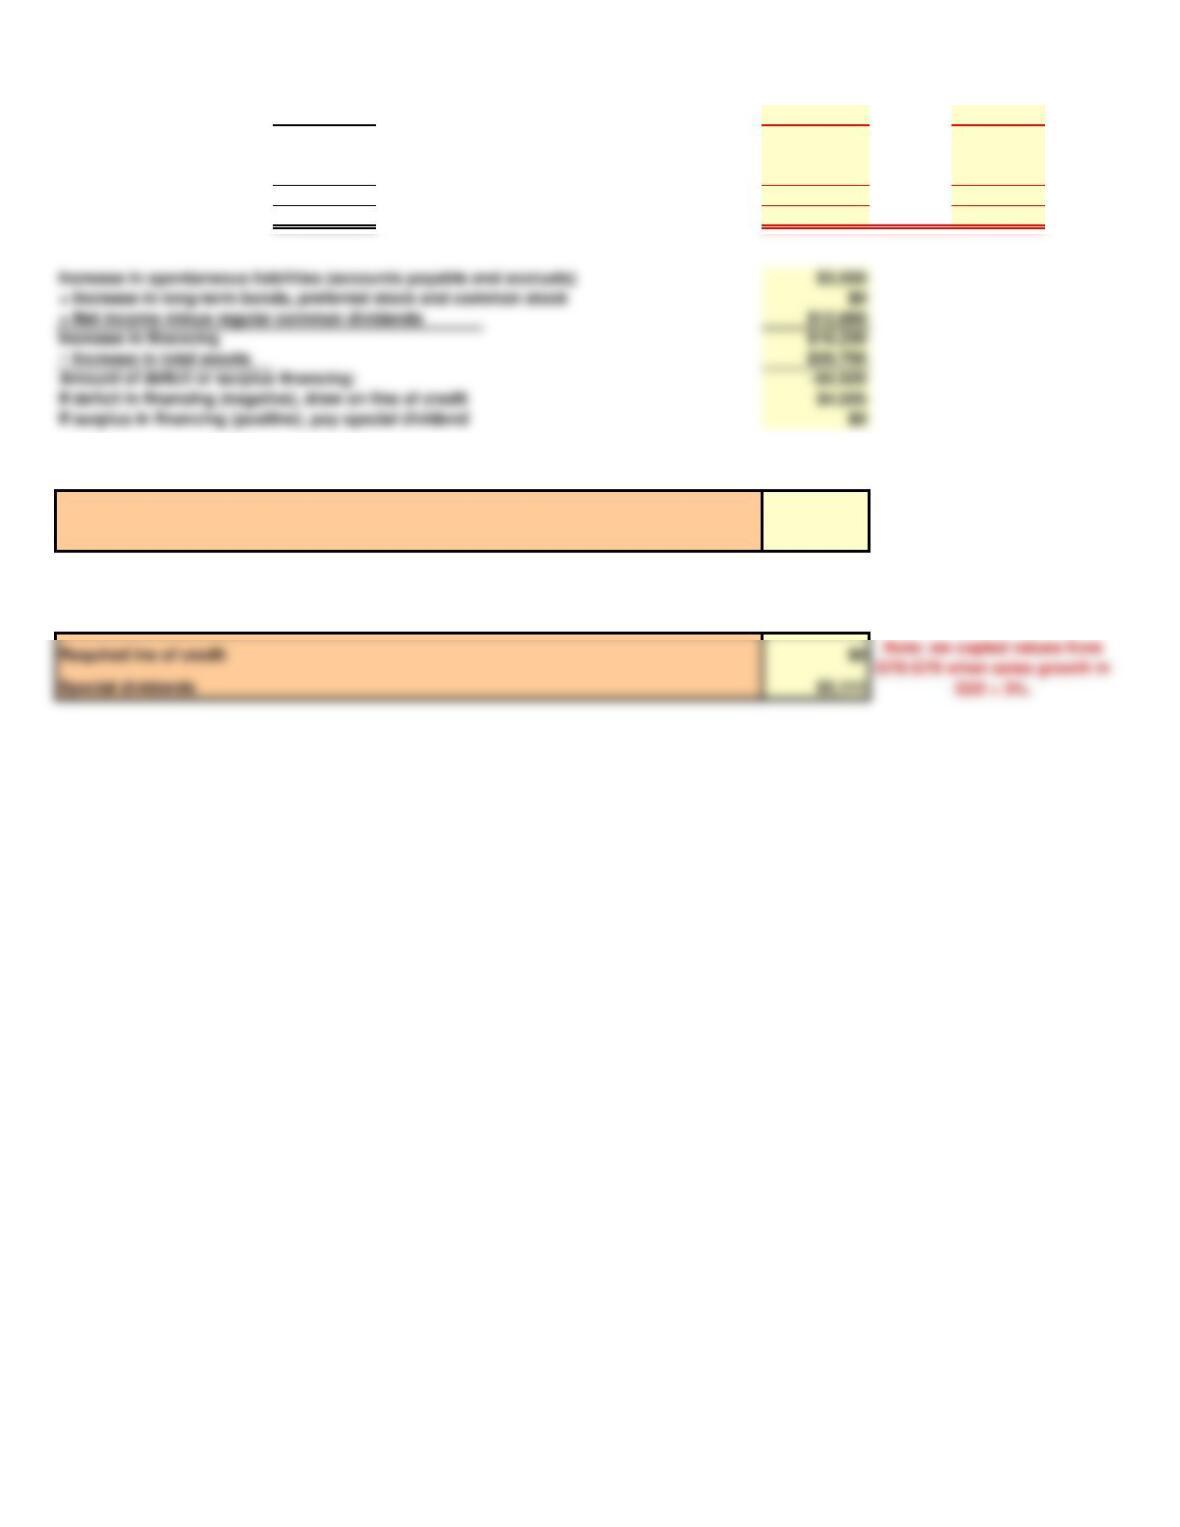
Long-term debt $120,000 Previous $120,000 $120,000
Total liabilities $179,170 $182,720 $187,245
Common stock $60,000 Previous $60,000 $60,000
Retained Earnings $106,745 Previous + DRE $119,424 $119,424
Total common equity $166,745 $179,424 $179,424
Total liabilities and equity $345,914 $362,144 $366,669
Note: we copied values from
G78:G79 when sales growth in
G32 = 3%.
Required ine of credit $4,525
Special dividends $0
a. What are the forecasted levels of the line of credit and special dividends?
b. Now assume that the growth in sales is only 3%. What are the forecasted levels of line of credit and special
dividends?
Note: we copied values from
G78:G79 when sales growth in
G32 = 6%.
Increase in spontaneous liabilities (accounts payable and accruals) $3,550
+ Increase in long-term bonds, preferred stock and common stock $0
+ Net income minus regular common dividends $12,680
Increase in financing $16,230
Amount of deficit or surplus financing: -$4,525
If deficit in financing (negative), draw on line of credit $4,525
If surplus in financing (positive), pay special dividend $0