Chapter 12
The Foreign-Exchange Market
This chapter provides the fundamental details of the foreign exchange market. Spot and forward
transactions are covered along with the concepts of arbitrage, speculation, and central bank intervention.
The linkages between a country’s balance of payments, the foreign exchange market, and the country’s
exchange rate are discussed. The chapter also introduces the demand for and supply of foreign currency
under a flexible exchange rate system versus a fixed exchange rate system.
The text includes a table of foreign exchange spot and forward rate quotations from the Wall Street
Journal. We suggest that instructors bring current Wall Street Journal tables to class to increase the
currency of the lesson. The principles discussed in the text will apply equally well to current data, and the
students will perceive the class as more relevant than if the instructor relies solely on past data.
◼ Chapter Outline
Introduction
Spot Rates
Global Insights 12.1: Exchange Rate Indexes
Forward Rates
Arbitrage
Chapter 12 The Foreign-Exchange Market 55
◼ Suggested Answers for the End-of–Chapter Exercises
1. Suppose that one euro costs $0.80 on January 1. Suppose that on March 1, one euro costs $0.75. What
has happened to the value of the dollar (in terms of euros) over this period?
2. Using the information in Exercise 1, imagine that you are a purchasing agent for a domestic firm and
you are thinking about buying goods from a European firm. Suppose the total value of those goods is
500,000 euros. How much would you have spent if you’d purchased the goods in January? How
much if you’d waited until March? Suppose you knew in January that you wanted to buy the goods,
but that you wouldn’t actually make the expenditure until March. What action(s) could you take in
January?
There are several courses of action to consider:
a. You could rely on the spot market and buy the euros any time in the next 90 days.
b. You could buy the euros today in the forward market.
3. Using Table 12.1, calculate the price of one Australian dollar in terms of Japanese yen on Friday,
October 7, 2011.
4. According to Table 12.1, were one-month interest rates higher in the United States or in the U.K. on
Friday, October 7, 2011? How do you know?
5. Suppose that spot rate of a euro is $1.00, the one-year forward rate on euros is $1.05, and the interest
rate on one-year euro-area deposits is 10 percent. What would the interest rate have to be in the U.S.
to make you indifferent between putting your money there or here?
Using the covered interest parity condition:
6. Draw a figure such as Figure 12.1 to illustrate equilibrium for a particular currency in the foreign
exchange market. Now, show what would happen to the exchange rate (under flexible rates) and the
country’s official settlements balance if the demand for foreign currency were to fall. What type of
real world event could cause such a fall?
The U.S. demand and supply of the British pound (£) is shown below. The price of a pound is the
7. Repeat Exercise 6 under the assumption that instead of a fall in demand for foreign exchange, there is an
increase in supply. What could cause such an increase?
8. Consider the information presented here (all values are in US$):
Australia 0.50
a. Let E denote the spot exchange rate and F denote the one-month forward rate. Derive the formula that
shows how F is determined in the foreign exchange market and how its value is related to E. Under
what conditions in the real world is this formula most likely to hold true?
b. Based on the information provided earlier, where (among thr U.S., Australia, or Switzerland) are one-
month interest rates the highest? Where are they the lowest? How do you know?
Using the formula: F = E x (iUS – iforeign + 1) or F = E x (d + 1) where d = iUS – iforeign
c. Given the information, what is the Australian dollar price of one Swiss franc?
d. What is the Swiss franc price of one Australian dollar?
9. Suppose £1 = $2.4110 in New York, $1 = €1.050 in Paris, and £1 = €2.50 in London.
a. If you begin by holding £1, then how could you profit from these exchange rates?
b. Ignoring transaction costs, what is your arbitrage profit per pound initially traded?
58 Husted/Melvin • International Economics, Ninth Edition
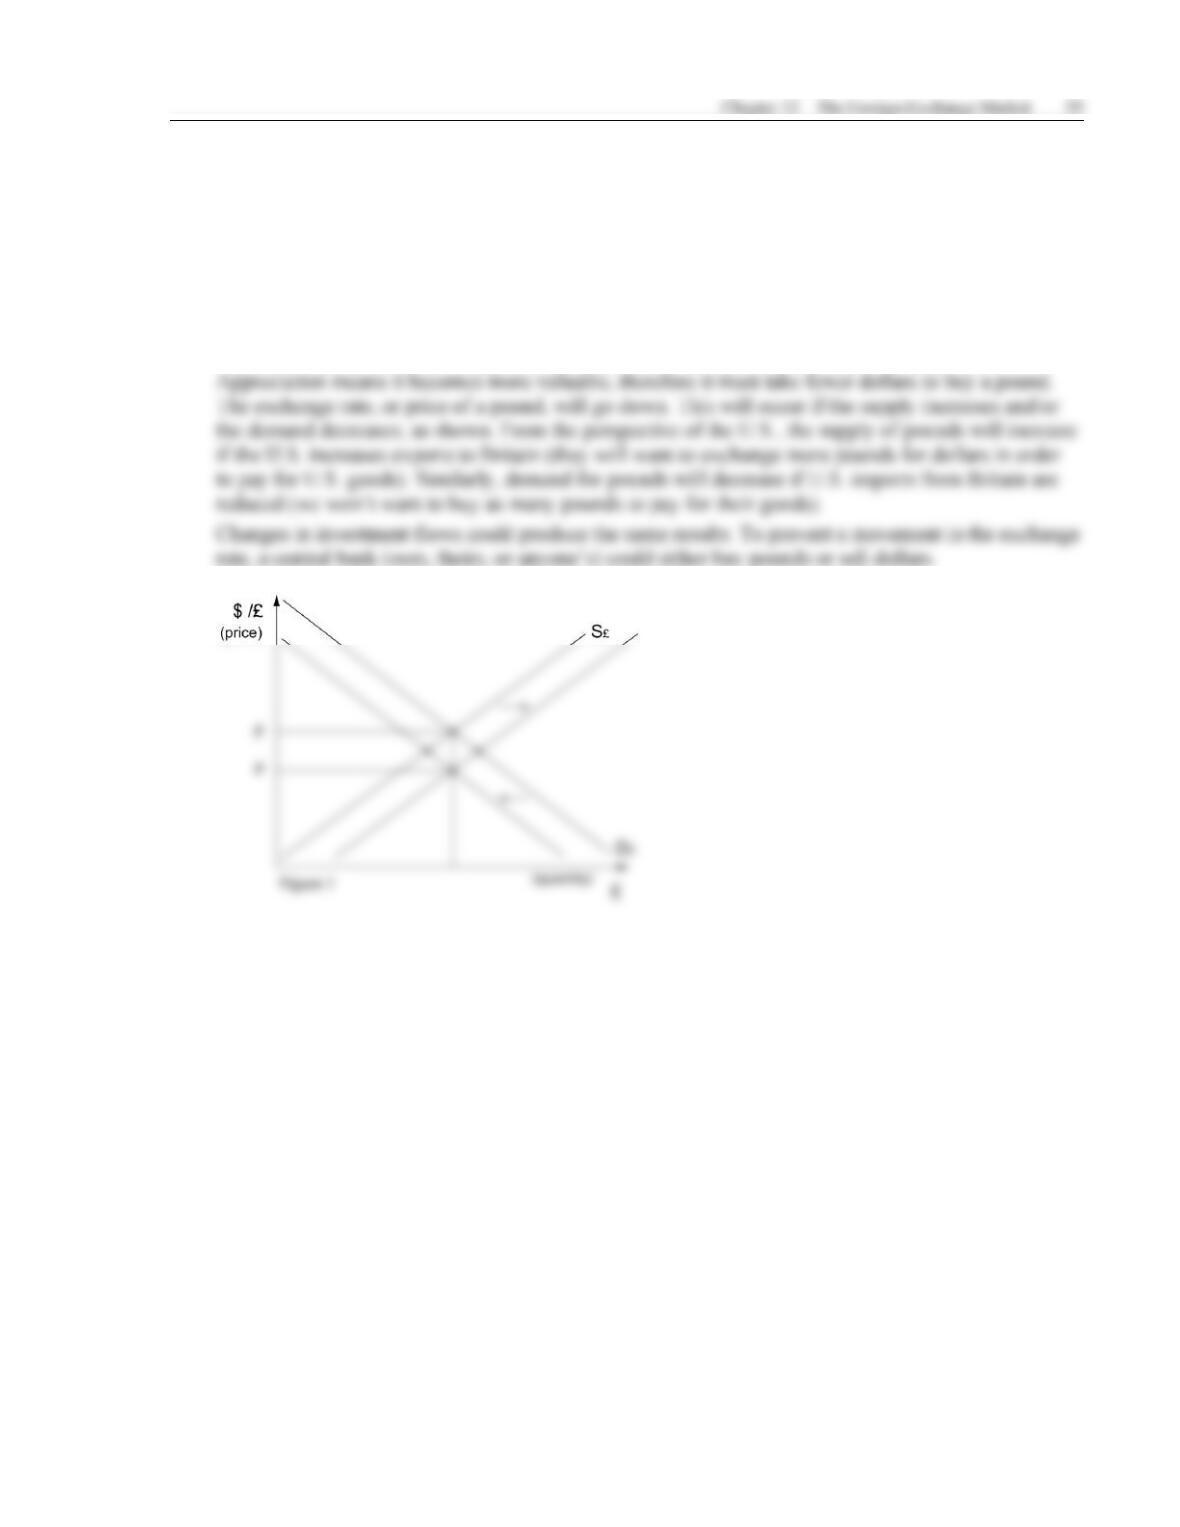
10. You can analyze changes in foreign exchange rates by using supply and demand diagrams. Construct
an example for the $/£ exchange rate where the dollar appreciates relative to the pound. Carefully
label your diagram and have the initial exchange rate equal to 1.60. What might cause the supply
and/or demand curve to move in the manner illustrated (what are the underlying reasons for exchange
rate movements)? Then, indicate what sort of central bank intervention would be necessary to prevent
the exchange rate from moving away from the initial equilibrium.
The demand and supply of £s is shown in Figure 1 below. Note the price of a pound is the exchange
rate, $/£. What does the exchange rate do when the dollar appreciates relative to the pound?
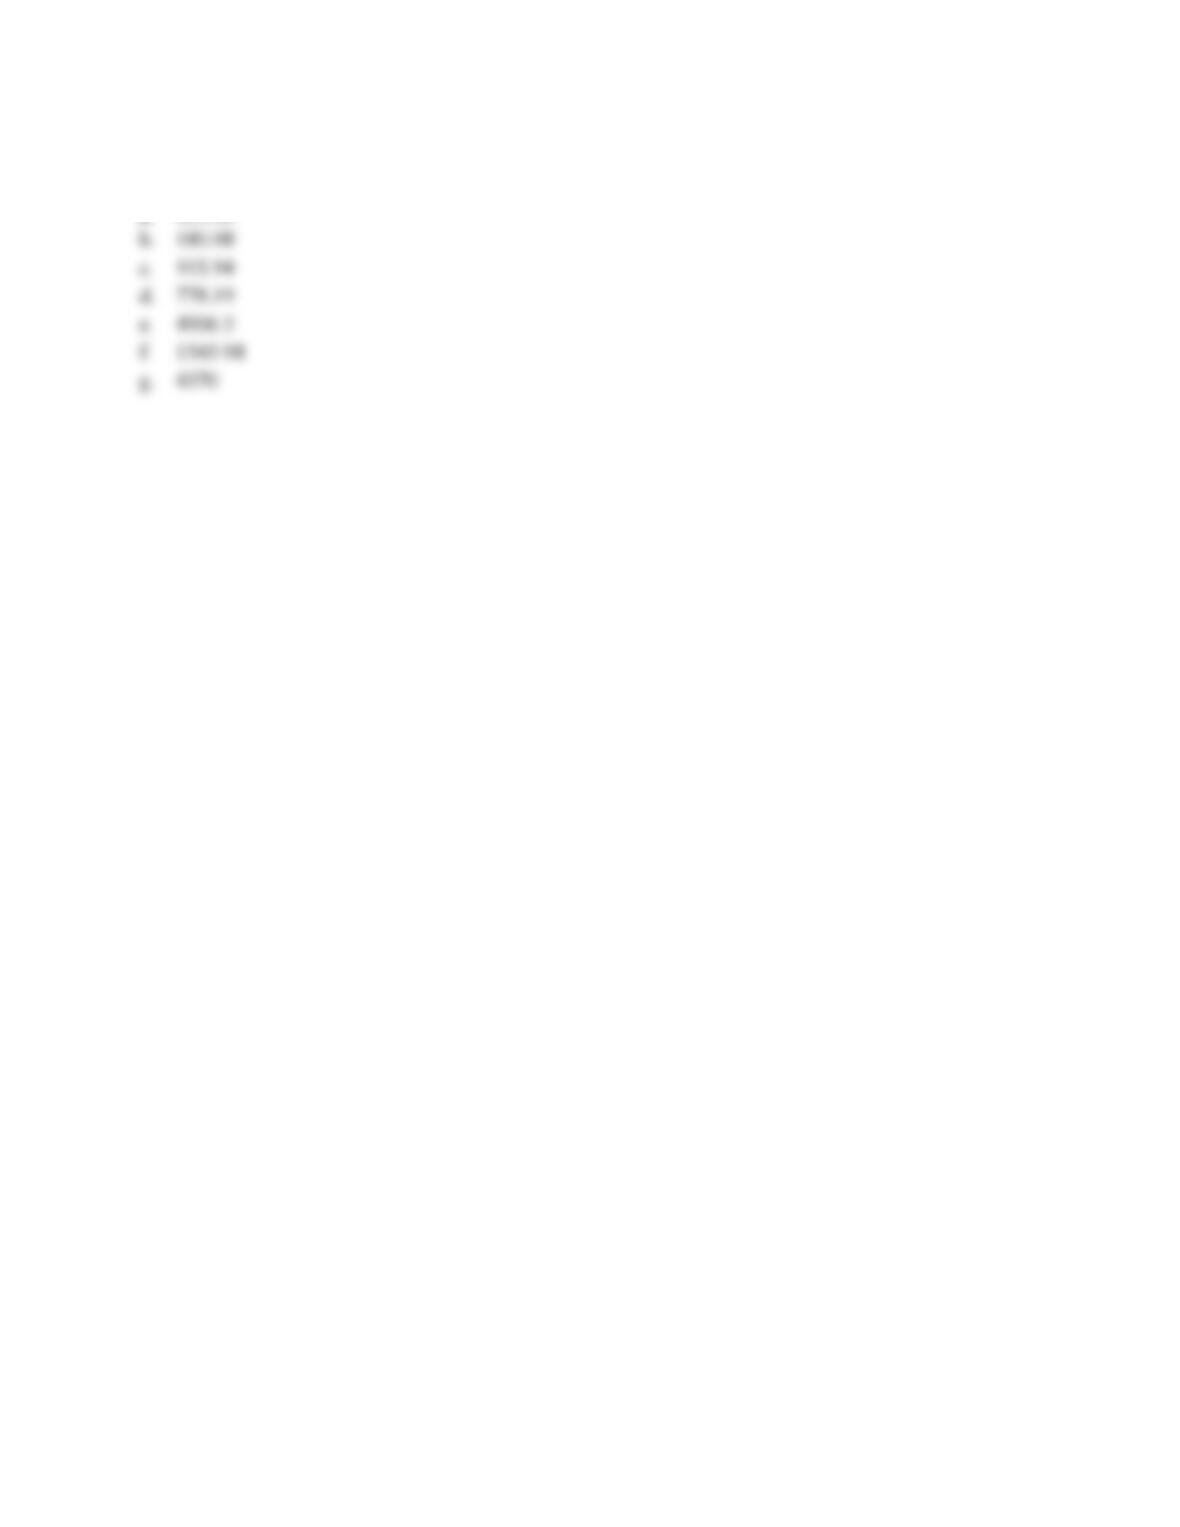
11. A bicycle manufactured in the United States costs $100. Using the exchange rates listed in
Table 12.1, what would the bicycle cost in each of the following countries?
a. Argentina
b. Brazil
c. Canada
d. Hong Kong
e. India
f. Mexico
60 Husted/Melvin • International Economics, Ninth Edition
g. Philippines