A n s w e r s t o t h e R e v i e w Q u i z z e s
Page 300 (page 708 in Economics)
1. Explain the mainstream theory of the business cycle.
Mainstream business cycle theory attributes business cycles to fluctuations in aggregate demand growth.
According to the mainstream view, potential GDP grows steadily and aggregate demand, while generally
2. What are the four special forms of the mainstream theory of the business cycle and how do they
differ?
The four special forms of the mainstream theory are the Keynesian cycle theory, the monetarist cycle
theory, the new classical cycle theory, and the new Keynesian cycle theory. These theories differ
according to the factors they believe are the most responsible for causing fluctuations in the growth of
3. According to RBC theory, what is the source of the business cycle? What is the role of
fluctuations in the rate of technological change?
4. According to RBC theory, how does a fall in productivity growth influence investment demand,
the market for loanable funds, the real interest rate, the demand for labor, the supply of labor,
employment, and the real wage rate?
12
THE BUSINESS
CYCLE, INFLATION,
AND DEFLATION**
C h a p t e r
1 5 6 C H A P T E R 1 2
According to real business cycle theory, a fall in productivity growth decreases investment demand and
5. What are the main criticisms of RBC theory and how do its supporters defend it?
Critics of the real business cycle theory level three criticisms at it: 1) the money wage rate is sticky; 2)
Page 306 (page 714 in Economics)
1. How does demand-pull inflation begin?
2. What must happen to create a demand-pull inflation spiral?
When the economy is at an above full-employment equilibrium, the money wage rate rises which
3. How does cost-push inflation begin?
4. What must happen to create a cost-push inflation spiral?
5. What is stagflation and why does cost-push inflation cause stagflation?
6. How does expected inflation occur?
7. How do real GDP and the price level change if the forecast of inflation is incorrect?
T H E B U S I N E S S C Y C L E , I N F L A T I O N , A N D D E F L A T I O N 1 5 7
Page 309 (page 717 in Economics)
1. What is deflation?
2. What is the distinction between deflation and a one-time fall in the price level?
3. What causes deflation?
4. How does the quantity theory of money help us to understand the process of deflation?
The equation of exchange shows that the growth rate of the price level equals the money growth rate
5. What are the consequences of deflation?
6. How can deflation be ended?
Page 311 (page 719 in Economics)
1. How would you use the Phillips curve to illustrate an unexpected change in inflation?
2. If the expected inflation rate increases by 10 percentage points, how do the short-run Phillips
curve and the long-run Phillips curve change?
3. If the natural unemployment rate increases, what happens to the short-run Phillips curve and the
long-run Phillips curve?
4. Does the United States have a stable short-run Phillips curve? Explain why or why not.
1 5 8 C H A P T E R 1 2
A n s w e r s t o t h e S t u dy P l a n Pr o b l em s a n d Ap p l i c a t io n s
1. Debate on Causes of Joblessness Grows
What is the cause of the high unemployment rate? One side says there is not enough government
spending. The other says it’s a structural problem—people who can’t move to take new jobs
because they are tied down to burdensome mortgages or firms that can’t find workers with the
requisite skills to fill job openings.
Source: The Wall Street Journal, September 4, 2010
Which business cycle theory would say that the rise in unemployment is cyclical? Which would
say it is an increase in the natural rate? Why?
2. High Food and Energy Prices Here to Stay
On top of rising energy prices, a severe drought, bad harvests, and a poor monsoon season in
Asia have sent grain prices soaring. Globally, this is the third major food price shock in five years.
Source: The Telegraph, August 29, 2012
Explain what type of inflation the news clip is
describing and provide a graphical analysis of it.
T H E B U S I N E S S C Y C L E , I N F L A T I O N , A N D D E F L A T I O N 1 5 9
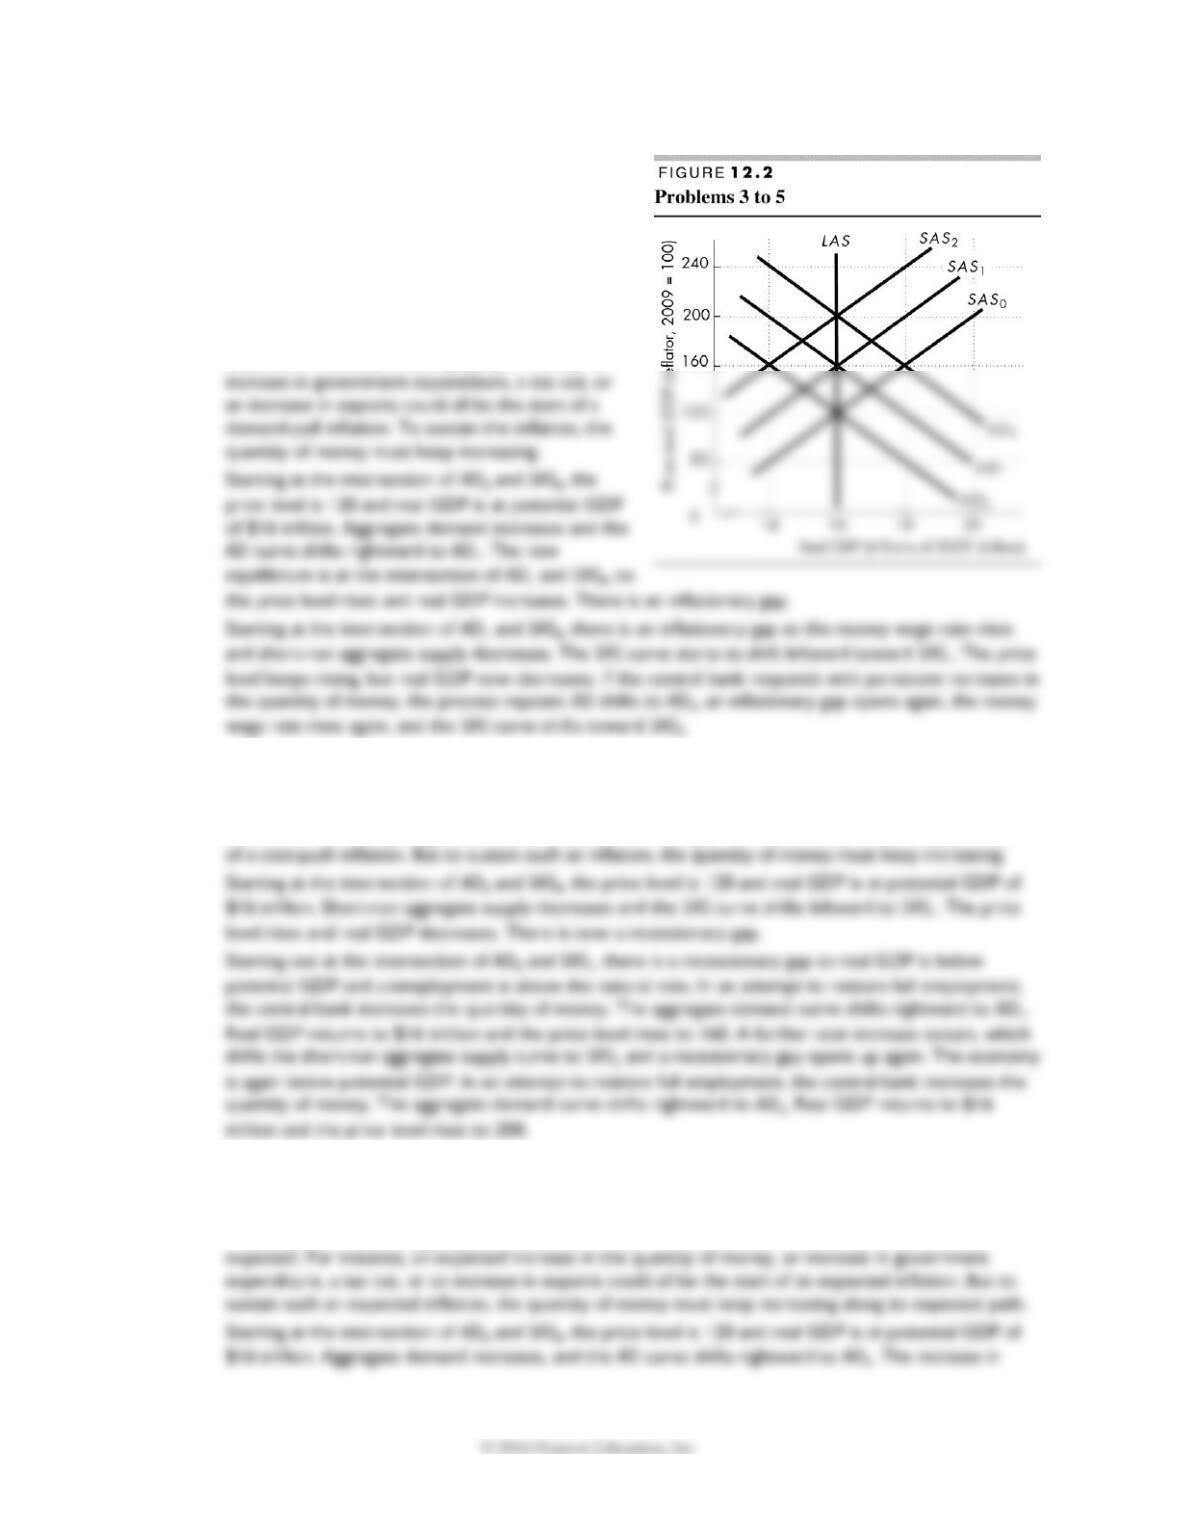
Use Figure 12.2 to answer Problems 3 to 5. The
economy starts out on the curves labeled AD0 and SAS0.
3. Some events occur and the economy experiences
a demand-pull inflation. What might those events
have been? Describe their initial effects and explain
how a demand-pull inflation spiral results.
Anything that increases aggregate demand can be
the factor that starts a demand-pull inflation. For
instance, an increase in the quantity of money, an
4. Some events occur and the economy experiences a cost-push inflation. What might those events
have been? Describe their initial effects and explain how a cost-push inflation spiral results.
Anything that decreases short-run aggregate supply can set off a cost-push inflation. For instance, an
increase in the money wage rate or an increase in the money price of raw materials could be the start
5. Some events occur and the economy is expected to experience inflation. What might those
events have been? Describe their initial effects and what happens as an expected inflation
proceeds.
Anything that increases aggregate demand can set off an expected inflation as long as the event is
1 6 0 C H A P T E R 1 2
6. Suppose that the velocity of circulation of money is constant and real GDP is growing at 3
percent a year.
a. To achieve an inflation target of 2 percent a year, at what rate would the central bank grow the
quantity of money?
To achieve a target inflation rate, the growth rate of the quantity of money must equal the inflation
b. At what growth rate of the quantity of money would deflation be created?
Deflation occurs if the inflation rate is less than zero. Inflation rate = Money growth rate + Rate of
7. Eurozone Unemployment Hits Record High As Inflation Rises Unexpectedly
Eurozone unemployment rose to 10.7 percent. At the same time, eurozone inflation unexpectedly
rose to 2.7 percent a year, up from the previous month’s 2.6 percent a year.
Source: Huffington Post, March 1, 2012
a. How does the Phillips curve model account for a very high unemployment rate?
b. Explain the change in unemployment and inflation in the eurozone in terms of what is happening
to the short-run and long-run Phillips curves.
8. From the Fed’s Minutes
Members expected real GDP growth to be moderate over coming quarters and then to pick up
very gradually, with the unemployment rate declining only slowly. With longer-term inflation
expectations stable, members anticipated that inflation over the medium run would be at or
below 2 percent a year.
Source: FOMC Minutes, June 2012
Are FOMC members predicting that the U.S. economy will move along a short-run Phillips curve
or that the short-run Phillips curve will shift through 2012 and 2013? Explain.
T H E B U S I N E S S C Y C L E , I N F L A T I O N , A N D D E F L A T I O N 1 6 1
Answers to Additional Problems and Applications
Use the following information to work Problems 9 to 11.
Suppose that the business cycle in the United States is
best described by RBC theory and that a new technology
increases productivity.
9. Draw a graph to show the effect of the new
technology in the market for loanable funds.
The advance in technology makes investment in
10. Draw a graph to show the effect of the new
technology in the labor market.
The advance in technology directly increases the
demand for labor as firms look to hire more
workers to exploit the technology. In addition, the
Figure 12.4 the real wage rate rises from $20 per hour to $30 per hour.
11. Explain the when-to-work decision when technology advances.
The when–to-work decision is an important part of the real business cycle theory. The increase in
technology raises the real interest rate. Changes in the real interest rate create an “intertemporal
12. Real Wages Fail to Match a Rise in Productivity
For most of the last century, wages and productivity—the key measure of the economy’s
efficiency—have risen together, increasing rapidly through the 1950s and ’60s and far more slowly
in the 1970s and ’80s. But in recent years, the productivity gains have continued while the pay
increases have not kept up.
Source: The New York Times, August 28, 2006
Explain the relationship between wages and productivity in this news clip in terms of real business
cycle theory.
Increases in productivity increase the demand for labor. By itself, this effect raises the real wage rate.
Use the following news clip to work Problems 13 and 14.
Inflation Should Be Feared
The Fed is trying as hard as it can to spur growth, and to create some inflation. But the Fed must be
careful. Inflation remains a danger because U.S. debt is skyrocketing, with no visible plan to pay it back.
For the moment, foreigners are buying that debt. But they are buying out of fear that their governments
are worse. They are short-term investors, waiting out the storm, not long-term investors confident that
the United States will pay back its debts. If their fear passes, or they decide some other haven is safer,
watch out. Inflation will come with a vengeance. It’s not happening yet: Interest rates are low now. But if
inflation takes off, it will happen with little warning, the Fed will be powerless to stop it, and it will bring
stagnation rather than prosperity.
Source: John H. Cochrane, The New York Times, August 22, 2012
13. What type of inflation process does John Cochrane warn could happen? Explain the role that
inflation expectations would play if the outbreak of inflation were to “happen with little warning.”
Mr. Cochrane is concerned that a cost-push inflation could occur. Mr. Cochrane worries that if
14. Explain why the inflation that John Cochrane fears would “bring stagnation rather than
prosperity.”
15. Europe’s Deflation Risk
The United States is planning to push Europe toward new and more aggressive efforts to boost
aggregate demand given a renewed risk of deflation in the euro zone.
Source: Reuters, September 12, 2014
a. Explain the process by which deflation occurs.
b. How might Europe boost its aggregate demand? Might the boost to aggregate demand create
demand-pull inflation?
Use the following data to work Problems 16 and 17.
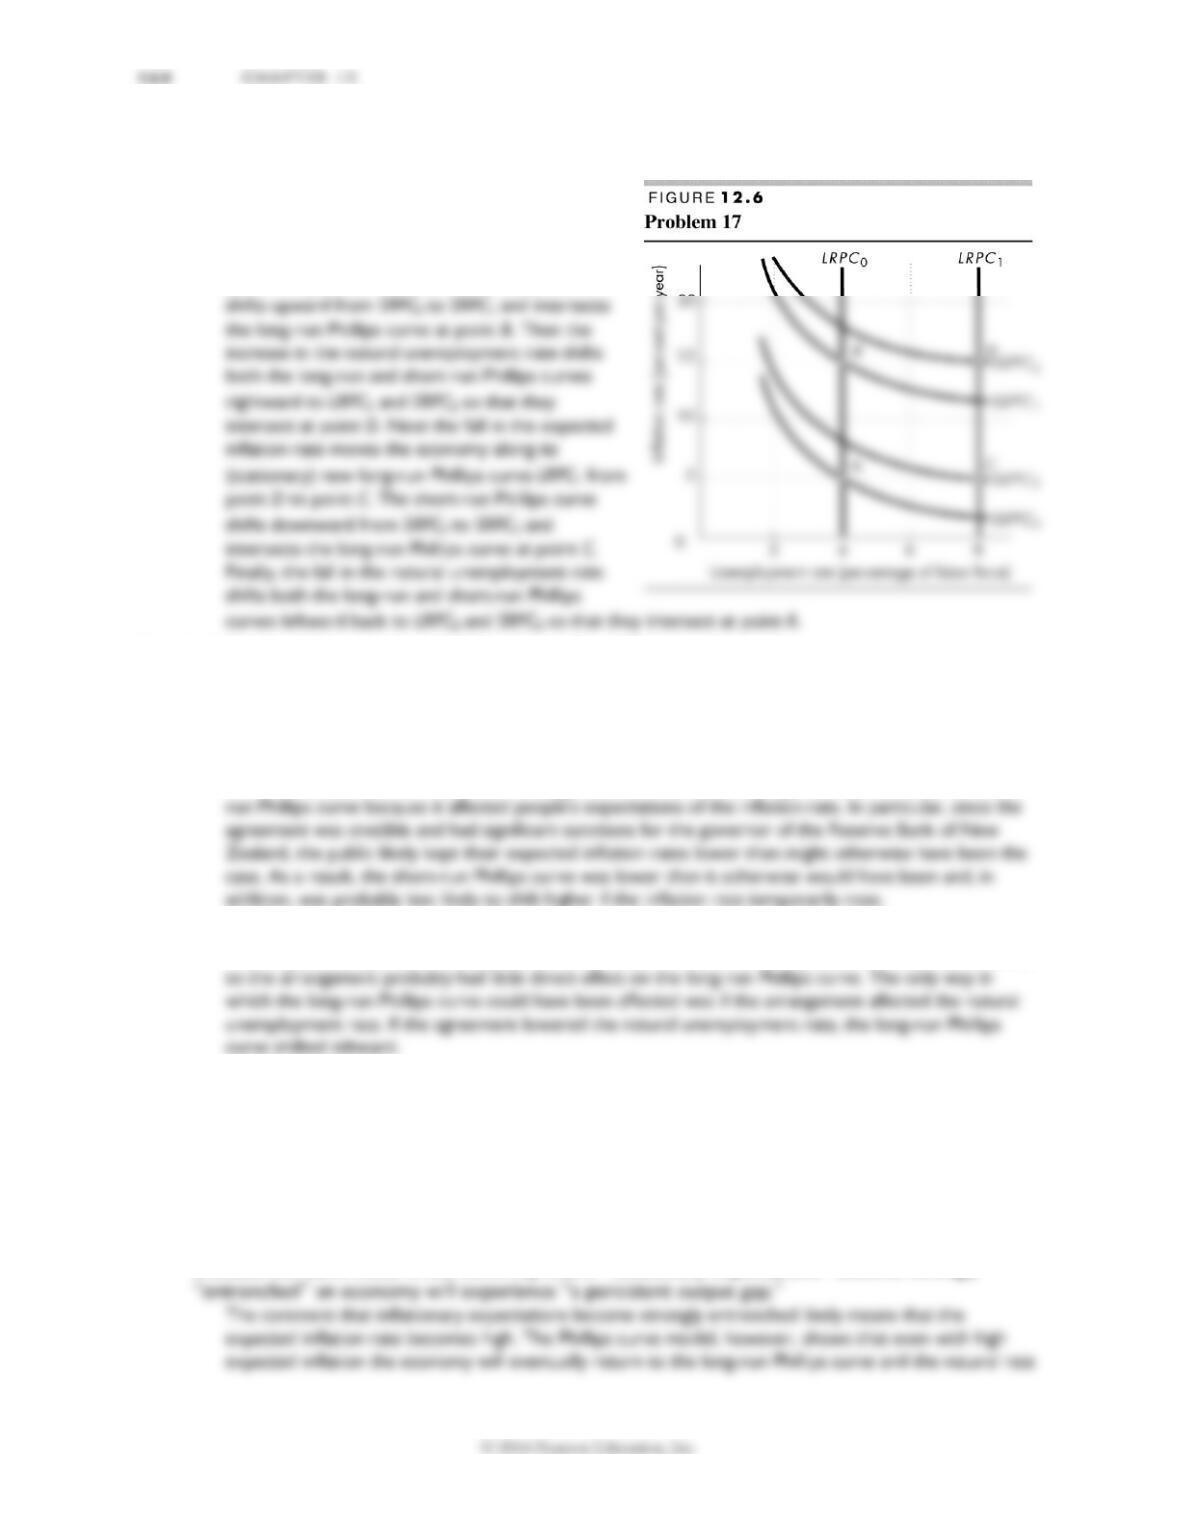
An economy has an unemployment rate of 4 percent and
an inflation rate of 5 percent a year at point A in Figure
12.5. Then some events occur that move the economy
from A to B to D to C and back to A.
16. Describe the events that could create this
sequence. Has the economy experienced demand-
pull inflation, cost-push inflation, expected inflation,
or none of these?
First the inflation rate increases from 5 percent a
year to 15 percent a year and the unemployment
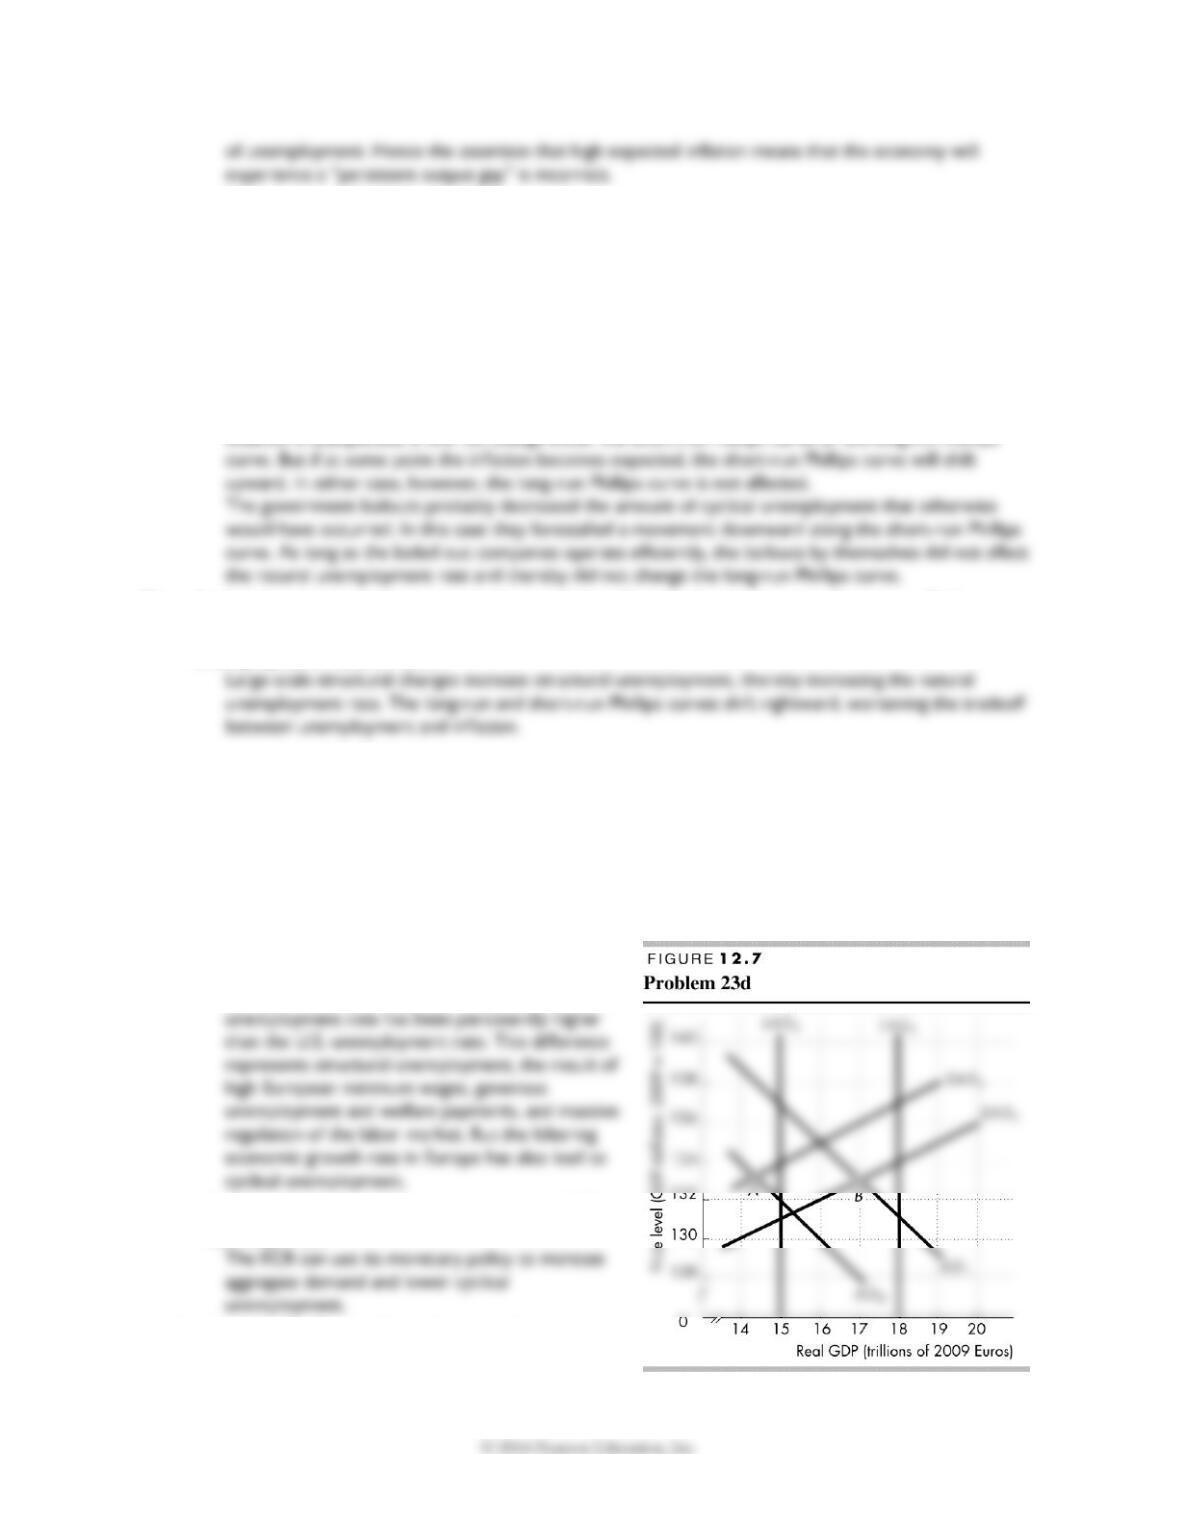
17. Draw in the figure the sequence of the economy’s short-run and long-run Phillips curves.
Figure 12.6 shows these short-run and long-run
Phillips curves. The initial increase in the expected
inflation rate moves the economy up its
(stationary) long-run Phillips curve LRPC0 from
point A to point B. The short-run Phillips curve
Use the following information to work Problems 18 and 19.
The Reserve Bank of New Zealand signed an agreement with the New Zealand government in which the
Bank agreed to maintain inflation inside a low target range. Failure to achieve the target would result in
the governor of the Bank (the equivalent of the chairman of the Fed) losing his job.
18. Explain how this arrangement might have influenced New Zealand’s short-run Phillips curve.
The Reserve Bank of New Zealand’s arrangement with New Zealand’s government affected the short–
19. Explain how this arrangement might have influenced New Zealand’s long-run Phillips curve.
The long-run Phillips curve is independent of the inflation rate and of people’s inflationary expectations,
20. Fed Pause Promises Financial Disaster
The indication is that inflationary expectations have become entrenched and strongly rooted in
world markets. As a result, the risk of global stagflation has become significant. A drawn-out
inflationary process always precedes stagflation. Following the attritional effect of inflation, the
economy starts to grow below its potential. It experiences a persistent output gap, rising
unemployment, and increasingly entrenched inflationary expectations.
Source: Asia Times Online, May 20, 2008
Evaluate the claim made in the news clip that if “inflationary expectations” become strongly
T H E B U S I N E S S C Y C L E , I N F L A T I O N , A N D D E F L A T I O N 1 6 5
Use the following information to work Problems 21 and 22.
Because the Fed doubled the monetary base in 2008 and the government spent billions of dollars bailing
out troubled banks, insurance companies, and auto producers, some people are concerned that a
serious upturn in the inflation rate will occur, not immediately but in a few years time. At the same time,
massive changes in the global economy might bring the need for structural change in the United States.
21. Explain how the Fed’s doubling of the monetary base and government bailouts might influence the
short-run and long-run Phillips curves. Will the influence come from changes in the expected
inflation rate, the natural unemployment rate, or both?
The doubling of the monetary base might lead to significant inflation at some point in the future. If the
inflation is unexpected, it will not change either the short-run Phillips curve or the long-run Phillips
22. Explain how large scale structural change might influence the short-run and long-run Phillips
curves. Will the influence come from changes in the expected inflation rate, the natural
unemployment rate, or both?
Economics in the News
23. After you have studied Economics in the news on pp. 312–313 (720–721 in Economics), answer the
following questions.
a. What are the macroeconomic problems in the Eurozone economy that the ECB is seeking to
address?
The Eurozone economy has slow growth a high unemployment rate. It also runs the risk of deflation.
b. Is the European unemployment problem structural, cyclical, or both and how can we determine
its type?
The European unemployment problem has both
structural and cyclical components. The Eurozone
c. Explain which type of unemployment the ECB
can help with.
d. Use the AS–AD model to show the changes in
aggregate demand and/or aggregate supply that
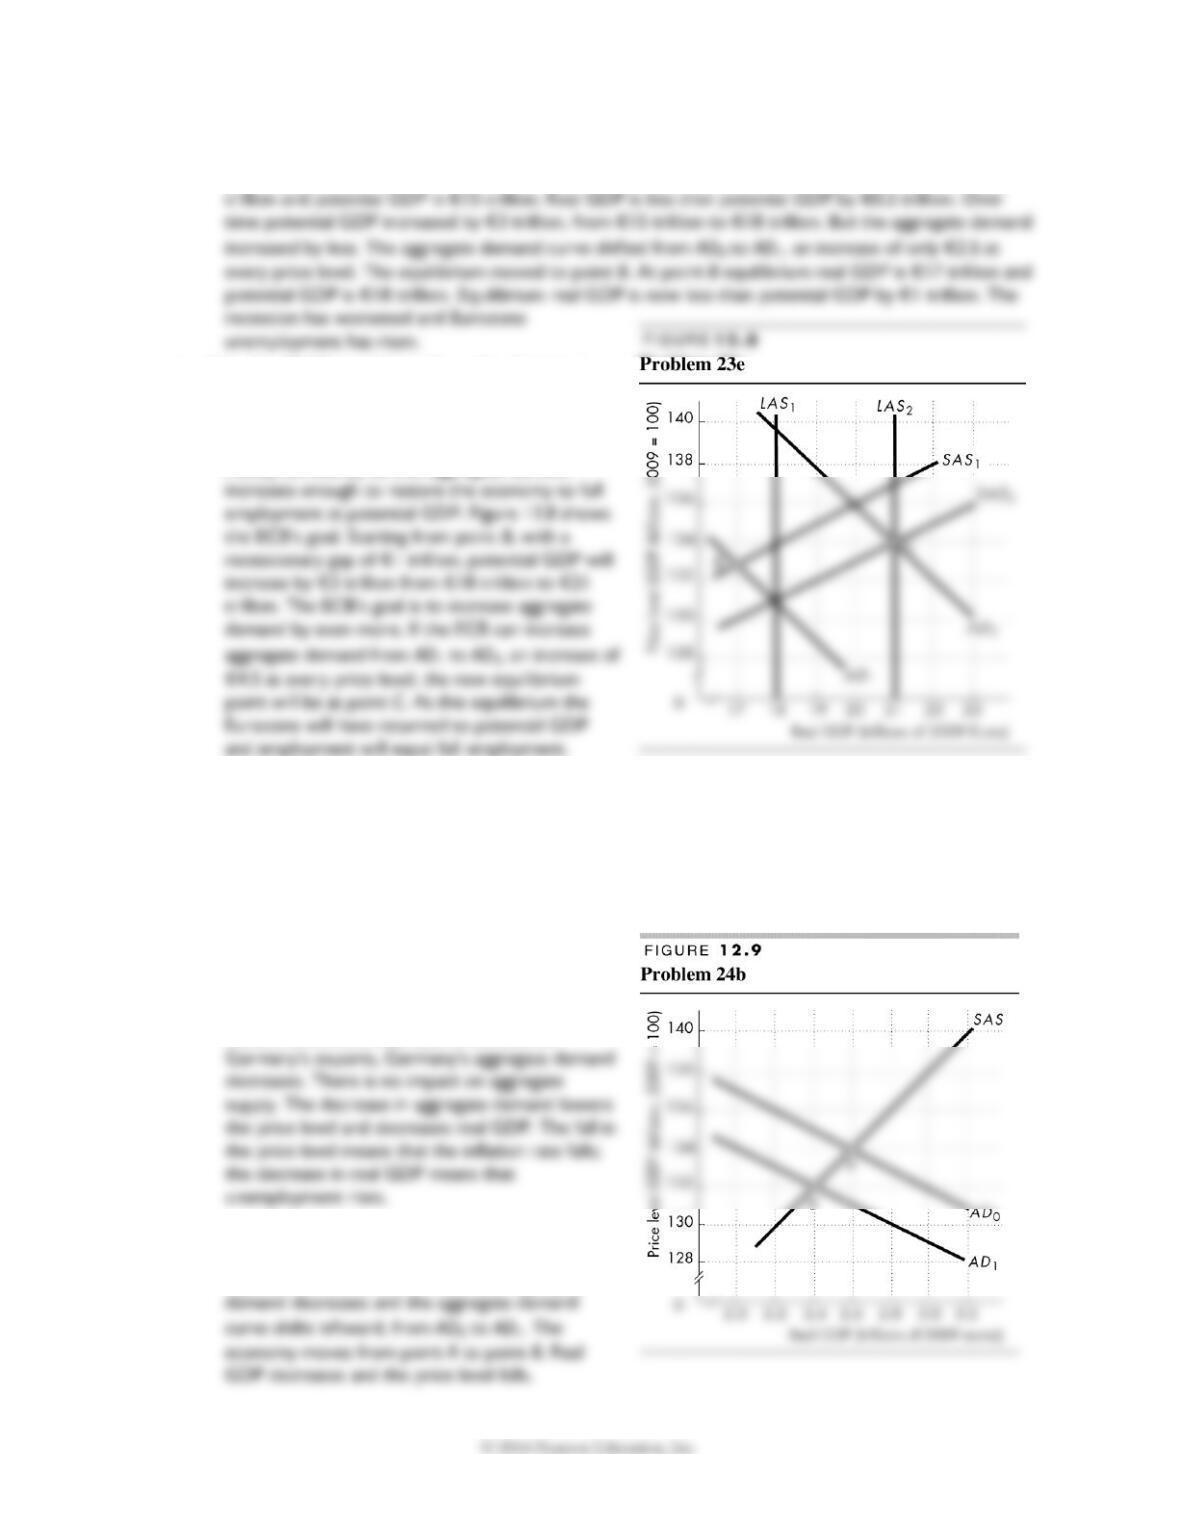
1 6 6 C H A P T E R 1 2
created the Eurozone’s macroeconomic problems.
Figure 12.7 shows the situation in the Eurozone. Starting at point A, equilibrium real GDP is €14.5
e. Use the AS–AD model to show the changes in
aggregate demand and/or aggregate supply that
the ECB must bring about to achieve its goal.
The ECB’s goal is to increase the quantity of
money sufficiently so that aggregate demand
24. Germany Leads Slowdown in Eurozone
The pace of German economic growth has weakened “markedly,” but the reason is the weaker
global prospects. Although German policymakers worry about the country’s exposure to a fall in
demand for its export goods, evidence is growing that the recovery is broadening with real wage
rates rising and unemployment falling, which will lead into stronger consumer spending.
Source: The Financial Times, September 23, 2010
a. How does “exposure to a fall in demand for its
export goods” influence Germany’s aggregate
demand, aggregate supply, unemployment and
inflation?
If there is a severe decrease in demand for
b. Use the AS–AD model to illustrate your answer
to part (a).
Figure 12.9 illustrates this situation. Aggregate
T H E B U S I N E S S C Y C L E , I N F L A T I O N , A N D D E F L A T I O N 1 6 7
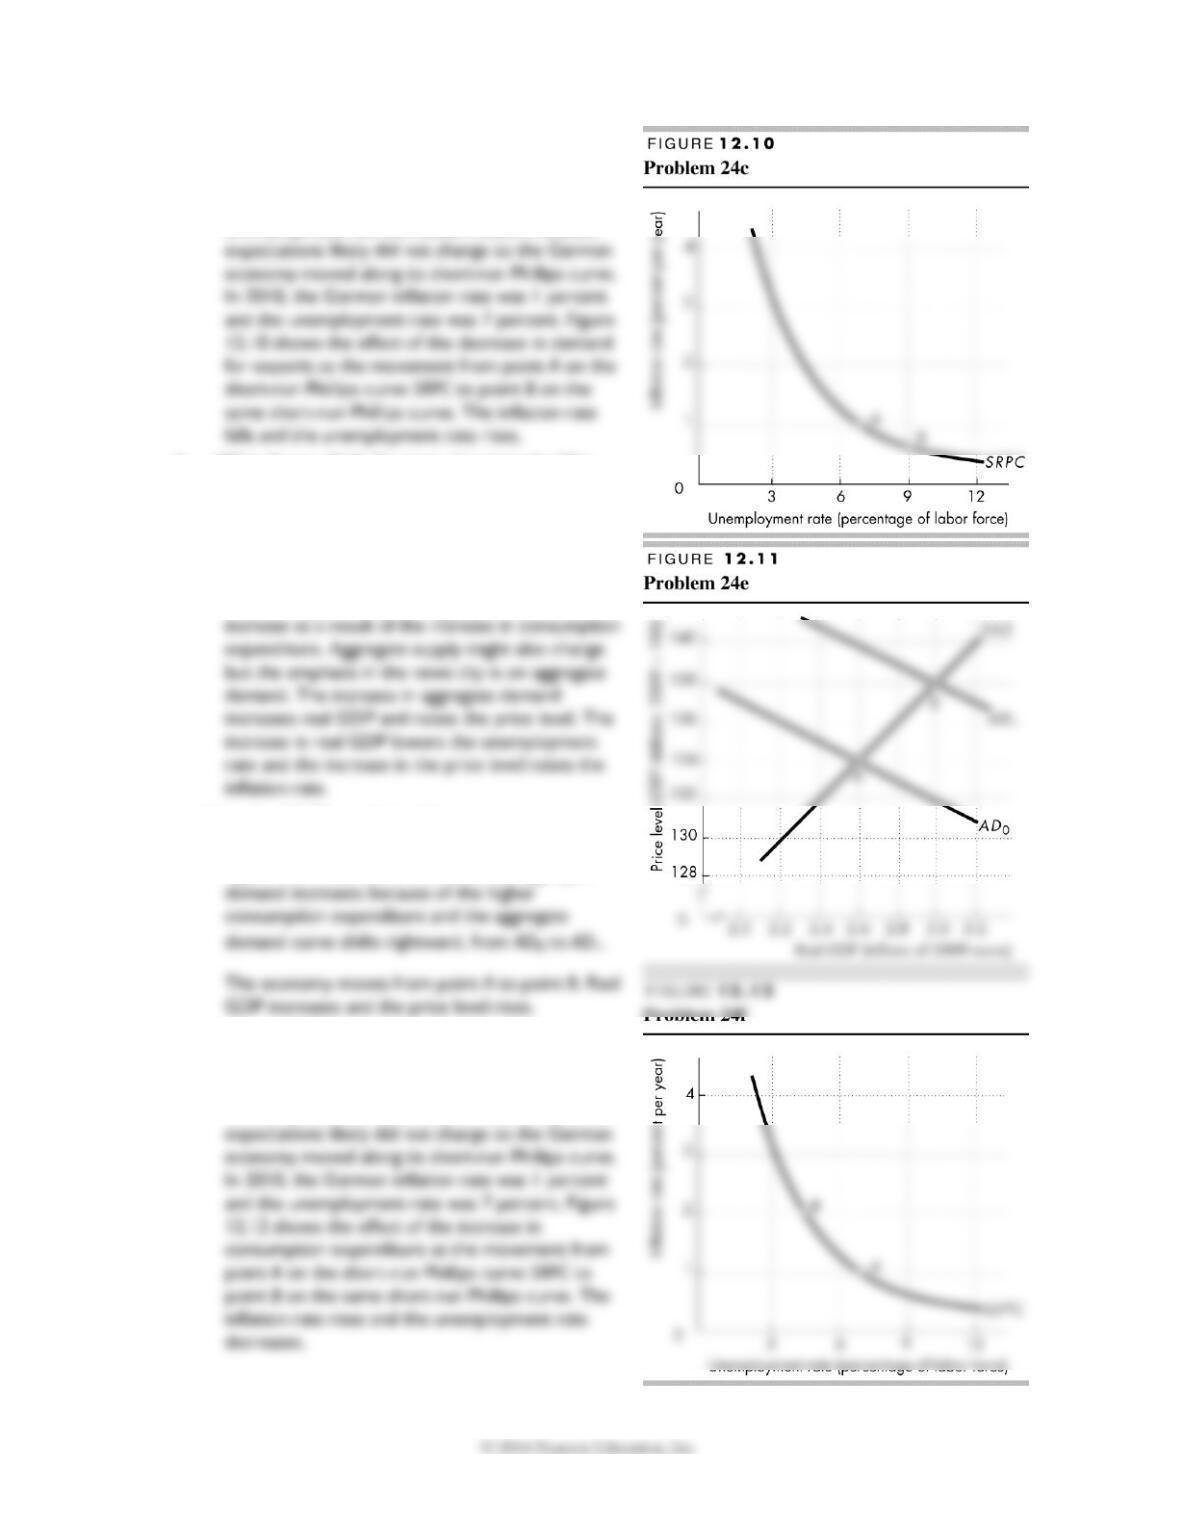
c. Use the Phillips curve model to illustrate your
answer to part (a).
In part (a) the inflation rate fell and the
unemployment rate increased. People’s inflation
d. What do you think the news clip means by “the
recovery is broadening with real wage rates rising
and unemployment falling, which will lead into
stronger consumer spending”?
The clip is implicitly talking about the multiplier
effect. It is predicting that aggregate demand will
e. Use the AS–AD model to illustrate your answer
to part (d).
Figure 12.11 illustrates this situation. Aggregate
f. Use the Phillips curve model to illustrate your
answer to part (d).
In part e the inflation rate rose and the
unemployment rate decreased. People’s inflation