Chapter 12: Cash Flow Estimation and Risk Analysis
Comprehensive/Spreadsheet Problem
341
Deviation
from Sales Variable Unit Fixed Equipment
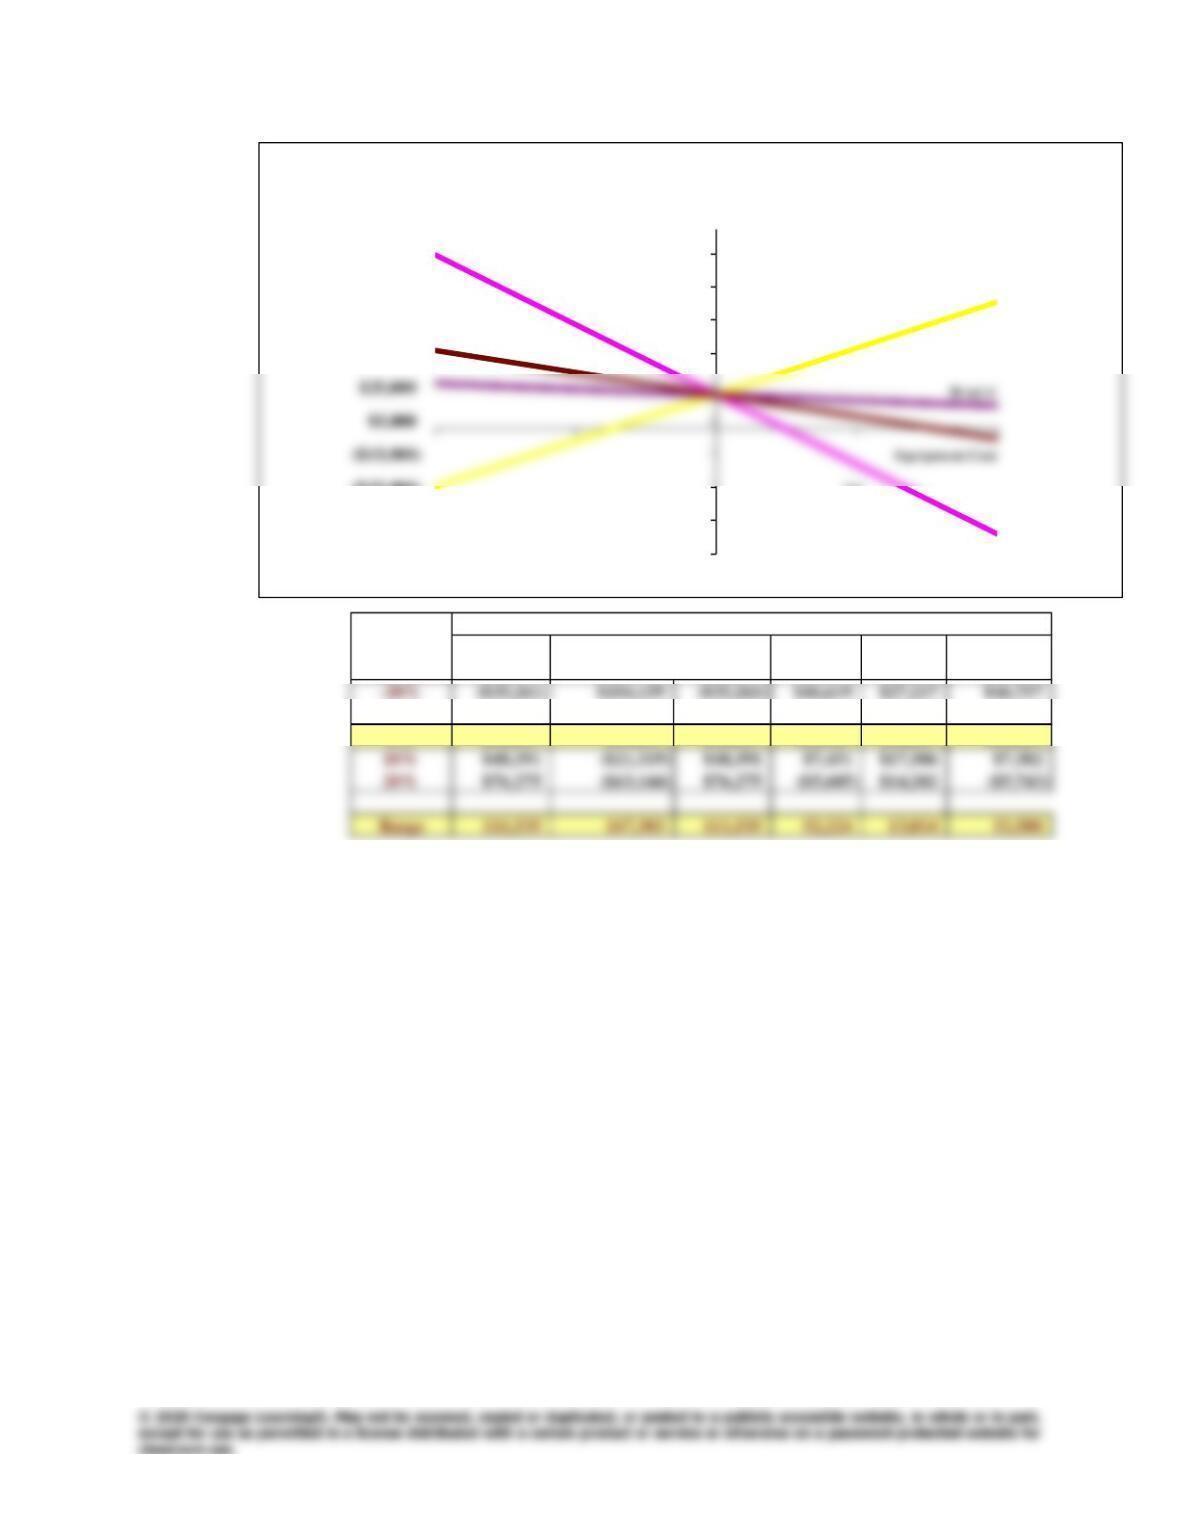
Base Case Price Costs Sales Costs WACC Cost
-10% ($7,377) $62,333 ($7,377) $33,563 $23,809 $33,632
0% $20,507 $20,507 $20,507 $20,507 $20,507 $20,507
NPV at Different Deviations from Base
($75,000)
($55,000)
($35,000)
$45,000
$65,000
$85,000
$105,000
-20% -10% 0% 10% 20%
NPV Sensitivity Analysis
VC
Sales Price
g. Note that “best-case” values for variable costs, fixed costs, WACC, and equipment cost are
20% less than base-case values, while the “worst-case” values for variable costs, fixed costs,
WACC, and equipment cost are 20% higher than base-case values.
Squared
Deviation
Sales Variable Unit Fixed Equipment Times
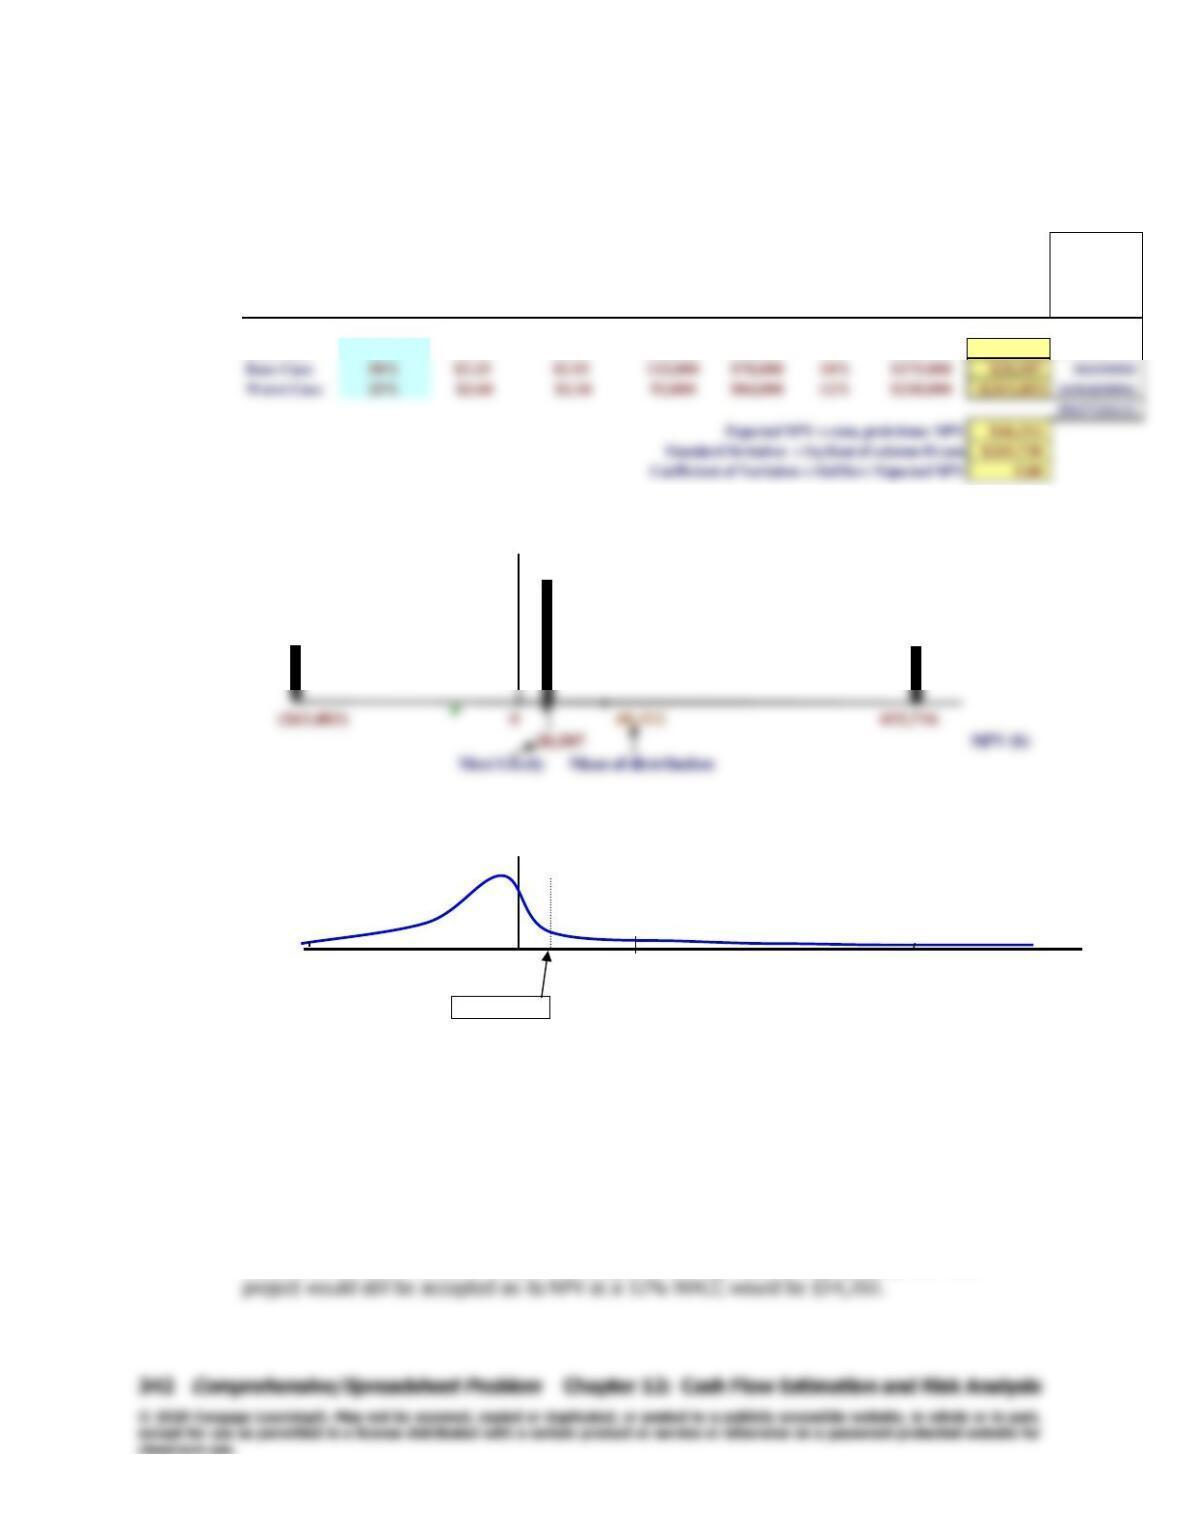
Scenario Probability Price Costs Sales Costs WACC Cost NPV Probability
Best Case 25% $3.90 $1.56 138,000 $56,000 8% $140,000 $415,716 33746517548
a. Probability Graph Probability
50%
25%
b. Continuous Approximation
Probability Density
(263,483) 0 48,312 415,716
NPV ($)
20,507
The scenario analysis suggests that the project could be highly profitable, but also that it is
quite risky. There is a 25% probability that the project would result in a loss of $263,483.
There is also a 25% probability that it could produce an NPV of $415,716. The standard
deviation is high, at $241,738, and the coefficient of variation is high, 5.00.
h. A risk-adjusted discount rate is the cost of capital appropriate for a given project, given the
riskiness of that project. The greater its risk, the higher the project’s cost of capital. If Cory
used a risk-adjusted discount rate, this project’s cost of capital would be increased above the
firm’s 10% WACC to reflect its greater risk as determined from the project’s CV of 5.00. If Cory
increased the WACC used to analyze this project’s NPV by 2 percentage points, then this
Chapter 12: Cash Flow Estimation and Risk Analysis
Integrated Case
343
Integrated Case
12–19
Allied Food Products
Capital Budgeting and Cash Flow Estimation
Allied Food Products is considering expanding into the fruit juice business with a
new fresh lemon juice product. Assume that you were recently hired as assistant
to the director of capital budgeting, and you must evaluate the new project.
The lemon juice would be produced in an unused building adjacent to
Allied’s Fort Myers plant; Allied owns the building, which is fully depreciated.
The project is expected to operate for 4 years, at which time it will be
terminated. The cash inflows are assumed to begin 1 year after the project is
(t = 4), the equipment is expected to have a salvage value of $25,000.
Unit sales are expected to total 100,000 units per year, and the expected
sales price is $2.00 per unit. Cash operating costs for the project are expected
344
Integrated Case
Chapter 12: Cash Flow Estimation and Risk Analysis
Table IC 12.1. Allied’s Lemon Juice Project (in Thousands)
End of Year: 0 1 2 3 4
I. Investment Outlays
CAPEX × (1 – T)
II. Project Operating Cash Flows
Unit sales (thousands) 100
Price/unit $ 2.00 $ 2.00
III. Project Termination Cash Flows
Salvage value (taxed as ord. income)
Tax on salvage value (25%)
IV. Results
NPV =
IRR =
MIRR =
Payback =
Chapter 12: Cash Flow Estimation and Risk Analysis
Integrated Case
345
A. Allied has a standard form that is used in the capital budgeting
process. (See Table IC 12.1.) Part of the table has been completed,
but you must replace the blanks with the missing numbers.
Complete the table using the following steps:
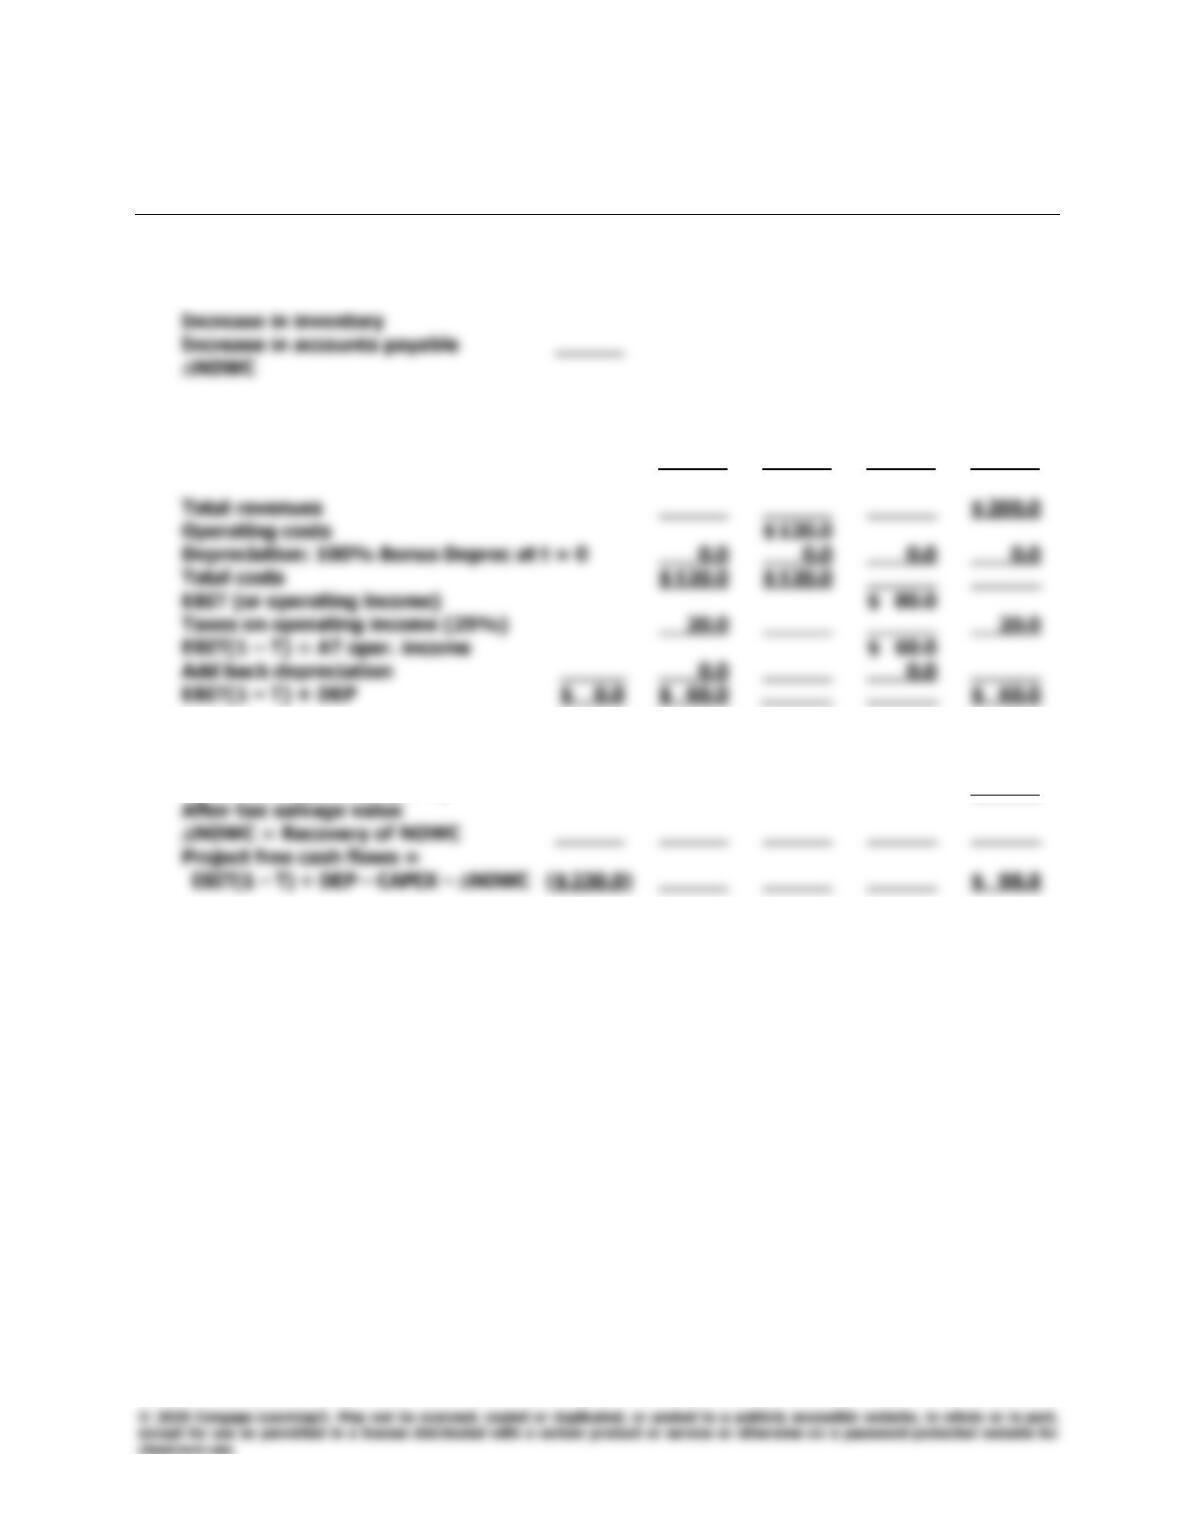
(1) Fill in the blanks under Year 0 for the initial investment outlays:
CAPEX × (1 – T) and NOWC.
Answer: [Show S12-1 through S12-6 here.] This answer is straightforward.
Note that accounts payable is an offset to the inventory buildup, so
A. (2) Complete the table for unit sales, sales price, total revenues, and
operating costs.
Answer: This answer requires no explanation. Students may note, though,
A. (3) Complete the table down to after-tax operating income and then
down to the project’s operating cash flows, EBIT(1 – T) + DEP.
Answer: [Show S12-7 here.] This is straightforward. Remember, that the
346
Integrated Case
Chapter 12: Cash Flow Estimation and Risk Analysis
A. (4) Fill in the blanks under Year 4 for the terminal cash flows and
complete the project free cash flow line. Discuss the recovery of net
operating working capital. What would have happened if the
machinery had been sold for less than its book value?
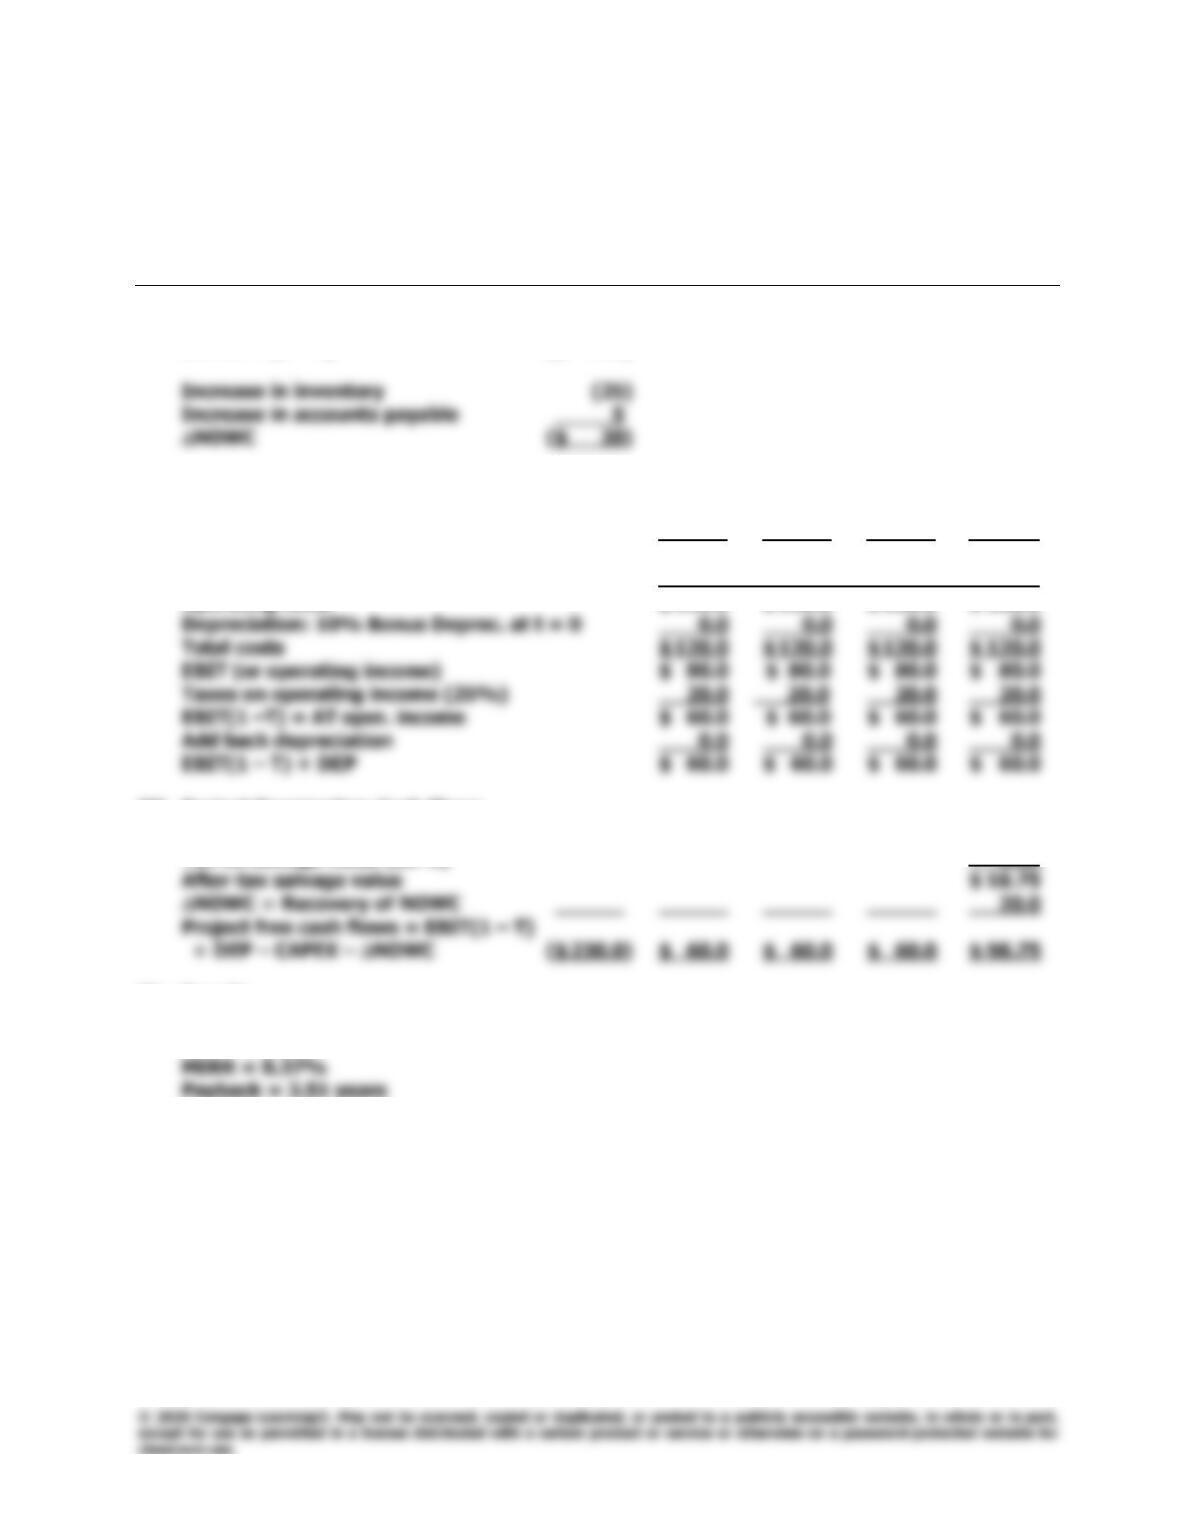
Answer: [Show S12-8 and S12-9 here.] These are all straightforward. Note
that the net operating working capital requirement is recovered at
Chapter 12: Cash Flow Estimation and Risk Analysis
Integrated Case
347
Table IC 12.1. Allied’s Lemon Juice Project (in Thousands)
Inputs: Price: $2.00 WACC: 10% Infl: 0.0%
VC rate: 60.0% T-rate: 25%
End of Year: 0 1 2 3 4
I. Investment Outlays
CAPEX × (1 – T) ($ 210)
II. Project Operating Cash Flows
Unit sales (thousands) 100 100 100 100
Price/unit $ 2.00 $ 2.00 $ 2.00 $ 2.00
Total revenues $ 200.0 $ 200.0 $ 200.0 $ 200.0
Operating costs $ 120.0 $ 120.0 $ 120.0 $ 120.0
III. Project Termination Cash Flows
Salvage value (taxed as ord. income) 25.0
Tax on salvage value (25%) 6.25
IV. Results
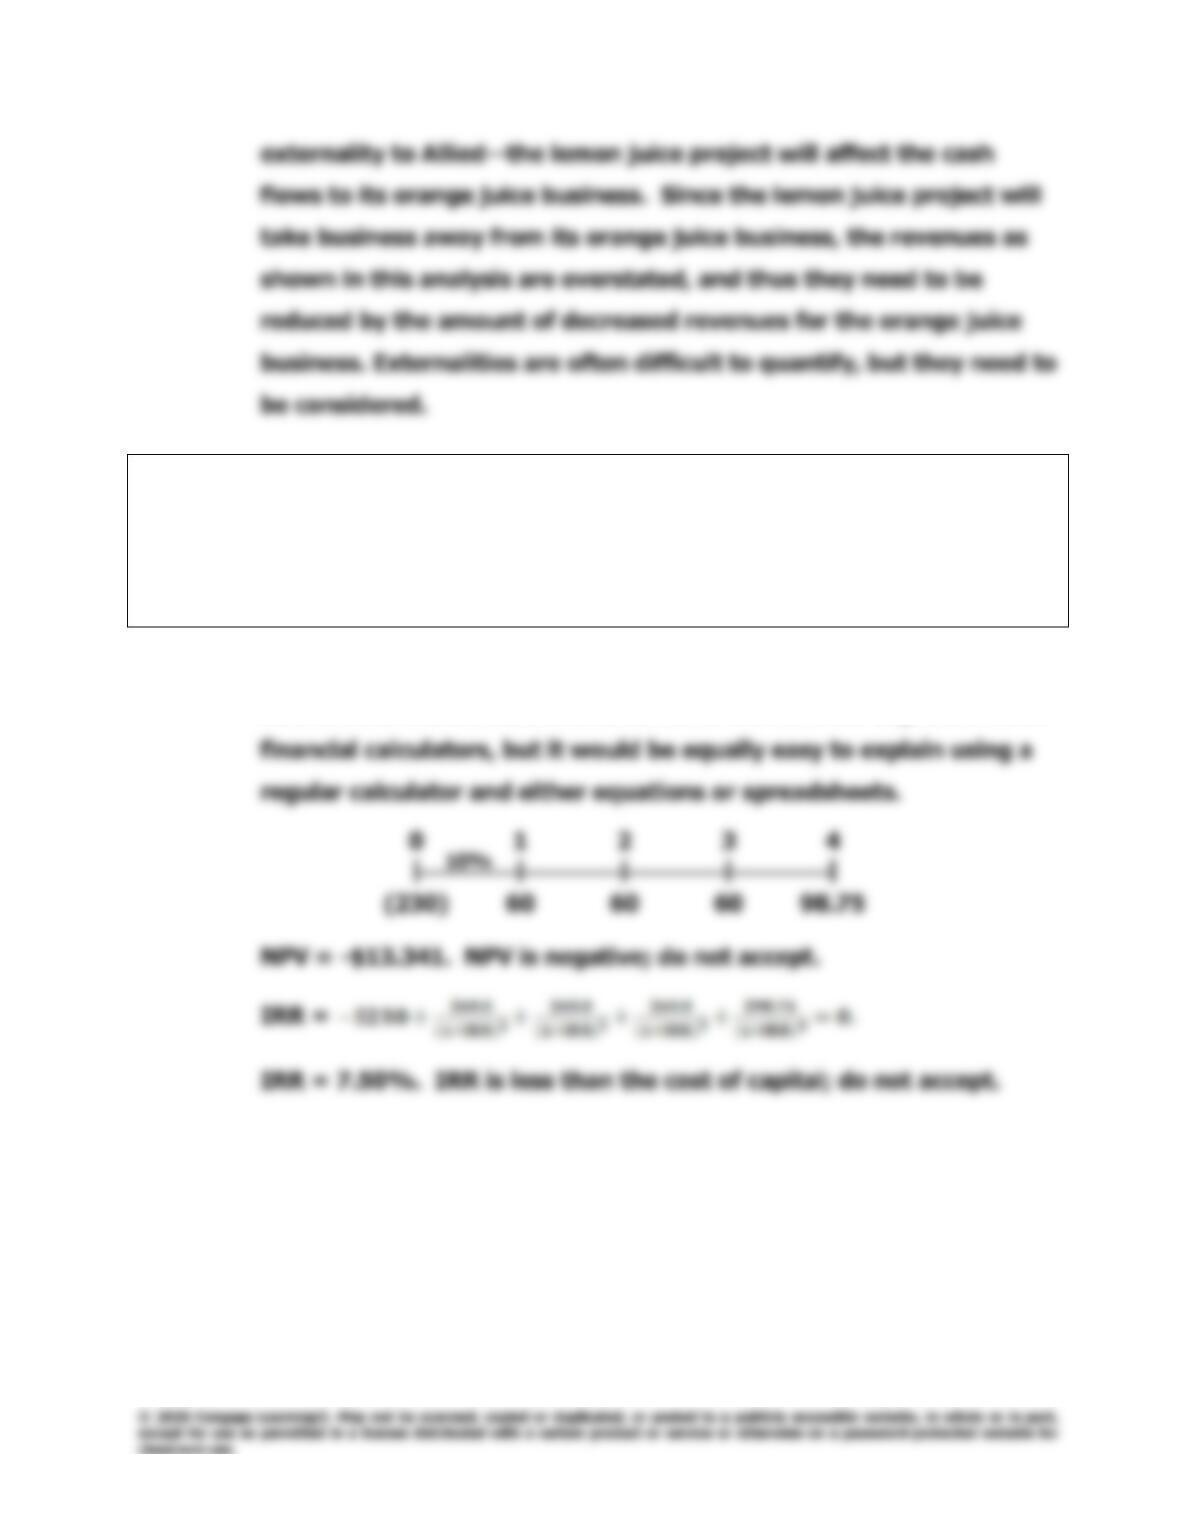
NPV = -$13.341
IRR = 7.50%
348
Integrated Case
Chapter 12: Cash Flow Estimation and Risk Analysis
B. (1) Allied uses debt in its capital structure, so some of the money used to
finance the project will be debt. Given this fact, should the projected
cash flows be revised to show projected interest charges? Explain.
Answer: [Show S12-10 here.] The projected cash flows in the table should
not be revised to show interest charges. The effects of debt
B. (2) Suppose you learned that Allied had spent $50,000 to renovate the
building last year, expensing these costs. Should this cost be
reflected in the analysis? Explain.
Answer: [Show S12-11 here.] This expenditure is a sunk cost; hence, it would
B. (3) Suppose you learned that Allied could lease its building to another
party and earn $25,000 per year. Should that fact be reflected in the
analysis? If so, how?
Answer: [Show S12–12 here.] The rental payment represents an opportunity
B. (4) Assume that the lemon juice project would take profitable sales away
from Allied’s fresh orange juice business. Should that fact be
reflected in your analysis? If so, how?
Answer: [Show S12-13 here.] The decreased sales from Allied’s fresh orange
Chapter 12: Cash Flow Estimation and Risk Analysis
Integrated Case
349
C. Disregard all the assumptions made in part B and assume there is no
alternative use for the building over the next 4 years. Now calculate
the project’s NPV, IRR, MIRR, and payback. Do these indicators
suggest that the project should be accepted? Explain.
Answer: [Show S12-14 here.] We refer to the completed time line and explain
how each of the indicators is calculated. We base our explanation on
350
Integrated Case
Chapter 12: Cash Flow Estimation and Risk Analysis
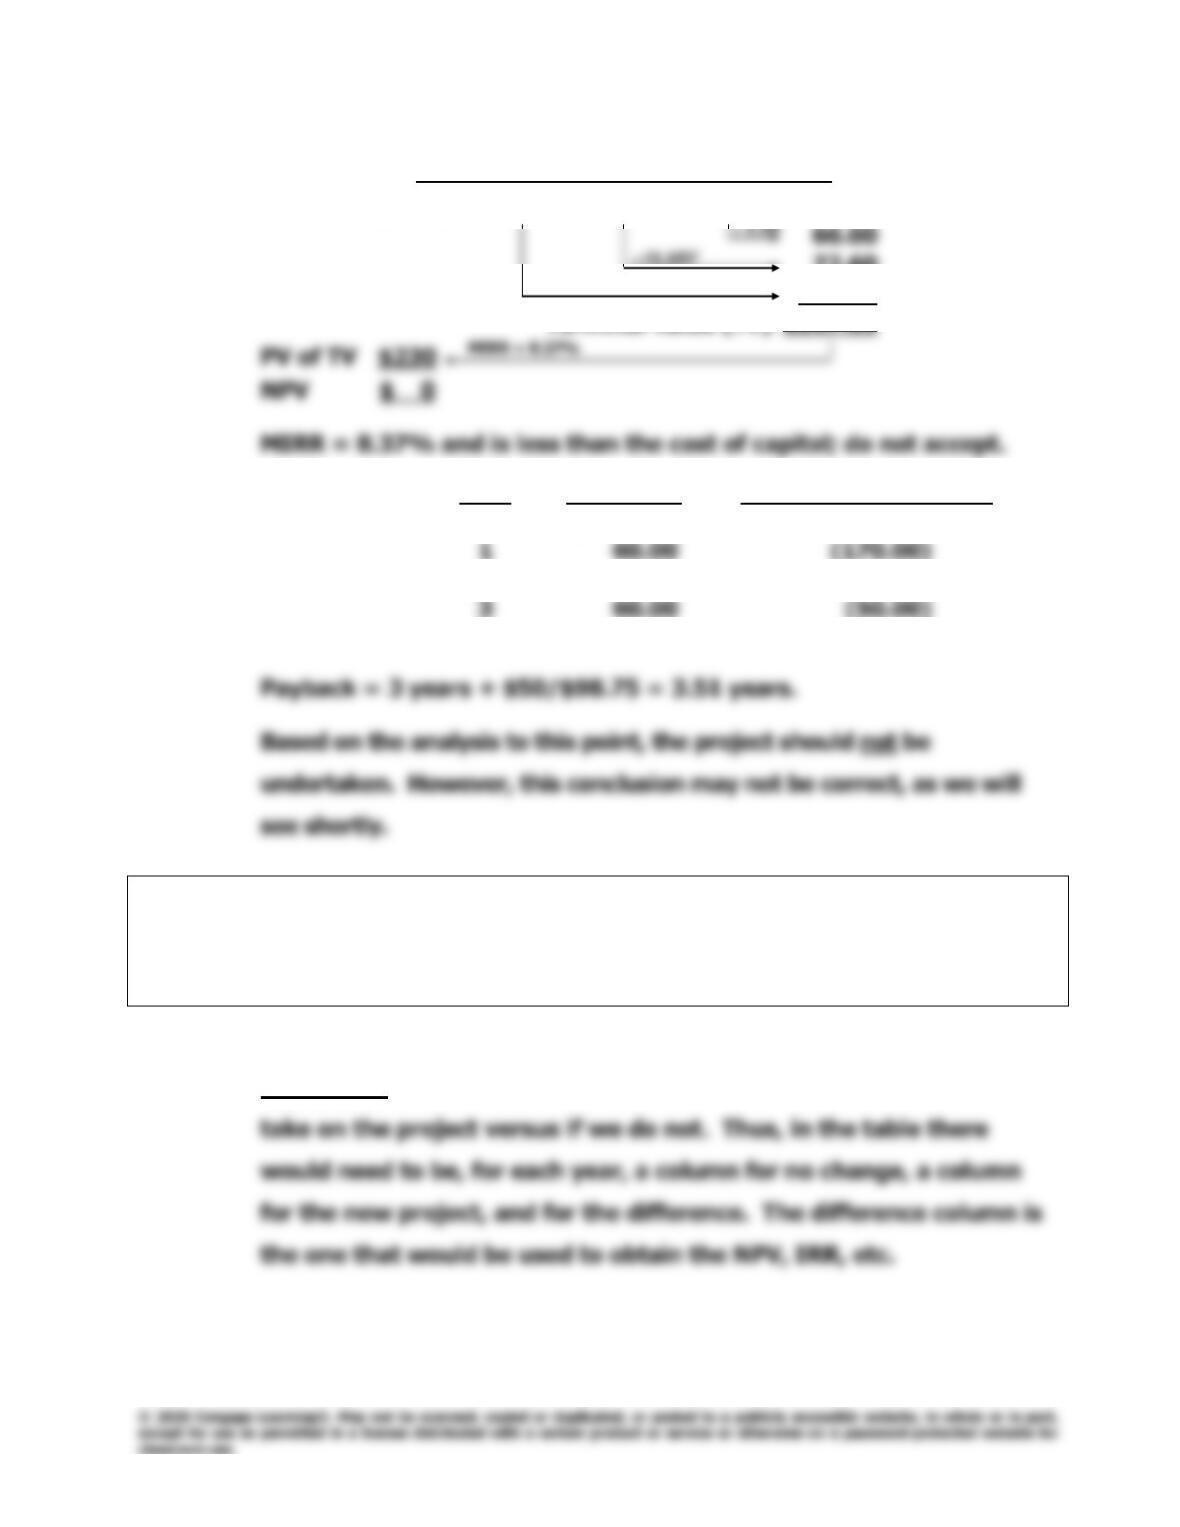
MIRR: 0 1 2 3 4
| | | | |
(230) 60 60 60 98.75
(1.10)2
72.60
79.86
Terminal value (TV) $317.21
Payback: Year Cash Flow Cumulative Cash Flow
0 ($230.00) ($230.00)
2 60.00 (110.00)
4 98.75 48.75
D. If this project had been a replacement rather than an expansion
project, how would the analysis have changed? Think about the
changes that would have to occur in the cash flow table.
Answer: [Show S12-15 here.] In a replacement analysis, we must find
differences in cash flows, i.e., the cash flows that would exist if we
(1.10)3
10%
Chapter 12: Cash Flow Estimation and Risk Analysis
Integrated Case
351
E. (1) What three levels, or types, of project risk are normally considered?
Answer: [Show S12-16 through S12-19 here.] Here are the three types of
project risk:
1. Stand-alone risk is the project’s total risk if it were operated
independently. Stand-alone risk ignores both the firm’s
2. Within-firm (corporate) risk is the total riskiness of the project
giving consideration to the firm’s other projects, that is, to
3. Market risk is the riskiness of the project to a well-diversified
E. (2) Which type is most relevant?
Answer: [Show S12-20 here.] Because management’s primary goal is