Monopoly and Monopsony 389
P12.6 Deadweight Loss From Monopoly. The Onondaga County Resource Recovery
(OCRRA) system assumed responsibility for solid waste management on November 1,
1990, for thirty-three of the thirty-five municipalities in Onondaga County, New York.
OCRRA is a non-profit public benefit corporation similar to the New York State
Thruway Authority. It is not an arm of county government. Its Board of Directors is
comprised of volunteers who develop programs and policies for the management of solid
waste. The OCRRA Board is responsible for adopting a budget that ensures there will
be sufficient revenues to cover expenditures. It does not rely on county taxes. OCRRA
has implemented an aggressive series of programs promoting waste reduction and
recycling where markets exist to create new products. While a number of communities
struggle to surpass the 20% recycling mark, Onondaga County’s households and
commercial outlets currently recycle more than 67% of the waste that once was buried
in landfills. Converting non-recyclable waste into energy (electricity) is also a top
priority.
To show the deadweight loss from monopoly problem, assume that monthly
OCRRA’s market supply and demand conditions are:
where Q is the number of customers served, and P is the market price of annual trash
hauling and recycling service.
A. Graph and calculate the equilibrium price/output solution. How much consumer
surplus, producer surplus, and social welfare are produced at this activity level?
390 Chapter 12
P12.6 SOLUTION
A. The market supply curve is given by the equation
The market demand curve is given by the equation
To find the competitive market equilibrium price, equate the market demand and
market supply curves where quantity is expressed as a function of price:
To find the competitive market equilibrium quantity, set equal the market supply
Monopoly and Monopsony 391
Therefore, the competitive market equilibrium price-output combination is a
In words, this means that at a competitive market price of $250 the quantity demanded is
500,000, resulting in total revenues of $125 million per year. The fact that consumer
At a competitive market price for trash hauling and recycling service of $250, producer
392 Chapter 12
= $37.5 million per year
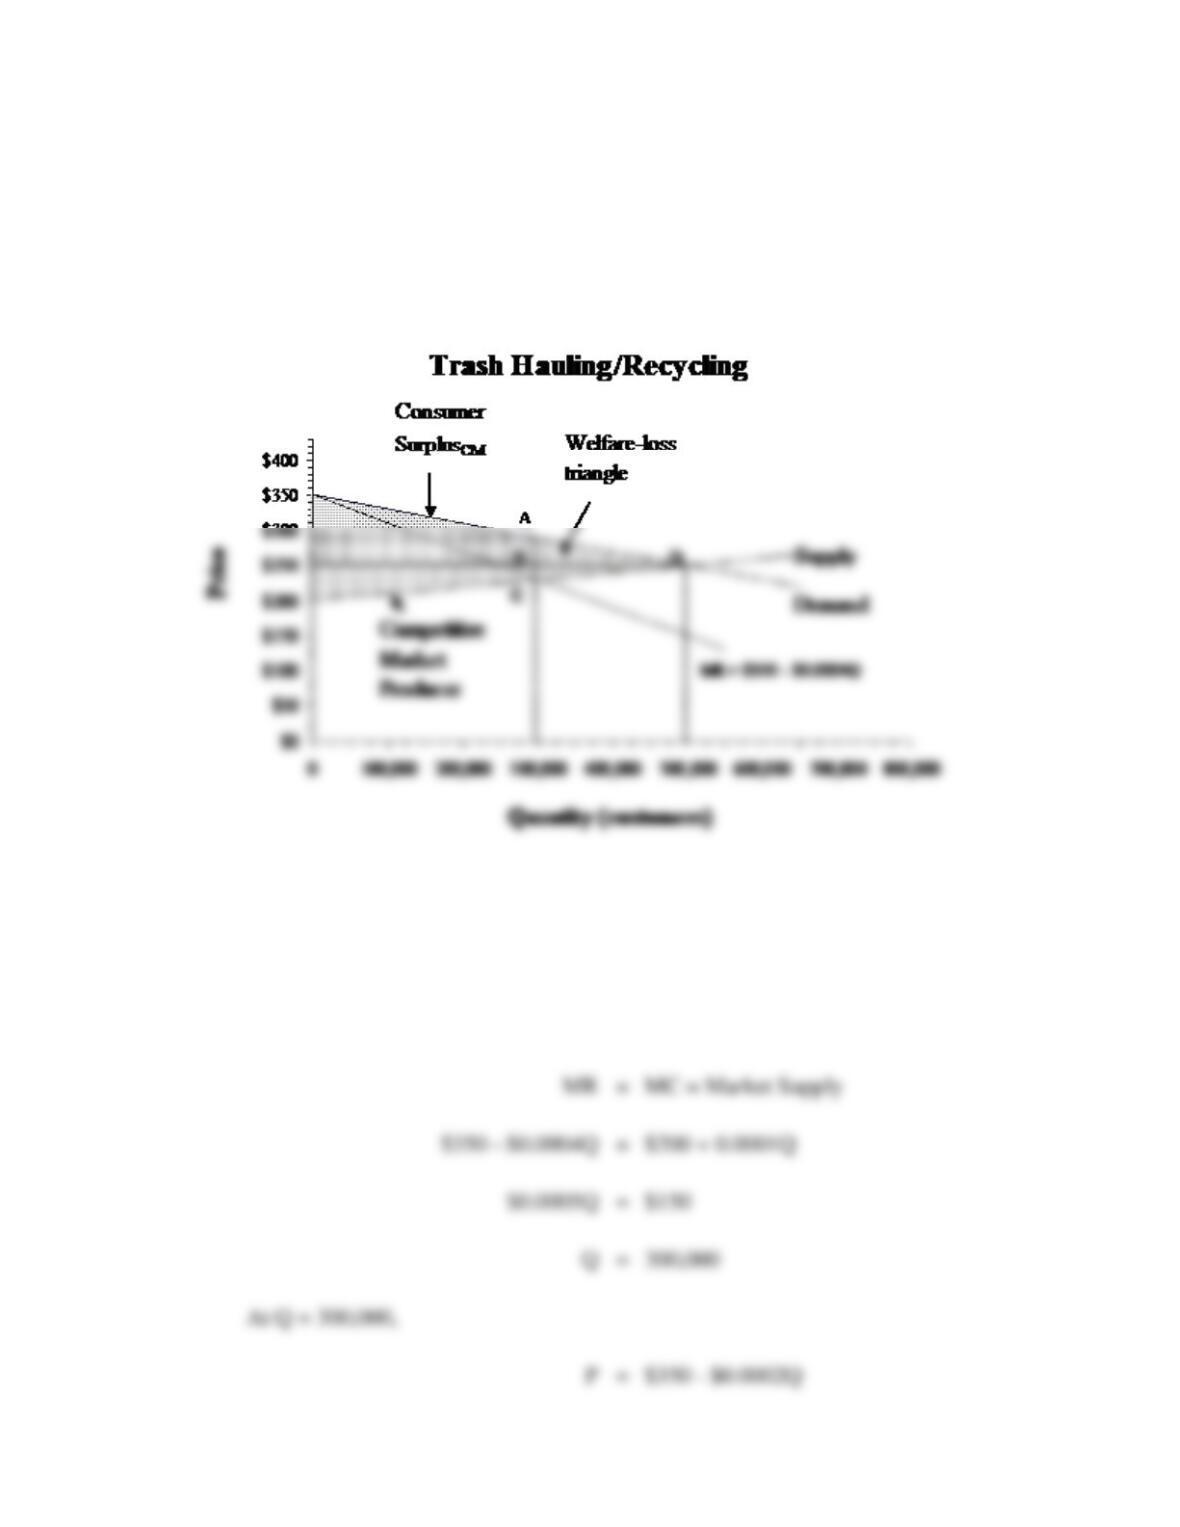
B. If the industry is run by a profit-maximizing monopolist, the optimal price-output
combination can be determined by setting marginal revenue equal to marginal cost and
solving for Q:
Monopoly and Monopsony 393
Under monopoly, the amount supplied falls to 300,000 and the market price jumps to
The amount of deadweight loss from monopoly suffered by producers is given by the
triangle bounded by BCD. Because the area of such a triangle is one-half the value of
P12.7 Wealth Transfer Problem. The Organization of the Petroleum Exporting Countries
(OPEC) was formed on September 14, 1960 in Baghdad, Iraq. The current membership
is comprised of five founding members plus six others: Algeria, Indonesia, Iran, Iraq,
Kuwait, Libya, Nigeria, Qatar, Saudi Arabia, the United Arab Emirates and Venezuela.
OPEC’s stated mission is “to bring stability and harmony to the oil market by adjusting
their oil output to help ensure a balance between supply and demand.” At least twice a
year, OPEC members meet to adjust OPEC’s output level in light of anticipated oil
394 Chapter 12
market developments. OPEC’s eleven members collectively supply about 40 per cent of
the world’s oil output and possess more than three-quarters of the world’s total proven
crude oil reserves.
To demonstrate the deadweight loss from monopoly problem, imagine that market
supply and demand conditions for crude oil are:
where Q is barrels of oil per day (in millions) and P is the market price of oil.
A. Graph and calculate the equilibrium price/output solution. How much consumer
surplus, producer surplus, and social welfare is produced at this activity level?
B. Use the graph to calculate the amount of consumer surplus transferred to the
monopoly producer following a change from a competitive market to a monopoly
market. How much is the net gain in producer surplus?
P12.7 SOLUTION
A. The market supply curve is given by the equation
Monopoly and Monopsony 395
To find the competitive market equilibrium price, equate the market demand and
market supply curves where quantity is expressed as a function of price:
To find the competitive market equilibrium quantity, set equal the market supply
and market demand curves where price is expressed as a function of quantity, and QS =
QD:
The value of consumer surplus is equal to the region under the market demand
curve that lies above the market equilibrium price of $30. Because the area of such a
396 Chapter 12
The value of producer surplus is equal to the region above the market supply curve
At a competitive market price for oil of $30 per barrel, producer surplus equals $900
(million) per day. Producers as a group received $900 (million) per day more than the
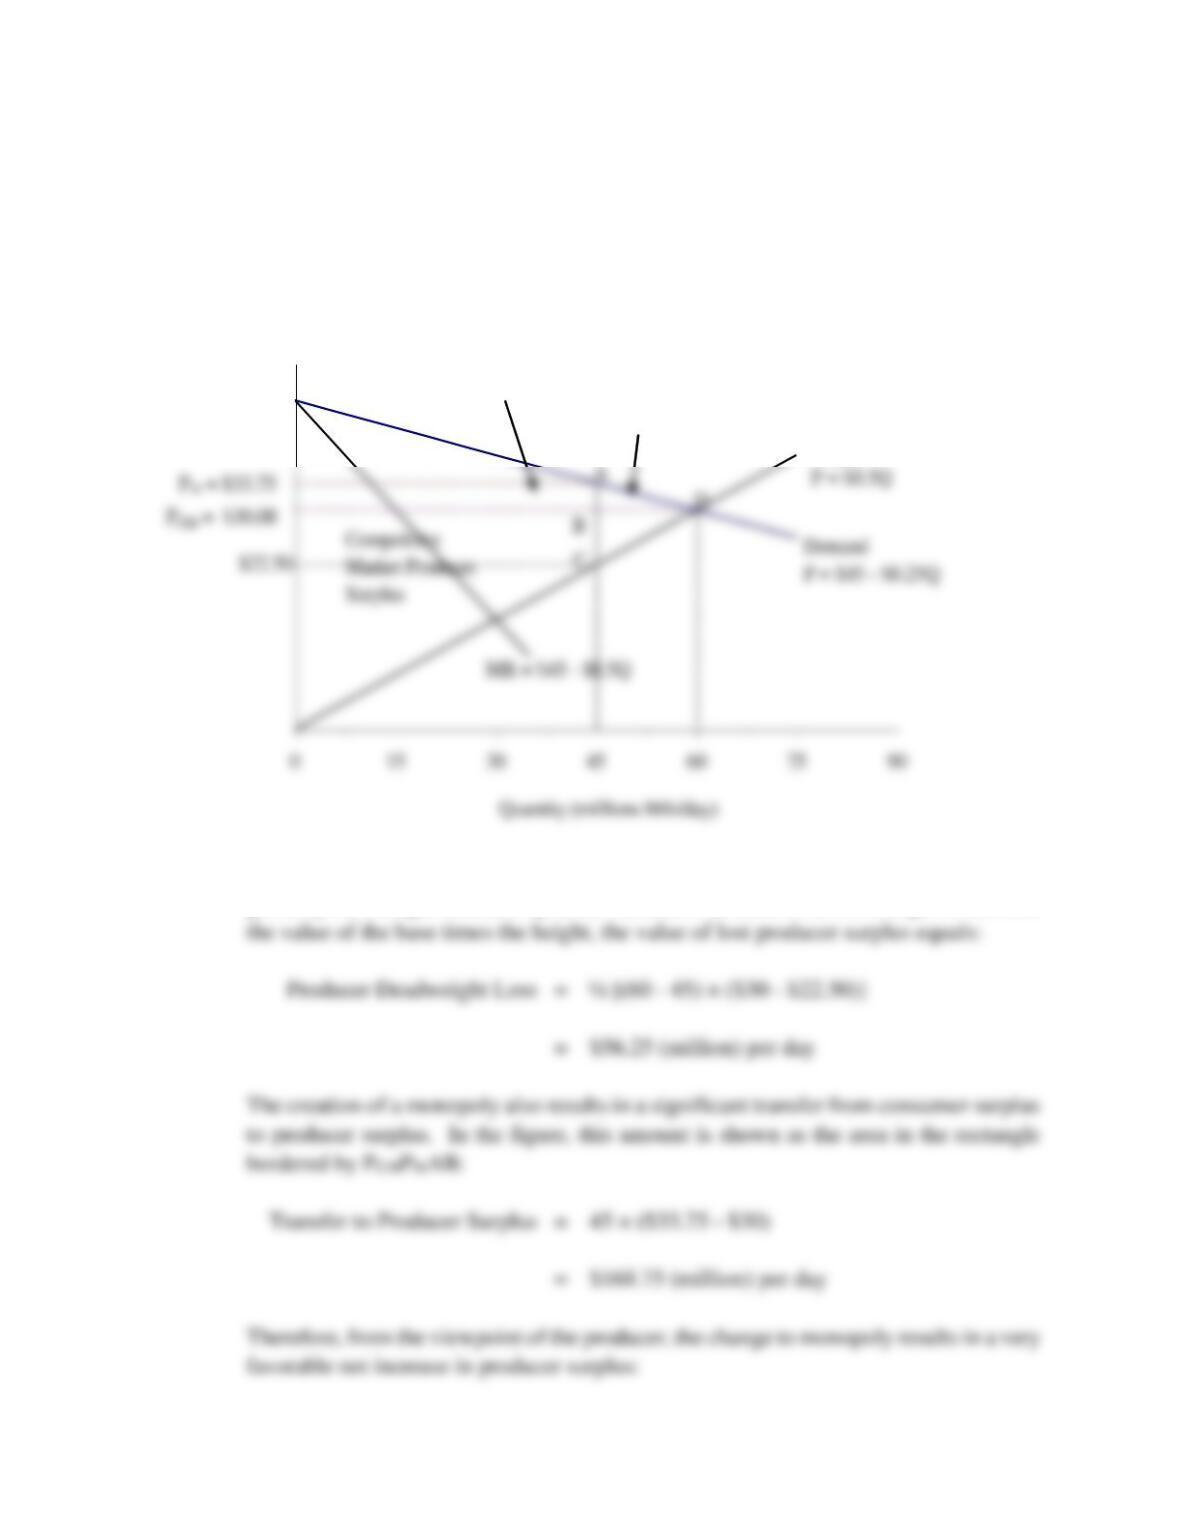
B. The amount of deadweight loss from monopoly suffered by the monopoly producer is
given by the triangle bounded by BCD. Because the area of such a triangle is one-half
Crude Oil Market
Price
Supply
$45.00
Deadweight
Loss in
Producer
Surplus
Producer Surplus
Transferred to
Consumers
398 Chapter 12
P12.8 Monopoly Profits. Portland Fluid Control, Inc., (PFC) is a major supplier of reverse
osmosis and ultrafiltration equipment, which helps industrial and commercial customers
achieve improved production processes and a cleaner work environment. The company
has recently introduced a new line of ceramic filters that enjoy patent protection.
Relevant cost and revenue relations for this product are as follows:
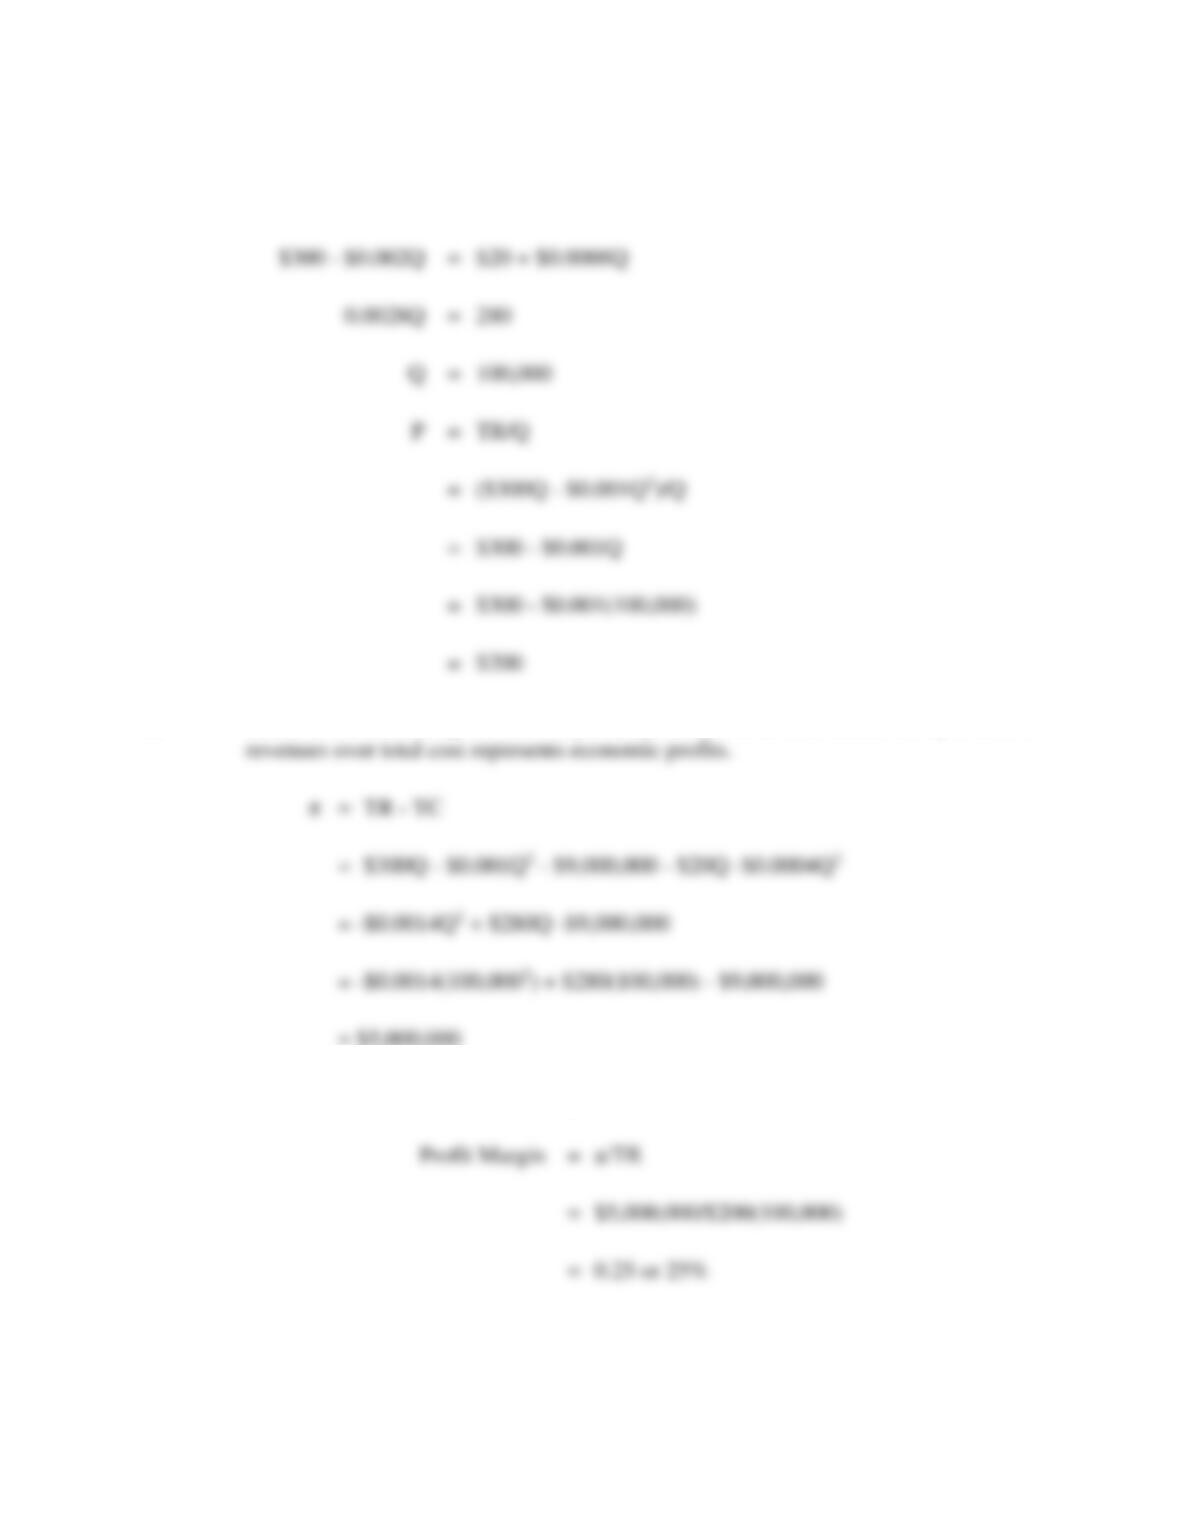
TR = $300Q – $0.001Q2
MR = ∂TR/∂Q = $300 – $0.002Q
TC = $9,000,000 + $20Q + $0.0004Q2
MC = ∂TC/∂Q = $20 + $0.0008Q
where TR is total revenue, Q is output, MR is marginal revenue, TC is total cost,
including a risk-adjusted normal rate of return on investment, and MC is marginal cost.
A. Compute PFC’s optimal monopoly price/output combination.
B. Compute monopoly profits and the optimal profit margin at this profit-maximizing
activity level.
P12.8 SOLUTION
Monopoly and Monopsony 399
B. Because the cost of capital is already included in the total cost function, any excess of
= $5,000,000
And finally, the optimal profit margin is:
P12.9 Monopoly versus Competitive Market Equilibrium. During recent years, MicroChips
Corp. has enjoyed substantial economic profits derived from patents covering a wide
400 Chapter 12
range of inventions and innovations for microprocessors used in high-performance
desktop computers. A recent introduction, the Penultimate, has proven especially
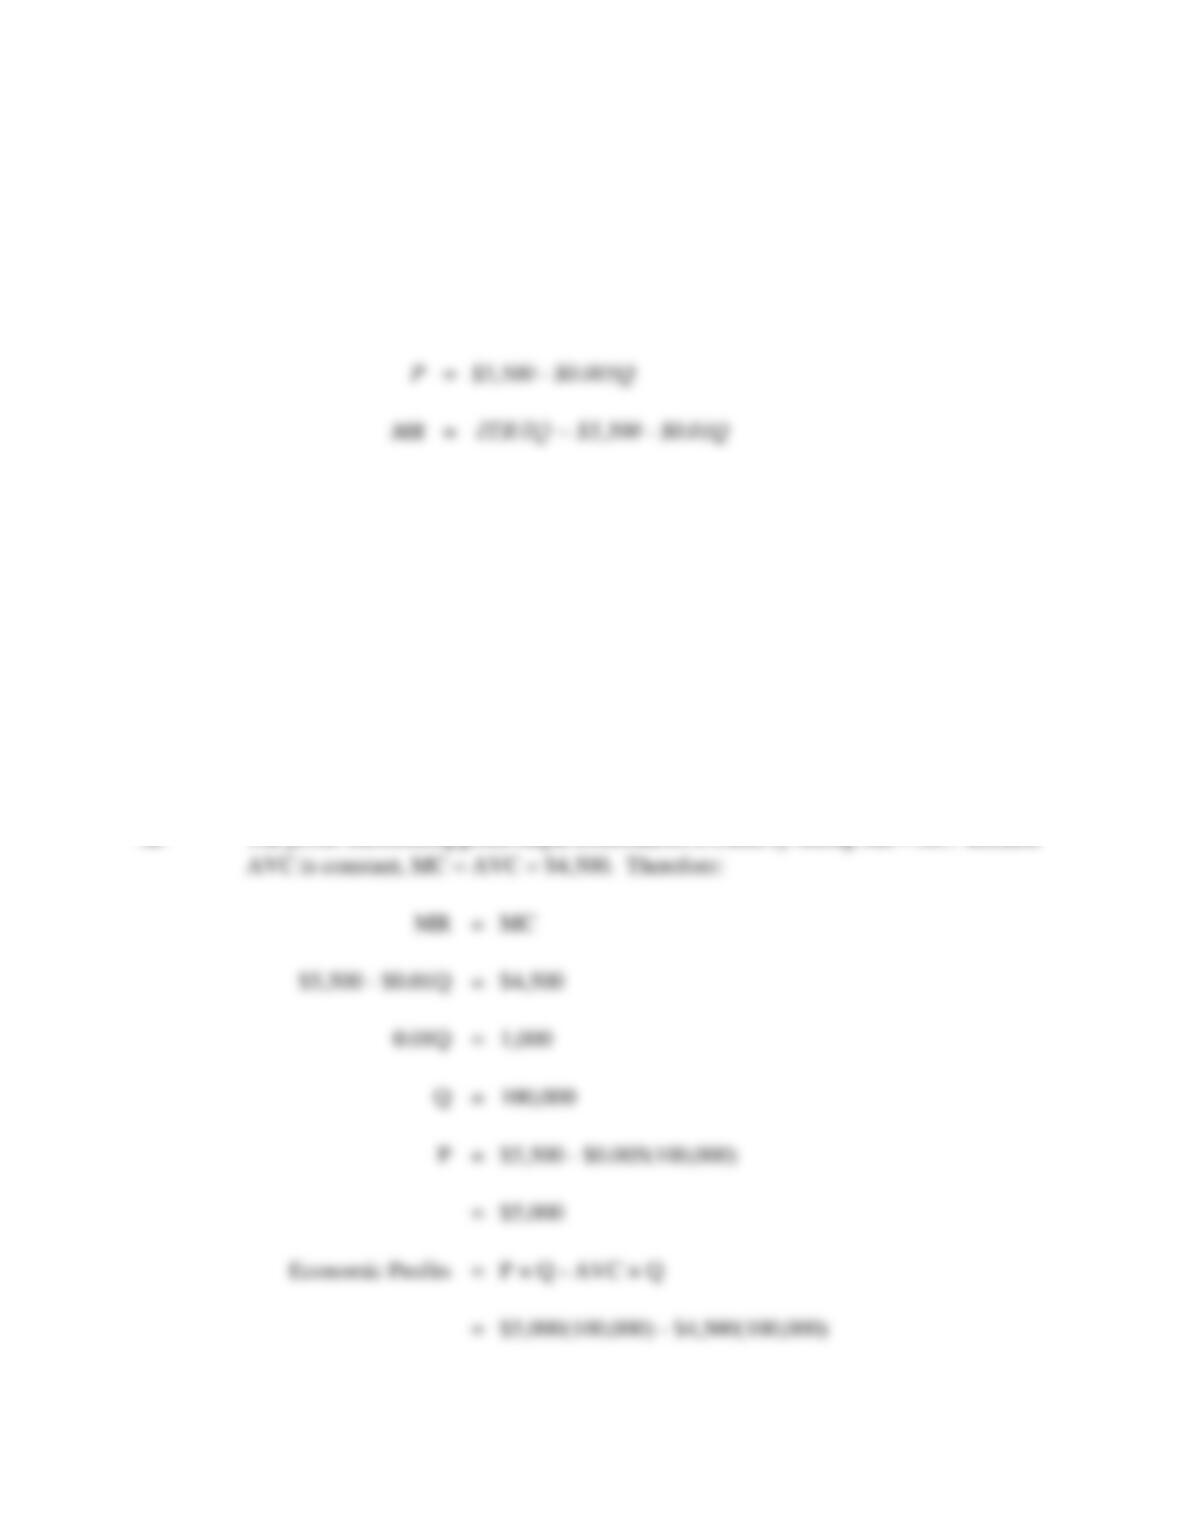
profitable. Market demand and marginal revenue relations for the product are as
follows:
Fixed costs are nil because research and development expenses have been fully
amortized during previous periods. Average variable costs are constant at $4,500 per
unit.
A. Calculate the profit-maximizing price/output combination and economic profits if
MicroChips enjoys an effective monopoly because of patent protection.
B. Calculate the price/output combination and total economic profits that would
result if competitors offer clones that make the market perfectly competitive.
P12.9 SOLUTION
A. The profit-maximizing price/output combination is found by setting MR = MC. Because
Monopoly and Monopsony 401
B. In a competitive market, P = MC. In this instance, AVC is constant and, therefore, MC
P12.10 Monopoly/Monopsony Confrontation. Safecard Corporation offers a unique service.
The company notifies credit card issuers after being informed that a subscriber’s credit
card has been lost or stolen. The Safecard service is sold to card issuers on an annual
subscription basis. Relevant revenue and cost relations for the service are as follows:
TR = $5Q – $0.00001Q2
402 Chapter 12
where TR is total revenue, Q is output measured in terms of the number of subscriptions
in force, MR is marginal revenue, TC is total cost, including a risk-adjusted normal rate
of return on investment, and MC is marginal cost.
A. If Safecard has a monopoly in this market, calculate the profit-maximizing
price/output combination and optimal total profit.
B. Calculate Safecard’s optimal price, output, and profits if credit card issuers
effectively exert monopsony power and force a perfectly competitive equilibrium in
this market.
P12.10 SOLUTION
A. The profit-maximizing monopoly price/output combination is found by setting MR =
B. If credit card issuers effectively exert monopsony power and force a perfectly
Monopoly and Monopsony 403
At the average-cost minimizing output level, MC = AC = $1.50. Because P = MR in a
perfectly competitive industry, at the profit-maximizing output level:
404 Chapter 12
CASE STUDY FOR CHAPTER 12
Effect of R&D on Tobin’s q
The idea of using the difference between the market value of the firm and accounting book values as
an indicator of market power and/or valuable intangible assets stems from the pioneering work of
Nobel laureate James Tobin. Tobin introduced the so-called q ratio, defined as the ratio of the
market value of the firm divided by the replacement cost of tangible assets. For a competitive firm in
a stable industry with no special capabilities, and no barriers to entry or exit, one would expect q to
Tobin’s q ratio surged during the 1990s, and some made the simple conclusion that
monopoly profits had soared during this period. In the early 1990s, however, the overall economy
suffered a sharp recession that dramatically reduced corporate profits and stock prices. By the end
of the 1990s, the economy had logged the longest peacetime expansion in history, and both
corporate profits and stock prices soared to record levels. Corporate profits, stock and Tobin’s q
ratios for major corporations took a sharp tumble over the 2000-03 period as the country entered a
In Table 12.3, q is approximated by the sum of the market value of common plus the book
values of preferred stock and total liabilities, all divided by the book value of tangible assets, for a
Monopoly and Monopsony 405
sample of corporate giants included in the Dow Jones Industrial Average (DJIA). To learn the role
played by R&D intensity as a determinant of Tobin’s q, the effects of other important factors must be
effects of current net profit margins. Revenue growth will have a positive effect on market values if
future investments are expected to earn above-normal rates of return and if growth is an important
determinant of these returns. While growth affects the magnitude of anticipated excess returns, a
stock-price influence may also be associated with the degree of return stability. Influences of risk
are estimated here using stock-price beta. With an increase in risk, the market value of expected
returns is anticipated to fall.
A. Explain how any intangible capital effects of R&D intensity can reflect the effects of
market power and/or superior efficiency.
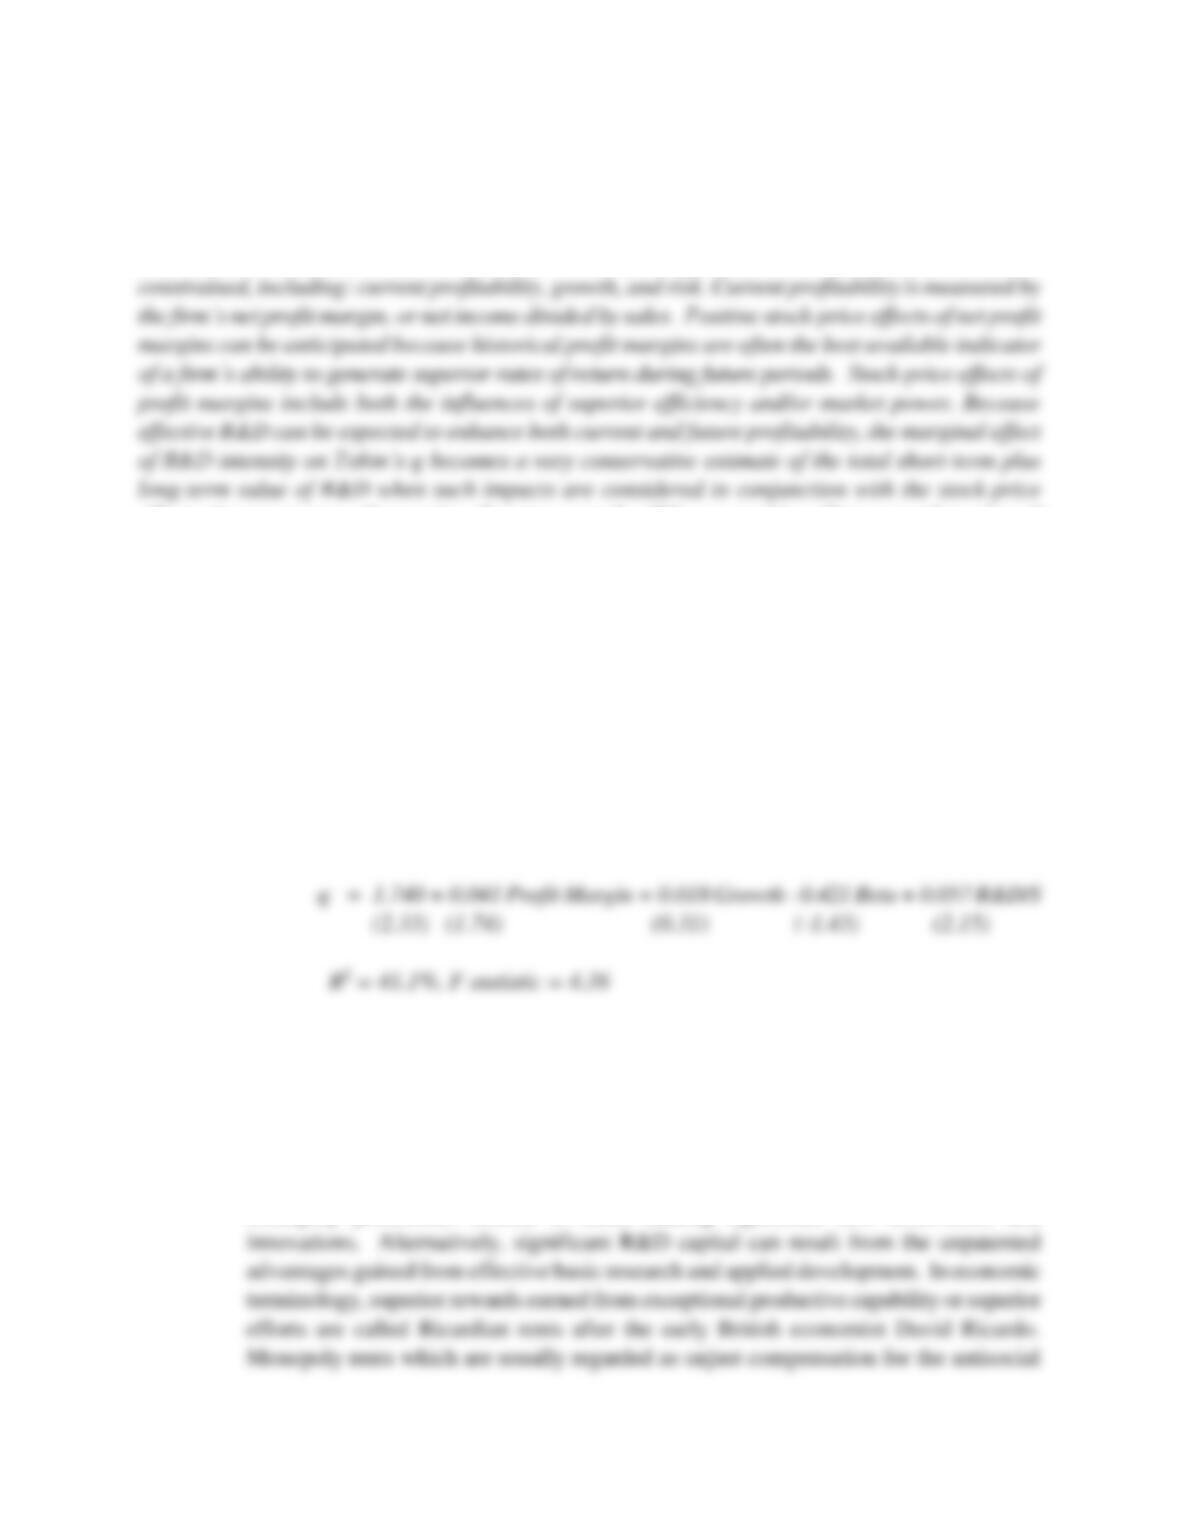
B. A multiple regression analysis based upon the data contained in Table 12.3 revealed the
following (t statistics in parentheses):
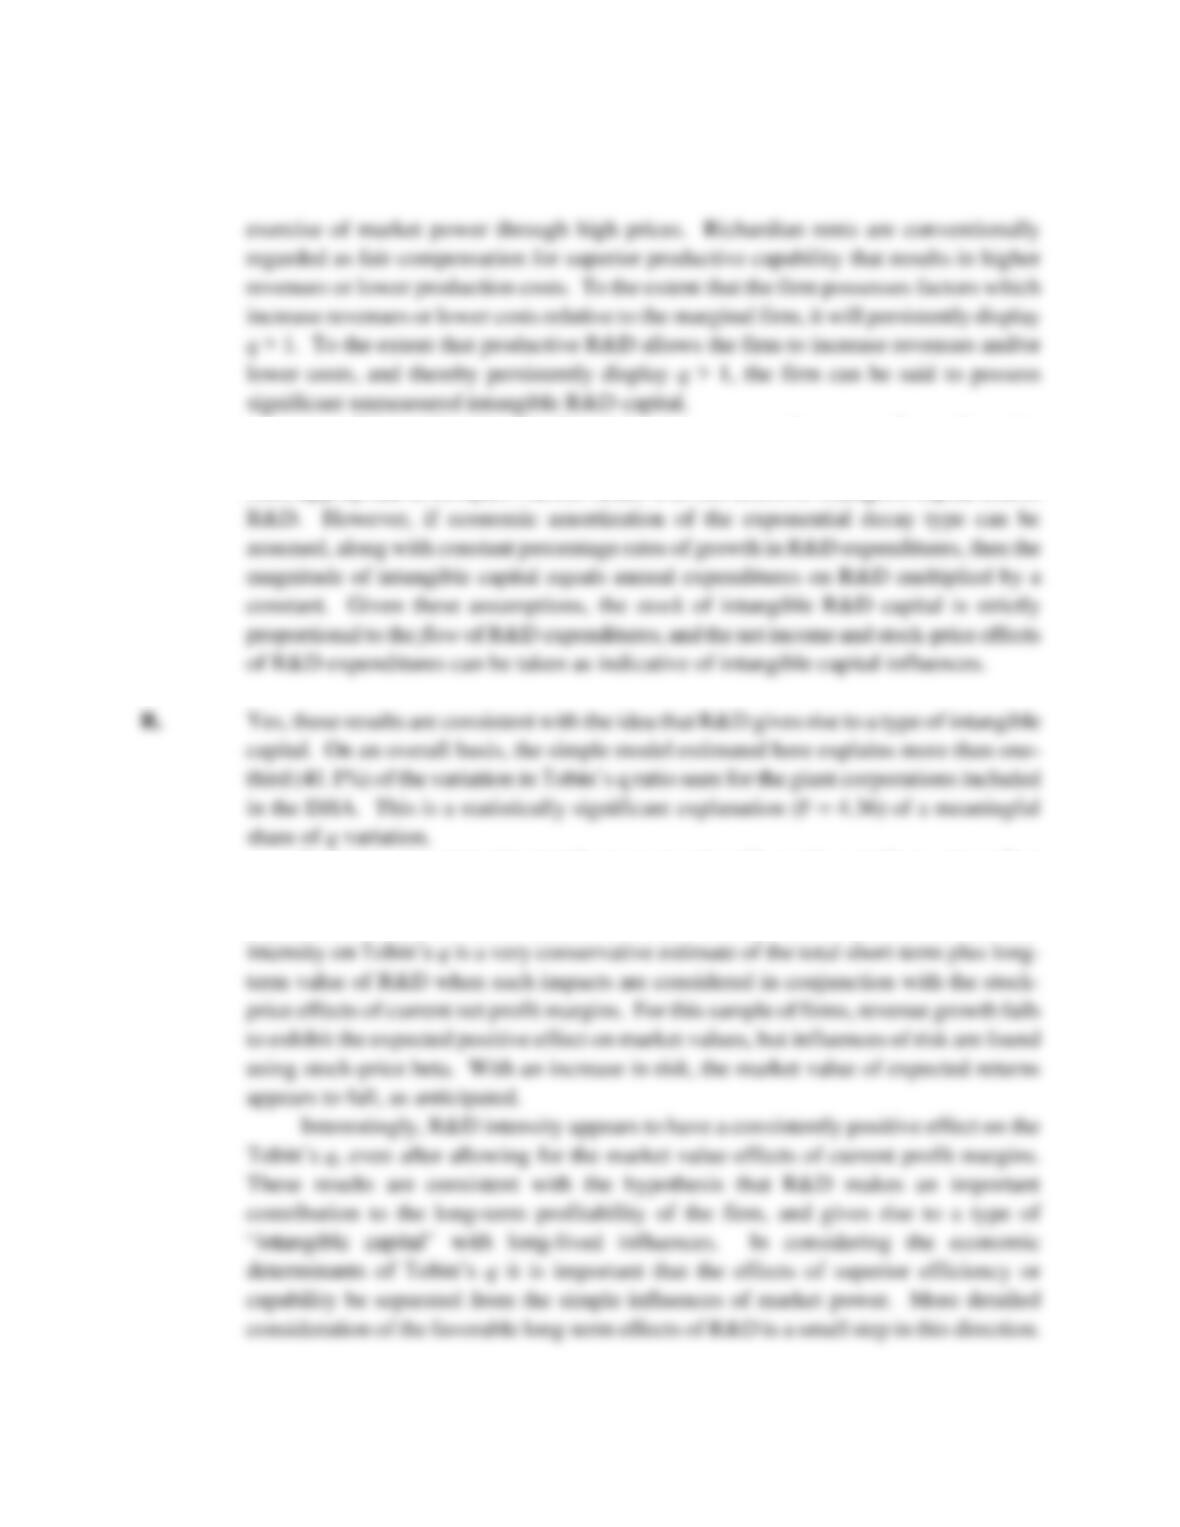
Are these results consistent with the idea that R&D gives rise to a type of intangible
capital?
CASE STUDY SOLUTION
A. Intangible R&D capital can be derived from the value obtained from patents and other
monopoly protections offered to firms making significant new discoveries and
406 Chapter 12
It is worth noting that this study compares a stock measure, the market value
of the firm, with the flow of R&D expenditures. On a theoretical basis, it would seem
more appropriate to compare market values with the stocks of intangible capital tied to
Positive and statistically significant stock-price effects of net profit margins reflect
the effects of superior efficiency and/or market power. Because effective R&D can be
expected to enhance both current and future profitability, the marginal effect of R&D