Performance and Strategy in Competitive Markets 355
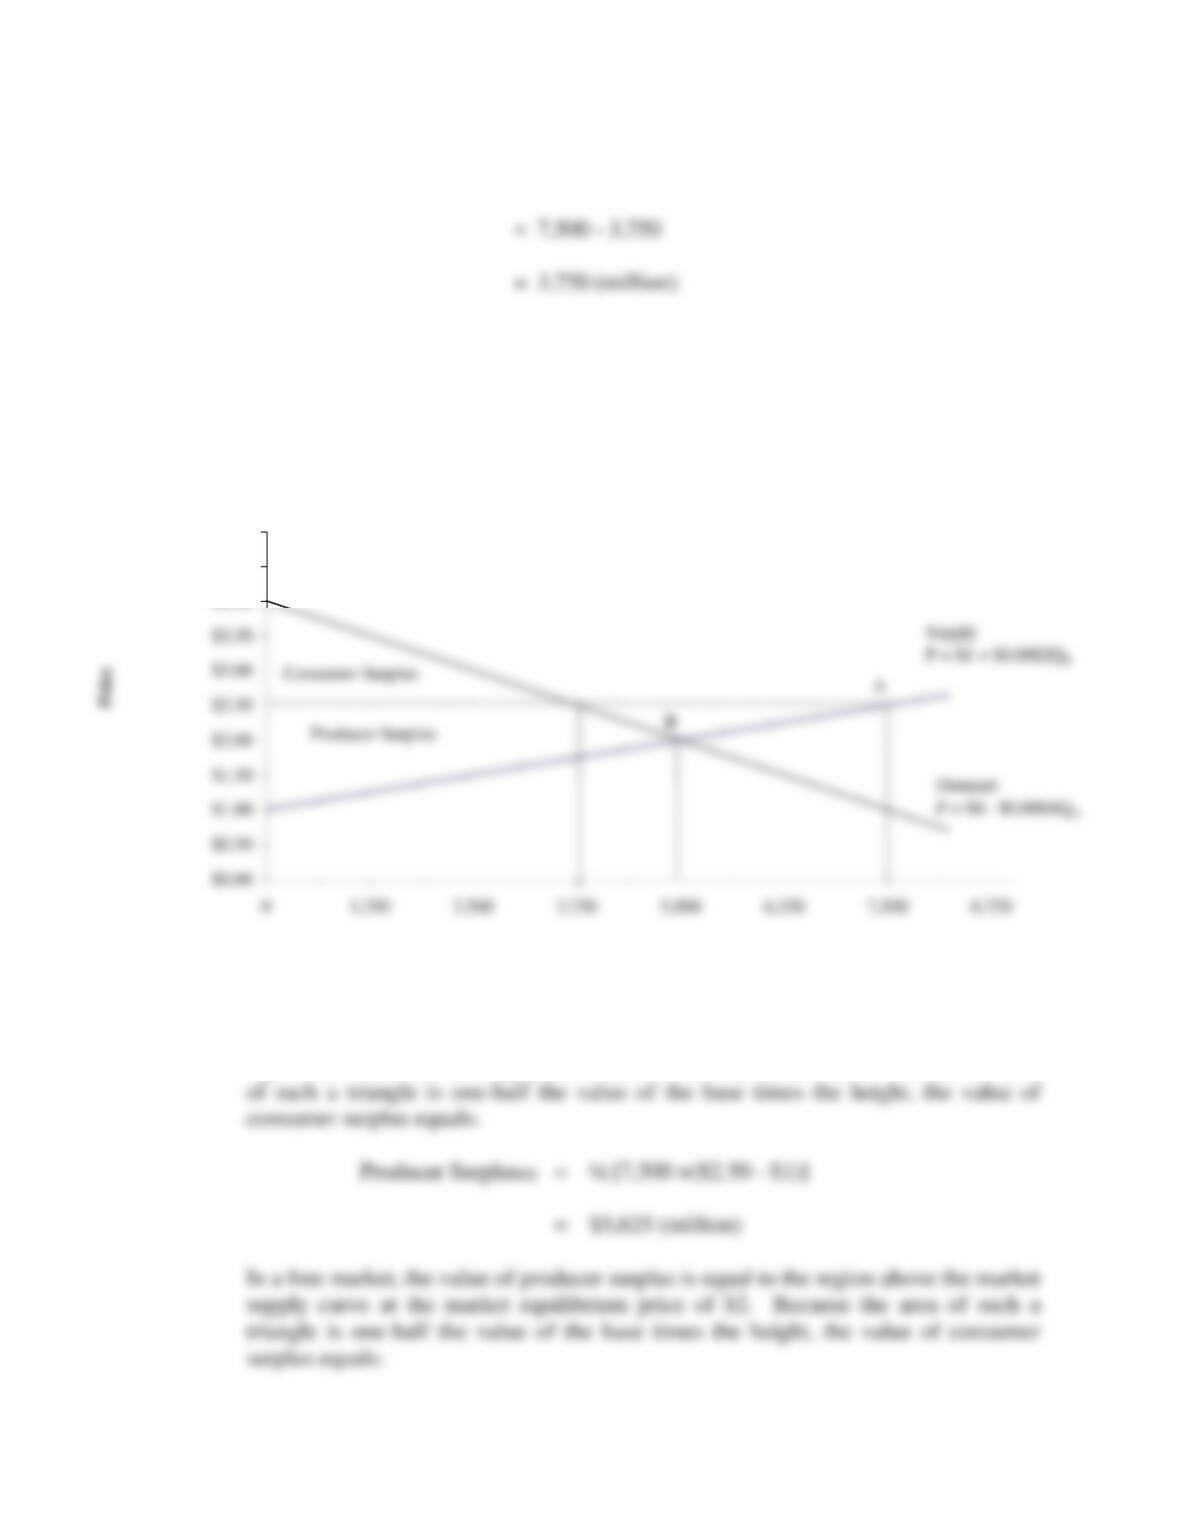
B. With a $2.50 government price support, the value of producer surplus is equal to the
region above the market supply curve at the market price of $2.50. Because the area
Corn Market Equilibrium
$4.00
$4.50
$5.00
Bushels of Corn (millions)
356 Chapter 11
P11.8 Import Controls. Critics argue that if Congress wants to make the tax code more
equitable, a good place to start would be removing unfair tariffs and quotas. Today,
there are more than eight thousand import tariffs, quotas, so-called voluntary import
restraints, and other import restrictions. Tariffs and quotas cost consumers roughly
$80 billion per year, or about $800 for every American family. Some of the tightest
restrictions are reserved for food and clothing that make up a large share of low-
income family budgets.
The domestic shoe market shows the effects of import controls on a large
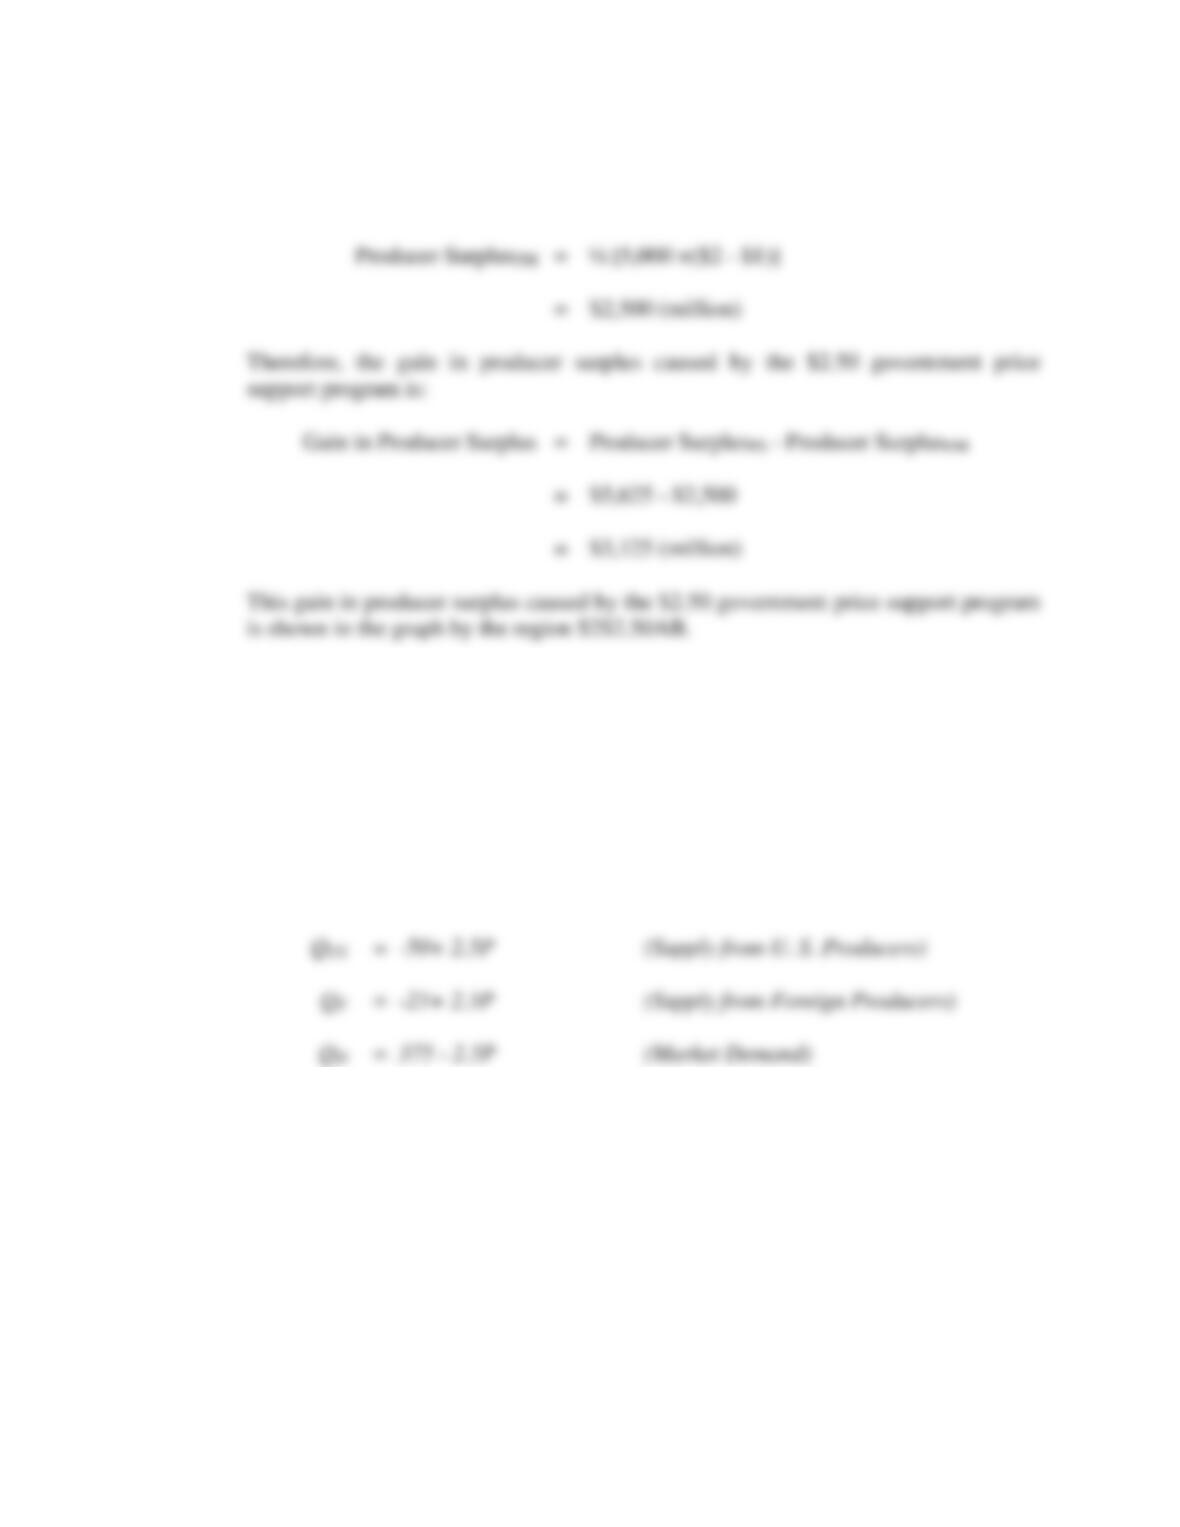
competitive market. Assume market supply and demand conditions for shoes are:
where Q is output (in millions), and P is the market price per unit.
A. Graph and calculate the equilibrium price/output solution assuming there are
no import restrictions, and under the assumption that foreign countries prohibit
imports.
B. Use this graph to help you algebraically determine the amount of consumer
surplus transferred to producer surplus and the deadweight loss in consumer
surplus due to a ban on foreign imports. Explain.
P11.8 SOLUTION

Performance and Strategy in Competitive Markets 357
A. In the absence of import restrictions, the market supply curve is determined by
adding supply from domestic plus foreign producers
The market demand curve is given by the equation
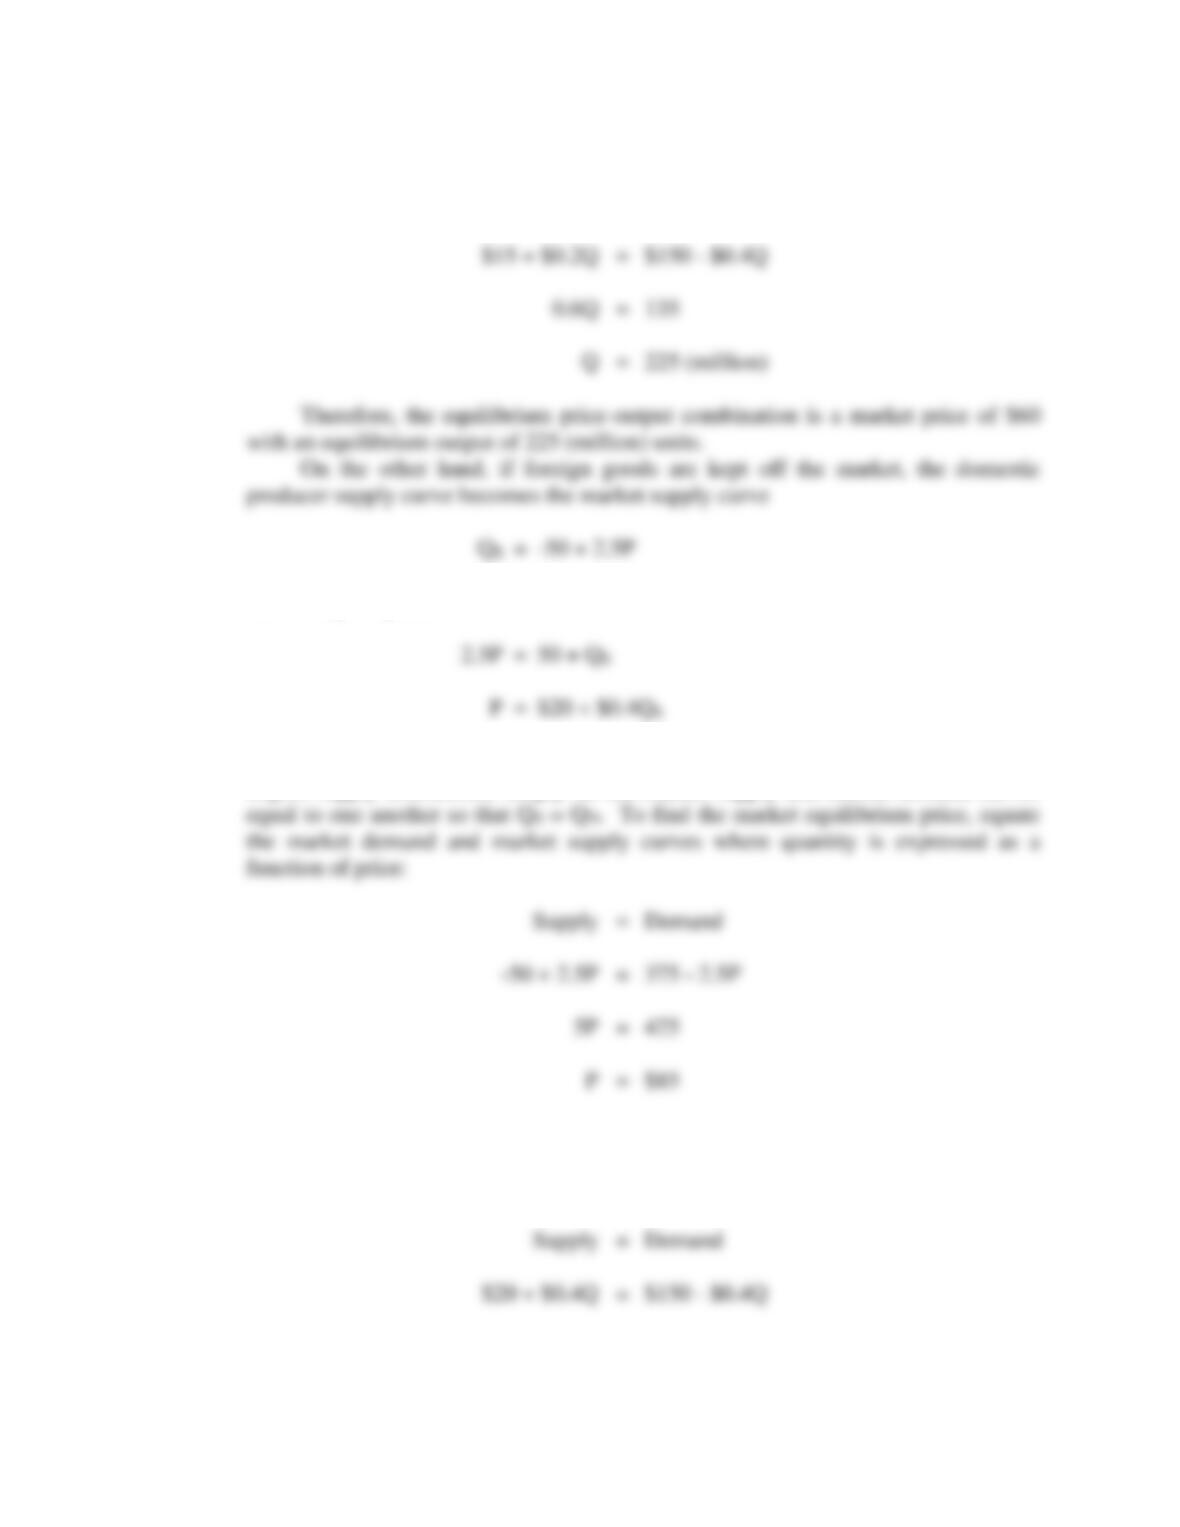
To find the market equilibrium levels for price and quantity, simply set the
market supply and market demand curves equal to one another so that QS = QD. To
358 Chapter 11
or, solving for price,
To find the market equilibrium levels for price and quantity in the face of
import supply restrictions, simply set the market supply and market demand curves
To find the market equilibrium quantity, set equal the market supply and
market demand curves where price is expressed as a function of quantity, and QS =
QD:
Performance and Strategy in Competitive Markets 359
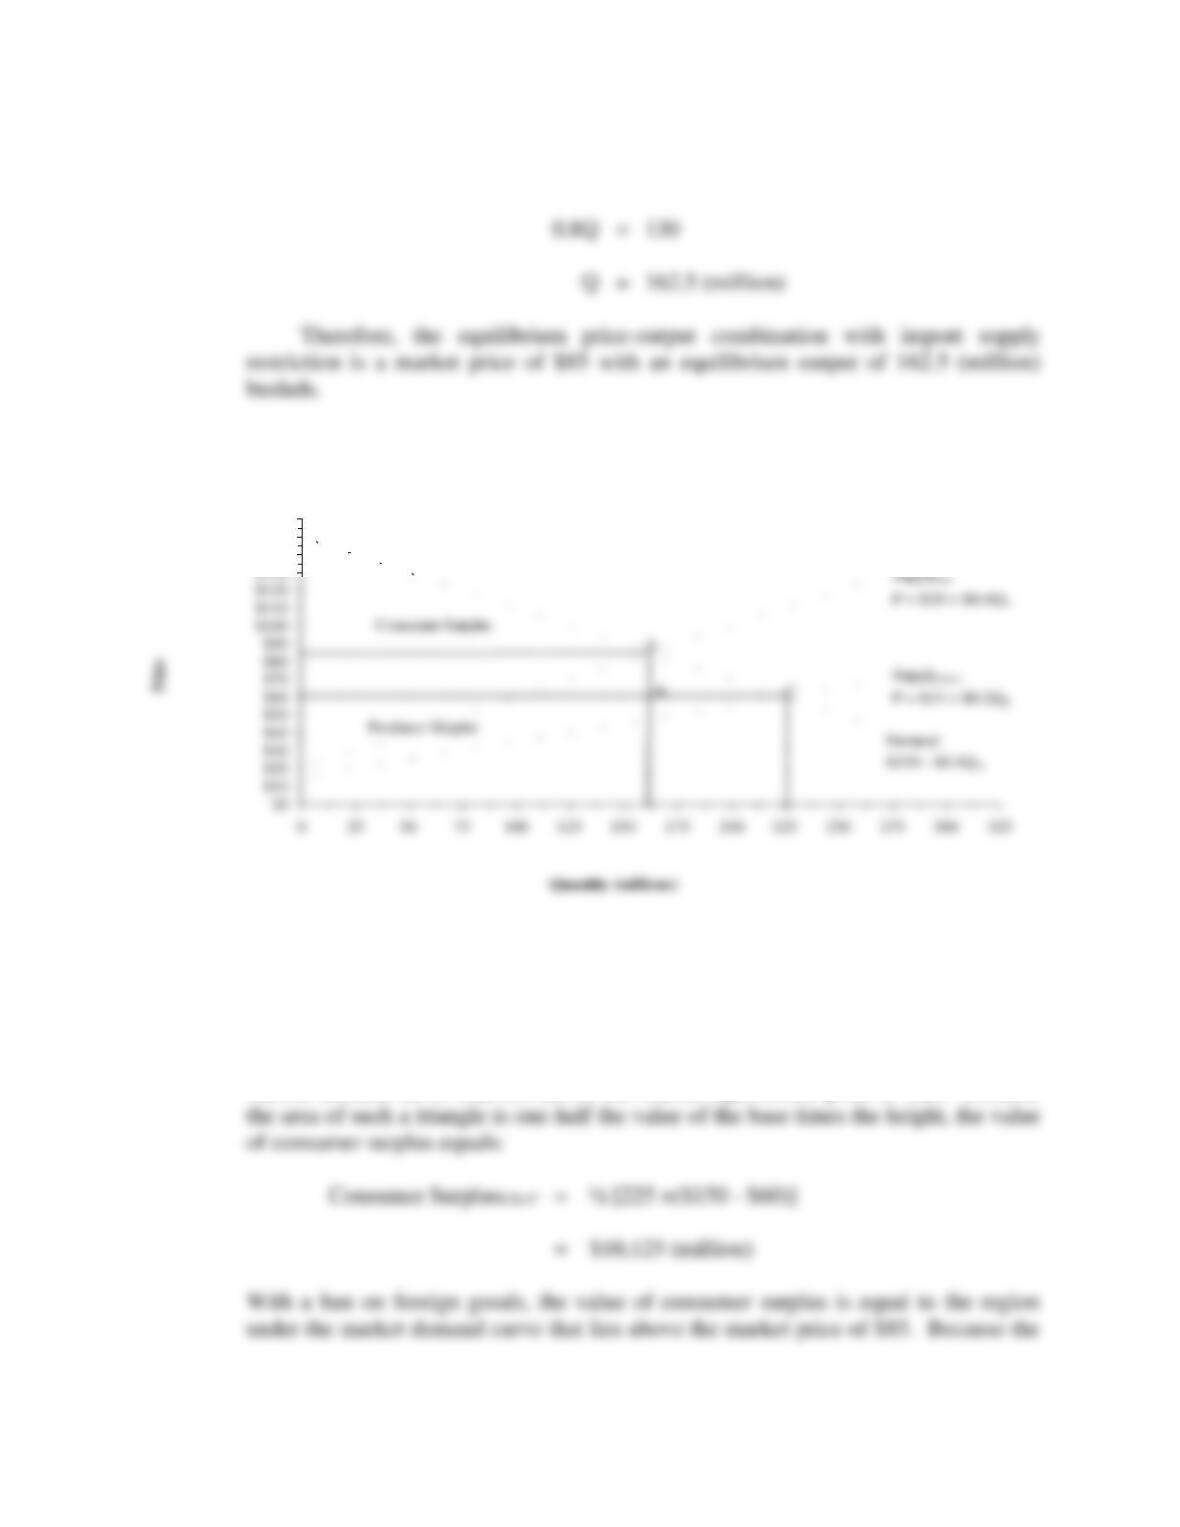
B. In a free market, the value of consumer surplus is equal to the region under the
market demand curve that lies above the market equilibrium price of $60. Because
Shoe Market Equilibrium
$140
$150
$160
360 Chapter 11
Therefore, the loss in consumer surplus caused by foreign supply restriction is:
Second, there is a deadweight loss of consumer surplus equal to the area shown as
P11.9 Protective Tariffs. In the United States, steel production has remained constant
since the 1970s at about 100 million tons per year. Large integrated companies, like
U.S. Steel remain important in the industry, but roughly 50% of domestic production
is now produced by newer, nimble and highly efficient mini-mill companies. Foreign
imports account for roughly 30% of domestic steel use. In order to stem the tide of
rising imports, President George W. Bush announced in 2002 that the United States
would introduce up to thirty per cent tariffs on most imported steel products. These
measures were to remain in place for three years. To show how protective tariffs can
help domestic producers, consider the following cost relations for a typical
competitor in this vigorously competitive market:
Performance and Strategy in Competitive Markets 361
TC = $150,000 + $100Q + $0.15Q2
MC =
TC/
Q = $100 + $0.3Q
Where TC is total cost, MC is marginal cost, and Q is output measured by tons of
Hot Dipped Galvanized Steel. Cost figures and output are in thousands.
A. Assume prices are stable in the market, and P = MR = $400. Calculate the profit–
maximizing price/output combination and economic profits for a typical producer in
competitive market equilibrium.
B. Calculate the profit-maximizing price/output combination and economic profits for a
typical producer if domestic market prices rise by 30% following introduction of
Bush’s protective tariff.
P11.9 SOLUTION
A. The profit-maximizing price/output combination is found by setting MR = MC:
B. Following introduction of the Bush protective tariff, the domestic market price can be
362 Chapter 11
P11.10 Generic Competition. The Federal Trade Commission seeks to ensure that the
process of bringing new low-cost generic alternatives to the marketplace and into the
hands of consumers is not impeded in ways that are anti-competitive. To illustrate
the potential for economic profits from delaying generic drug competition for one
year, consider cost and demand relationships for an important brand-name drug set
to lose patent protection:
TR = $10.25Q – $0.01Q2
MR = ∂TR/∂Q = $10.25 – $0.02Q
A. Set MR = MC to determine the profit-maximizing price/output solution and economic
profits prior to the expiration of patent protection.
Performance and Strategy in Competitive Markets 363
B. Calculate the firm’s competitive market equilibrium price/output solution and
economic profits following the expiration of patent protection and onset of generic
competition.
P11.10 SOLUTION
A. The profit-maximizing monopoly price/output combination is found by setting MR =
B. If the onset of generic competition forces a competitive market solution, P = MR =
364 Chapter 11
At the average-cost minimizing output level, MC = AC = $2.75. Because P = MR in
a competitive market equilibrium:
Performance and Strategy in Competitive Markets 365
CASE STUDY FOR CHAPTER 11
The Most Profitable S&P 500 Companies
While net income is an obviously useful indicator of a firm’s profit-generating ability, it has
equally obvious limitations. Net income will grow with a simple increase in the scale of the
operation. A 2% savings account will display growing interest income over time, but would
scarcely represent a good long-term investment. Similarly, a company that generates profit
growth of only 2% per year would seldom turn out to be a good investment. In the same way,
Because absolute measures, like net income, paint only an incomplete picture of
corporate profitability, various relative measures of profitability are typically relied upon by
investors. First among these is the accounting rate of return on stockholders’ equity (ROE)
measure. Simply referred to as ROE, the return on stockholders’ equity measure is defined as
net income divided by the book value of stockholders’ equity, where stockholders’ equity is the
interpreting ROE for companies that have undergone significant restructuring, and for highly
leveraged companies, some investors focus on the return on assets, or net income divided by the
book value of total assets. Like ROE, return on assets (ROA) captures the effects of managerial
operating decisions. ROA also tends to be less affected than ROE by the amount of financial
leverage employed. As such, ROE has some advantages over ROA as a fundamental measure of
business profits. Irrespective of whether net income, profit margin, ROE, ROA, or some other
366 Chapter 11
Table 11.2 shows ROE data for 30 of the most consistently profitable companies found
within the Standard and Poor’s 500 stock index. Beer titan Anheuser-Busch Companies, Inc.;
personal products and drug manufacturer Johnson & Johnson, and consumer goods goliath
Procter & Gamble Co. are enormously profitable when profits are measured using ROE. To get
some useful perspective on the source of these enormous profits, it is worth considering the
Considering the effects of profit margins on the market value of the firm is a simple
means for getting some interesting perspective on the importance of profit margins as an
indicator of the firm’s ability to sustain superior profitability. The market value of the firm
represents the stock market’s assessment of the firm’s future earnings power. If high profit
margins suggest attractive profit rates in the future, then profit margins should have a
statistically significant impact on the current market value of the firm. An attractive way to
measure the stock market’s assessment of profit margin data is to study the link between profit
margins and the firm’s P/E ratio. In the P/E ratio, “P” stands for the company’s stock price,
and “E” stands for company earnings, both measured on a per share basis. P/E ratios are high
when investors see current profits as high, durable, and/or rapidly growing; P/E ratios are low
when investors see current profits as insufficient, vulnerable, or shrinking.
The P/E ratio effects of ROE, profit margin, total asset turnover, and financial leverage
for consistently profitable corporate giants found within the S&P 500 are shown in Table 11.3.
A. Describe some of the advantages and disadvantages of ROE as a measure of
Performance and Strategy in Competitive Markets 367
C. Based upon the findings reported in Table 11.3, discuss the relation between P/E
ratios and profit margins, total asset turnover, and financial leverage. In general,
which component of ROE is the most useful indicator of the firm’s ability to sustain
high profit rates in the future?
CASE STUDY SOLUTION
A. For successful large and small firms in the United States and Canada, ROE averages
roughly 10 to 15% during a typical year. This average ROE is comprised of a typical
This naturally suggests an important question: How is it possible to know if
business profit rates in any given circumstance are sufficient to compensate investors
for the risks undertaken? The answer to this difficult question turns out to be rather
simple: just ask current and potential shareholders and bondholders. While it is
difficult to accurately assess business risk, and the problem of accurately measuring
Finally, while ROE may indeed be the most useful accounting indicator of
business profits, other accounting data should also be used to compare profit rates
368 Chapter 11
B. When profit margins are high, robust demand or stringent cost controls, or both,
allow the firm to earn a significant profit contribution. Holding capital requirements
constant, the firm’s profit margin is a useful indicator of managerial efficiency in
Leverage is often defined as the ratio of the book value of total assets divided
by stockholders’ equity. It reflects the extent to which debt and preferred stock are
used in addition to common stock financing. Leverage is used to amplify firm profit
rates over the business cycle. During economic booms, leverage can dramatically
increase the firm’s profit rate; during recessions and other economic contractions,
leverage can just as dramatically decrease realized rates of return, if not lead to
C. Using a simple ordinary least squares regression approach to investigating the P/E–
profit ability relation, there is no simple and obvious positive effect of ROE on P/E
ratios. These results are perhaps surprising because it is commonly perceived that
Performance and Strategy in Competitive Markets 369