Rate of Return Analysis under Inflation
11.26
0 1 2345678
Income Statement
Revenue $22,000 $22,000 $22,000 $22,000 $22,000 $22,000 $22,000 $22,000
Expenses:
O&M 9,500$ 9,500$ 9,500$ 9,500$ 9,500$ 9,500$ 9,500$ 9,500$
Depreciation 8,860$ 15,184$ 10,844$ 7,744$ 5,537$ 5,530$ 5,537$ 2,765$
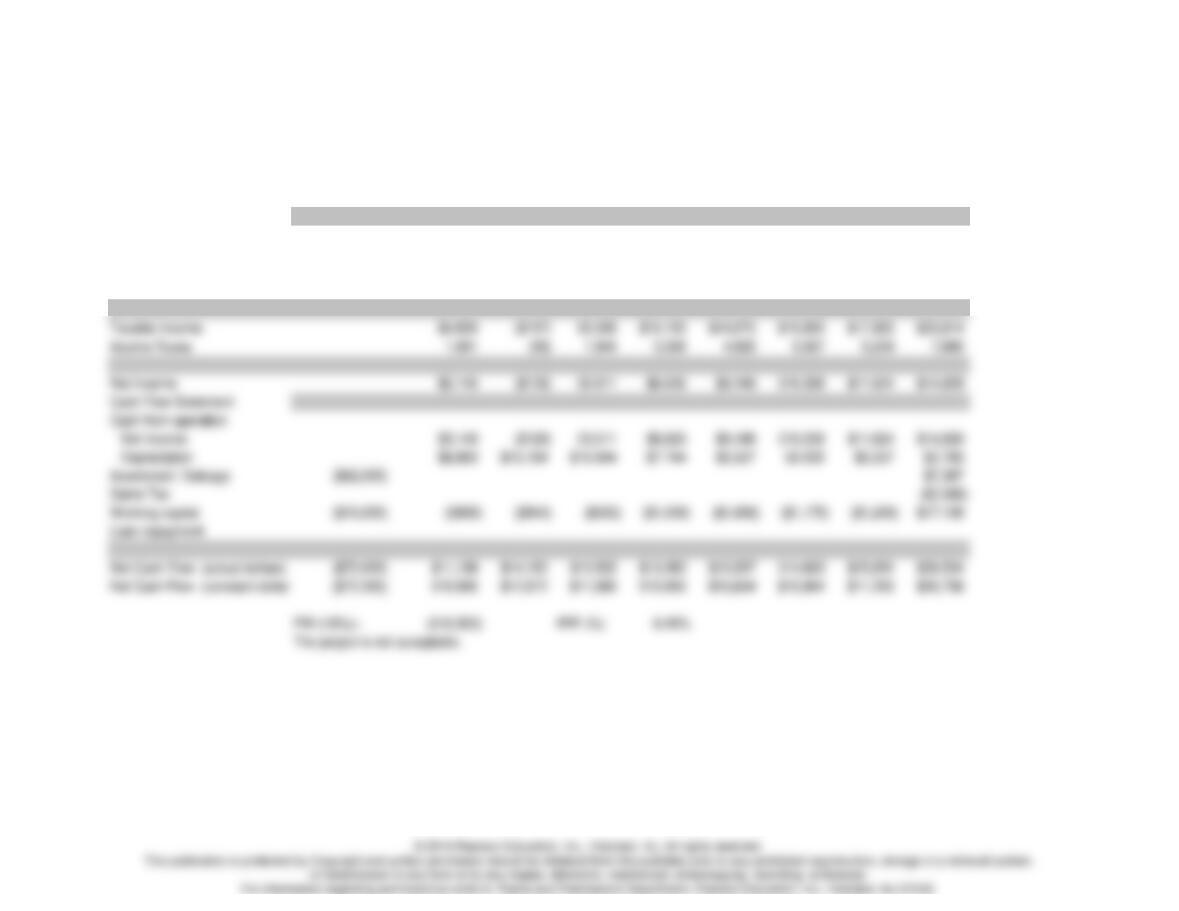
(b) Project’s IRR with inflation
Income Statement
0 1 2345678
Income Statement
Revenue $23,760 $25,661 $27,714 $29,931 $32,325 $34,911 $37,704 $40,720
Expenses:
O&M 10,070 10,674 11,315 11,994 12,713 13,476 14,284 15,142
Depreciation 8,860 15,184 10,844 7,744 5,537 5,530 5,537 2,765
11.27
Income Statement
0 1 2 3 4 5 6
Income Statement
Revenue $35,000 $38,000 $55,000 $60,000 $70,000 $60,000
Expenses:
O&M $16,000 $21,000 $23,000 $32,000 $33,000 $33,000
Rent 5% $10,080 $10,584 $11,113 $11,669 $12,252 $12,865
Depreciation $11,000 $17,600 $10,560 $6,336 $6,336 $3,168
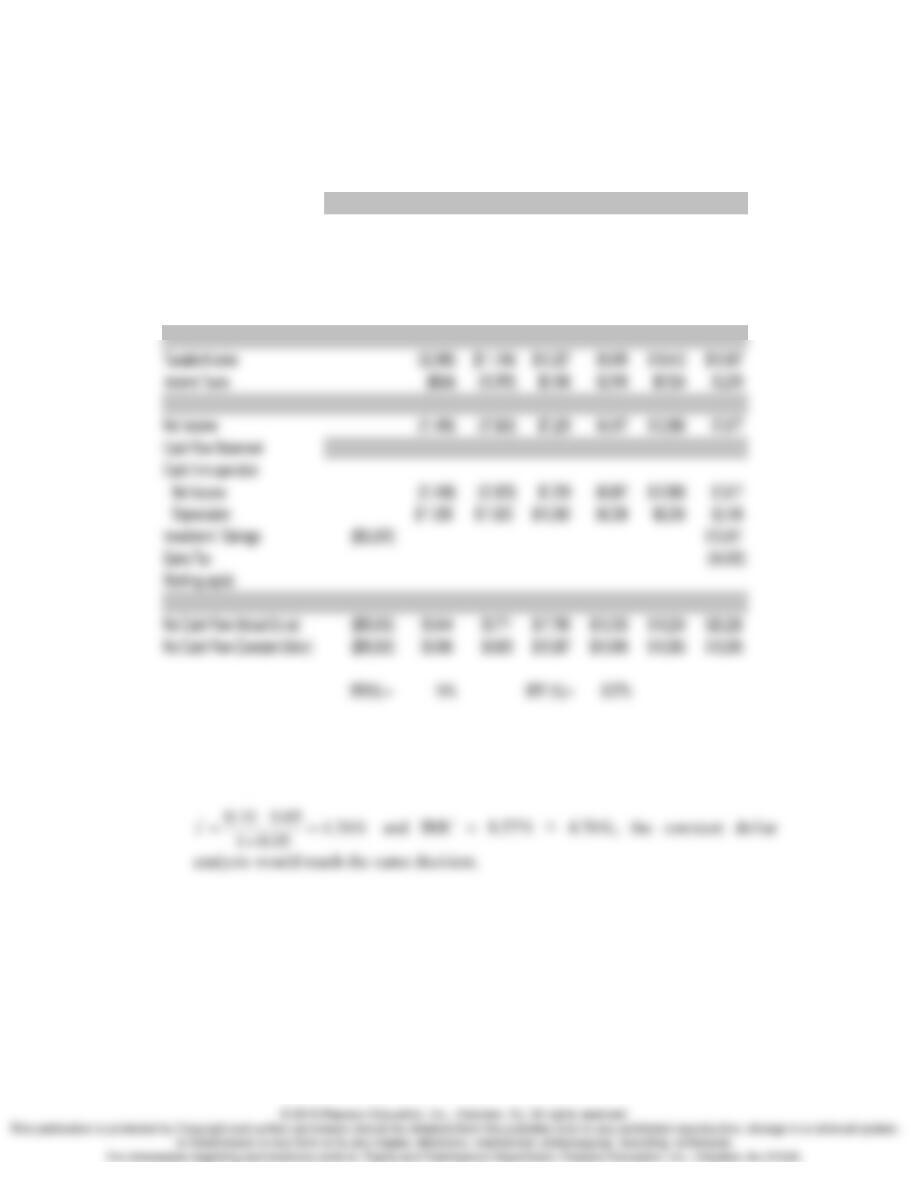
Since MARR (inflation–adjusted) = 10%, and IRR = 14% > 10%, accept the
investment. We can calculate the MARR (inflation–free) as
11.28
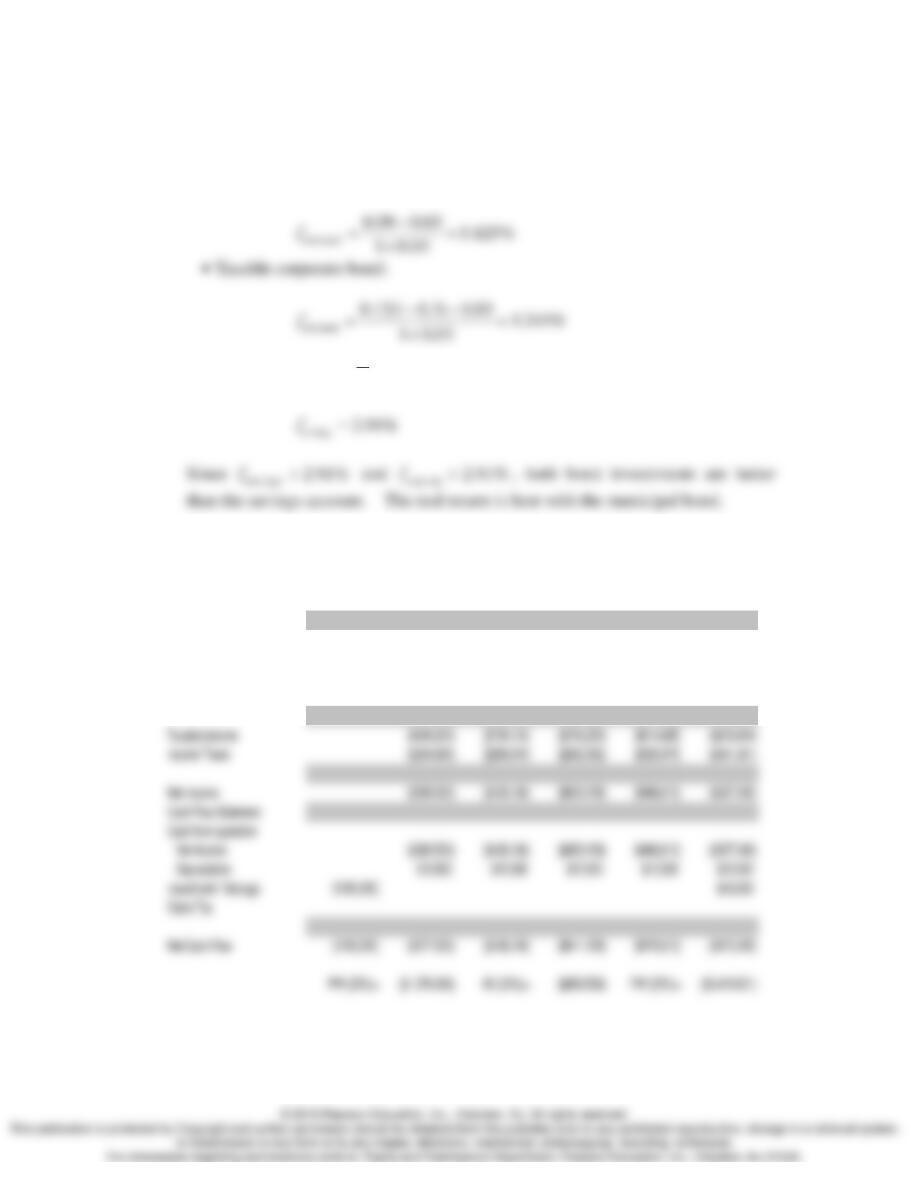
(a) Real after-tax yield on bond investment:
• Nontaxable municipal bond:
(b) Given i = 6%, and
f
= 3%
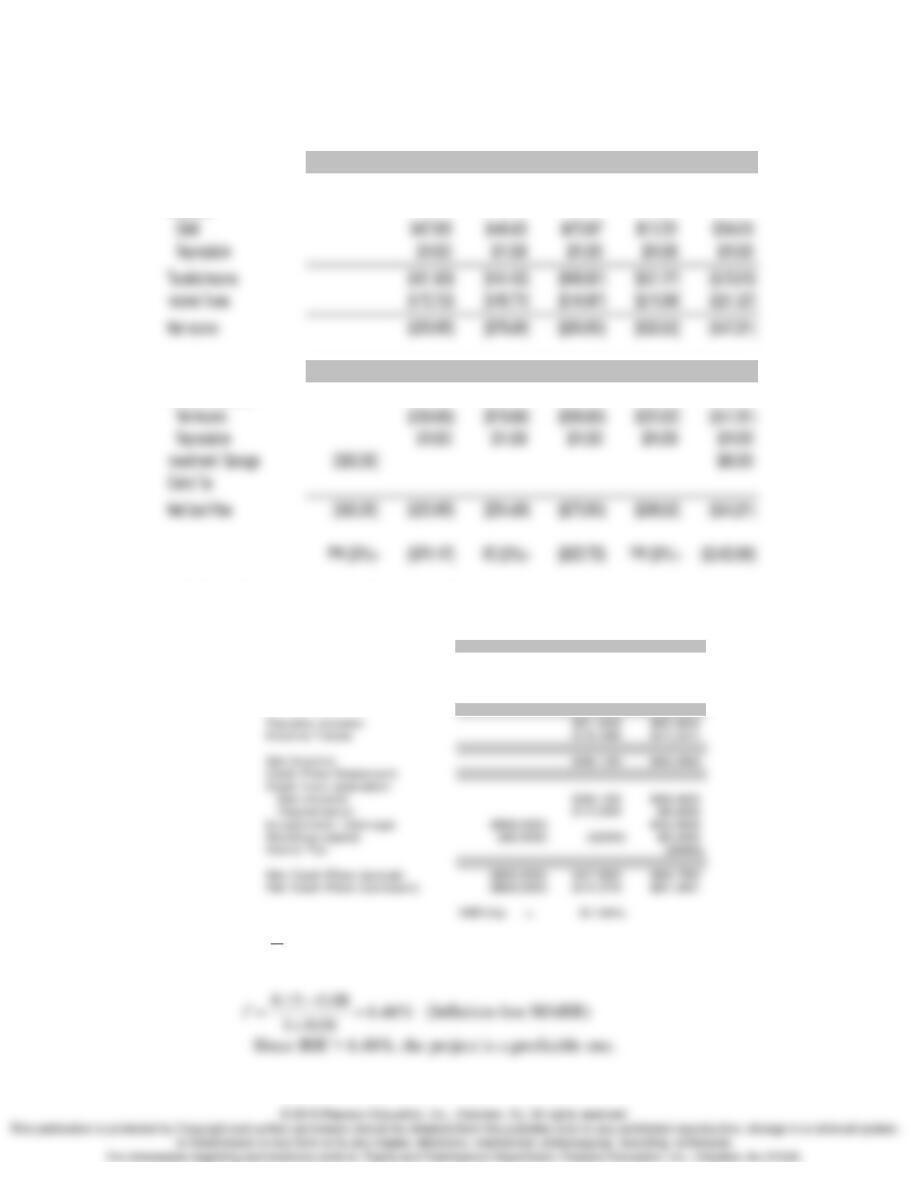
11.29 (a), (b), and (c) – Select Engine B.
Engine A
012345
Income Statement
Revenue
Expenses:
O&M $637,200 $688,176 $743,230 $802,688 $866,904
Depreciation $12,000 $12,000 $12,000 $12,000 $12,000
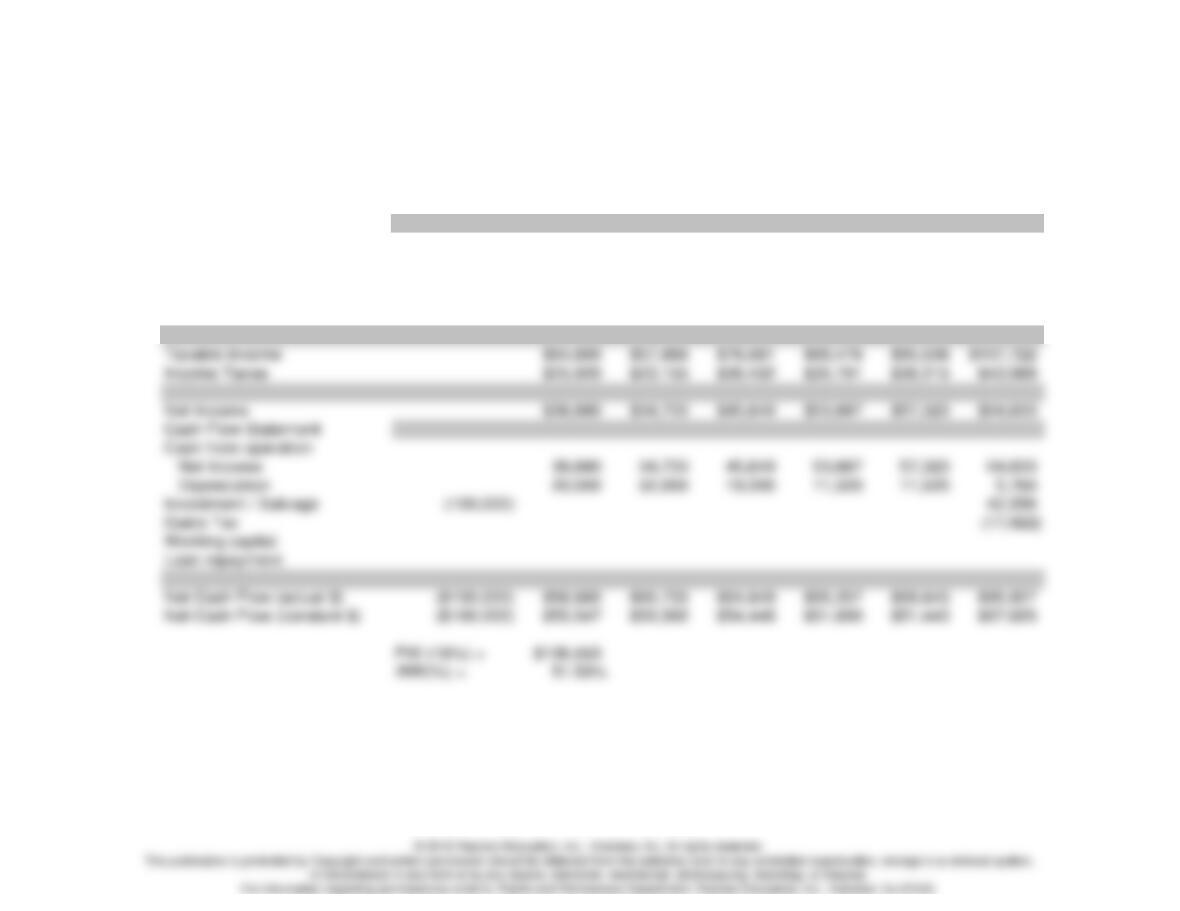
Engine B
012345
Income Statement
Revenue
Expenses:
Cash Flow Statement
Cash from operation
11.30 (a) & (b) Actual and constant dollar analysis:
0 1 2
Income Statement
Revenue $126,000 $132,300
Expenses:
O&M $62,400 $64,896
Depreciation $12,000 $9,600
(c) Given
8%, 15%fi= =
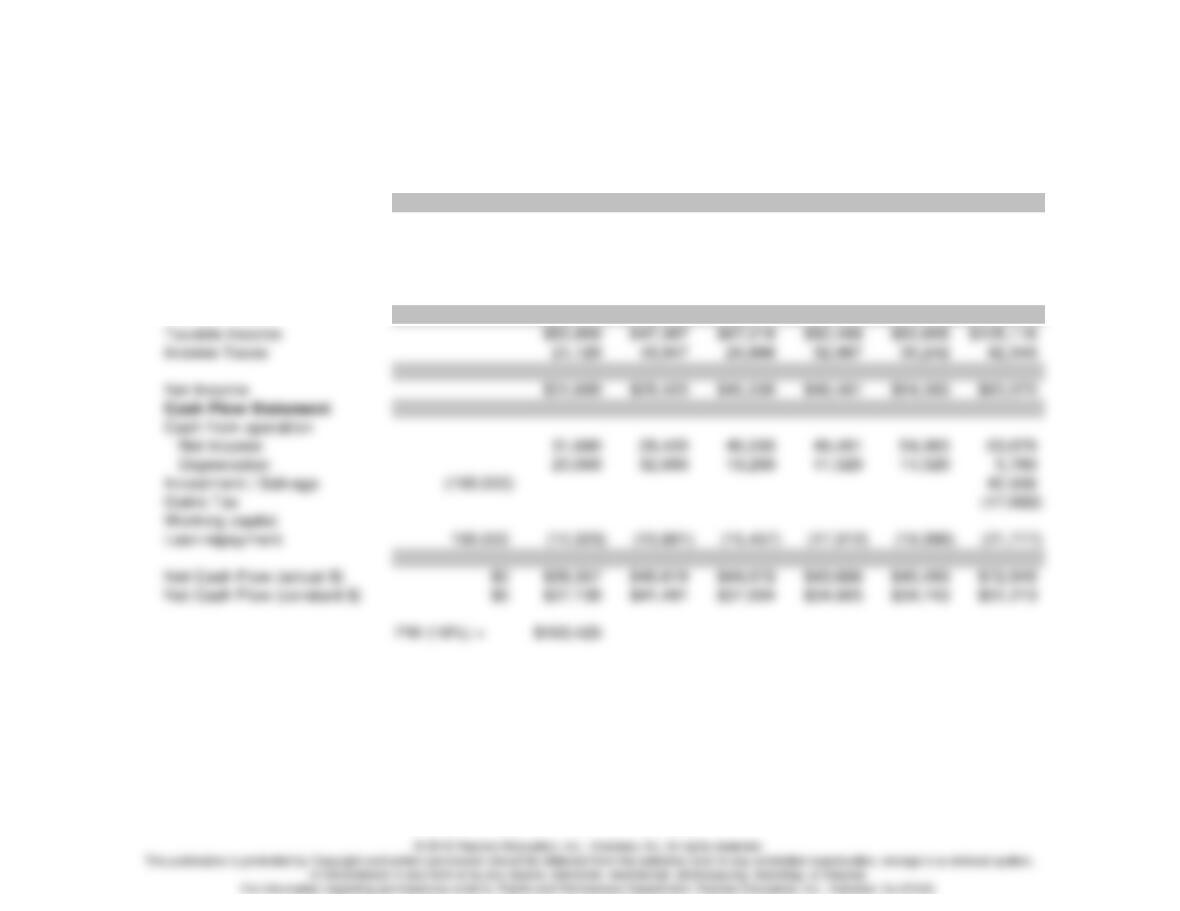
11.31 (a) & (b) Project cash flows in actual and constant dollars:
0 1 23456
Income Statement
Revenue $84,800 $89,888 $95,281 $100,998 $107,058 $113,482
Expenses:
O&M
Depreciation 20,000 32,000 19,200 11,520 11,520 5,760
Interest
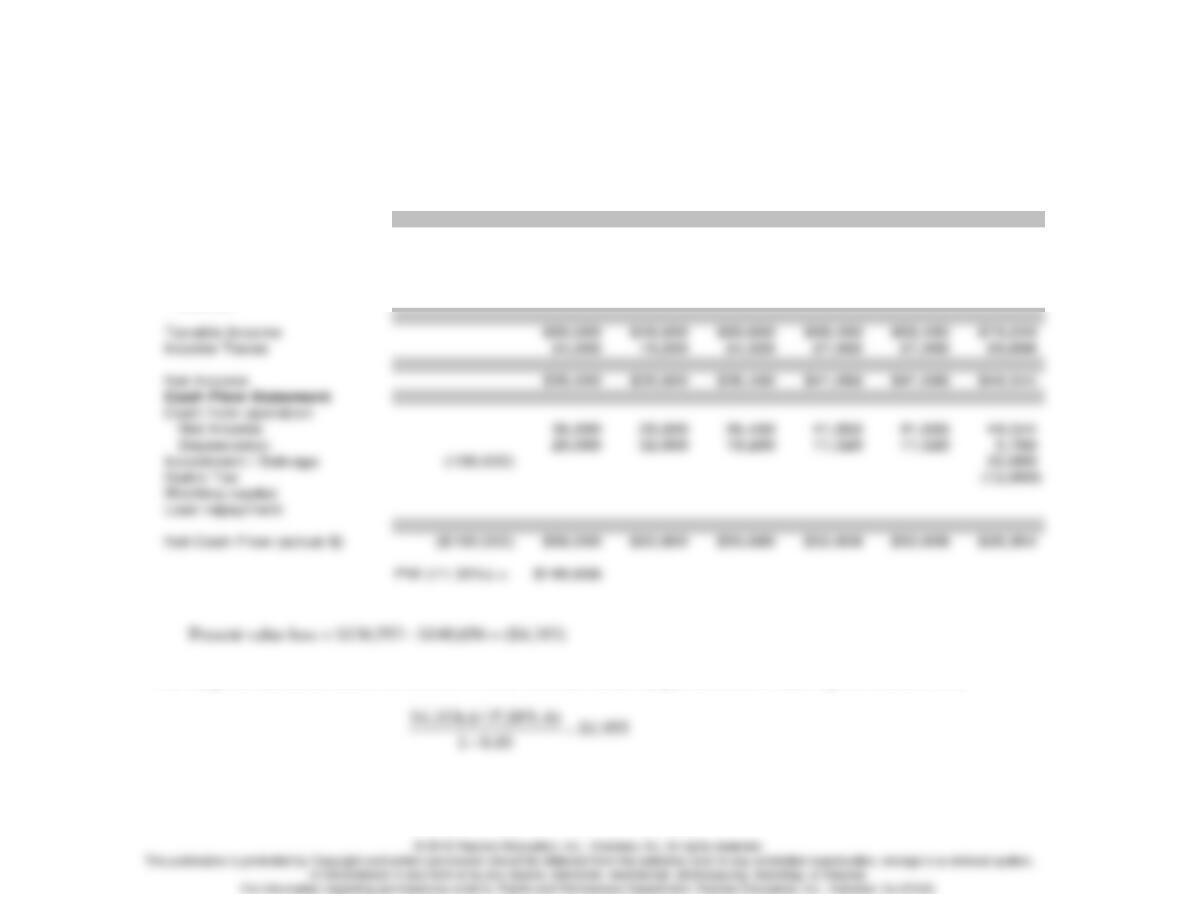
(c) The effects of project financing under inflation:
0 1 23456
Income Statement
Revenue $84,800 $89,888 $95,281 $100,998 $107,058 $113,482
Expenses:
O&M
Depreciation 20,000 32,000 19,200 11,520 11,520 5,760
Interest 12,000 10,521 8,865 7,010 4,933 2,606
Cash Flow Statement
(d)
The present value loss due to inflation:
0 1 2 3 4 5 6
Income Statement
Revenue $80,000 $80,000 $80,000 $80,000 $80,000 $80,000
Expenses:
O&M
Depreciation 20,000 32,000 19,200 11,520 11,520 5,760
Interest
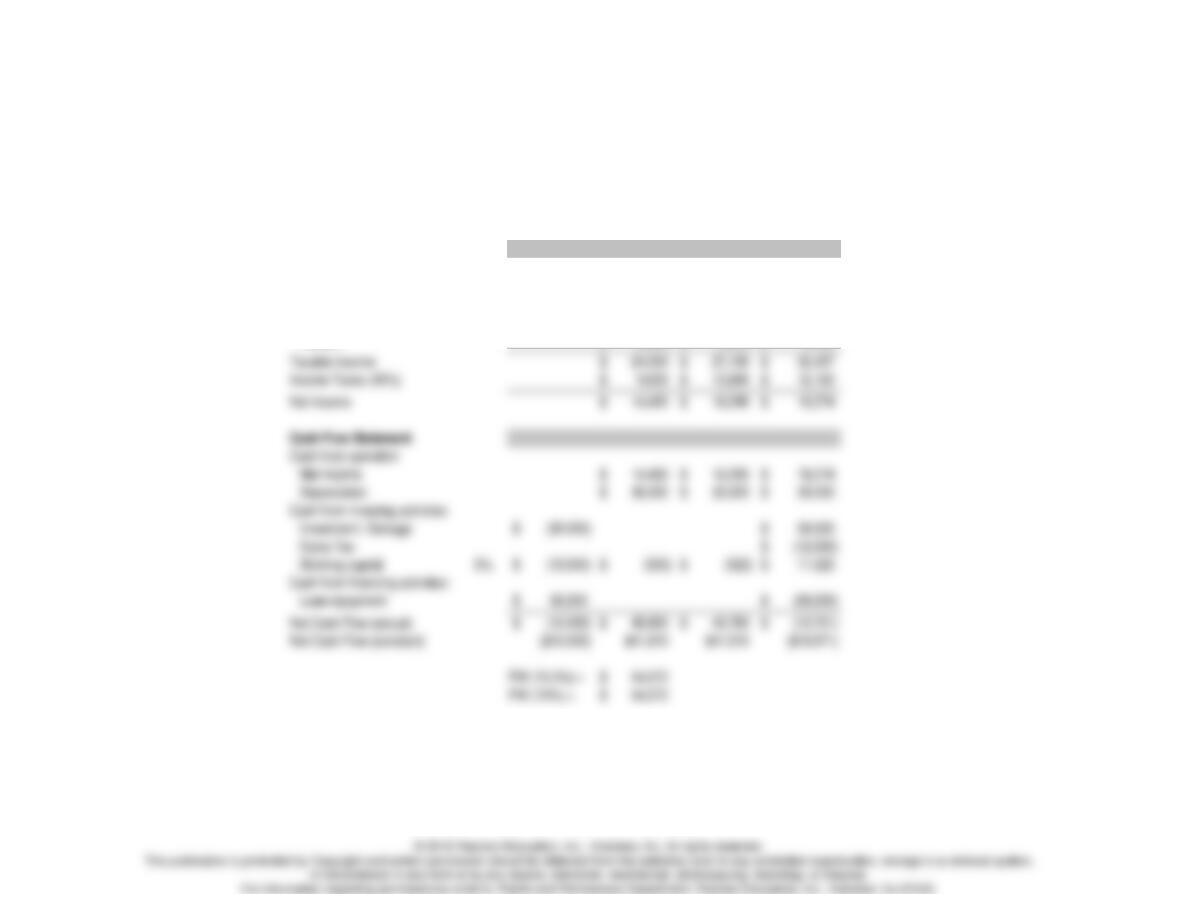
(e) Required additional before-tax annual revenue in actual dollars (equal amount) to make-up the inflation loss.
Short Case Studies
ST 11.1
Income Statement inflation
Revenue (Labor Savings) 5% 84,000$ 88,200$ 92,610$
Expenses:
O&M 21,000$ 22,050$ 23,153$
Depreciation 30,000$ 30,000$ 30,000$
Interest 9,000$ 9,000$ 9,000$
ST.11.2
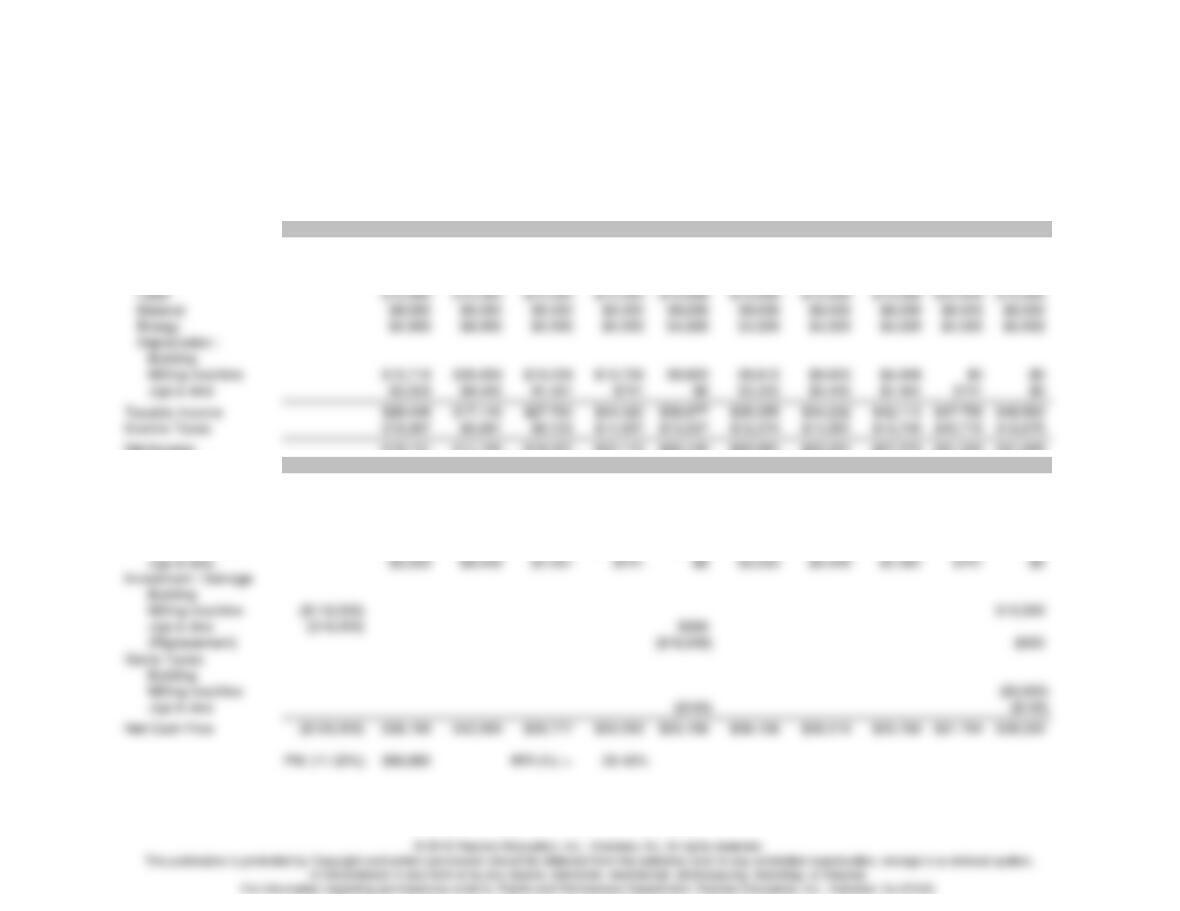
(a) & (b) The project cash flows and IRR with no inflation:
Income Statement 0 1 2 3 4 5 6 7 8 9 10
Revenue $80,000 $80,000 $80,000 $80,000 $80,000 $80,000 $80,000 $80,000 $80,000 $80,000
Expenses:
O&M $3,000 $3,000 $3,000 $3,000 $3,000 $3,000 $3,000 $3,000 $3,000 $3,000
Net Income $19,141 $11,125 $18,057 $22,113 $25,140 $22,981 $22,251 $27,373 $31,043 $31,525
Cash Flow Statement
Cash from operation
Net Income $19,141 $11,125 $18,057 $22,113 $25,140 $22,981 $22,251 $27,373 $31,043 $31,525
Depreciation
Building
Milling machine $15,719 $26,939 $19,239 $13,739 $9,823 $9,812 $9,823 $4,906 $0 $0
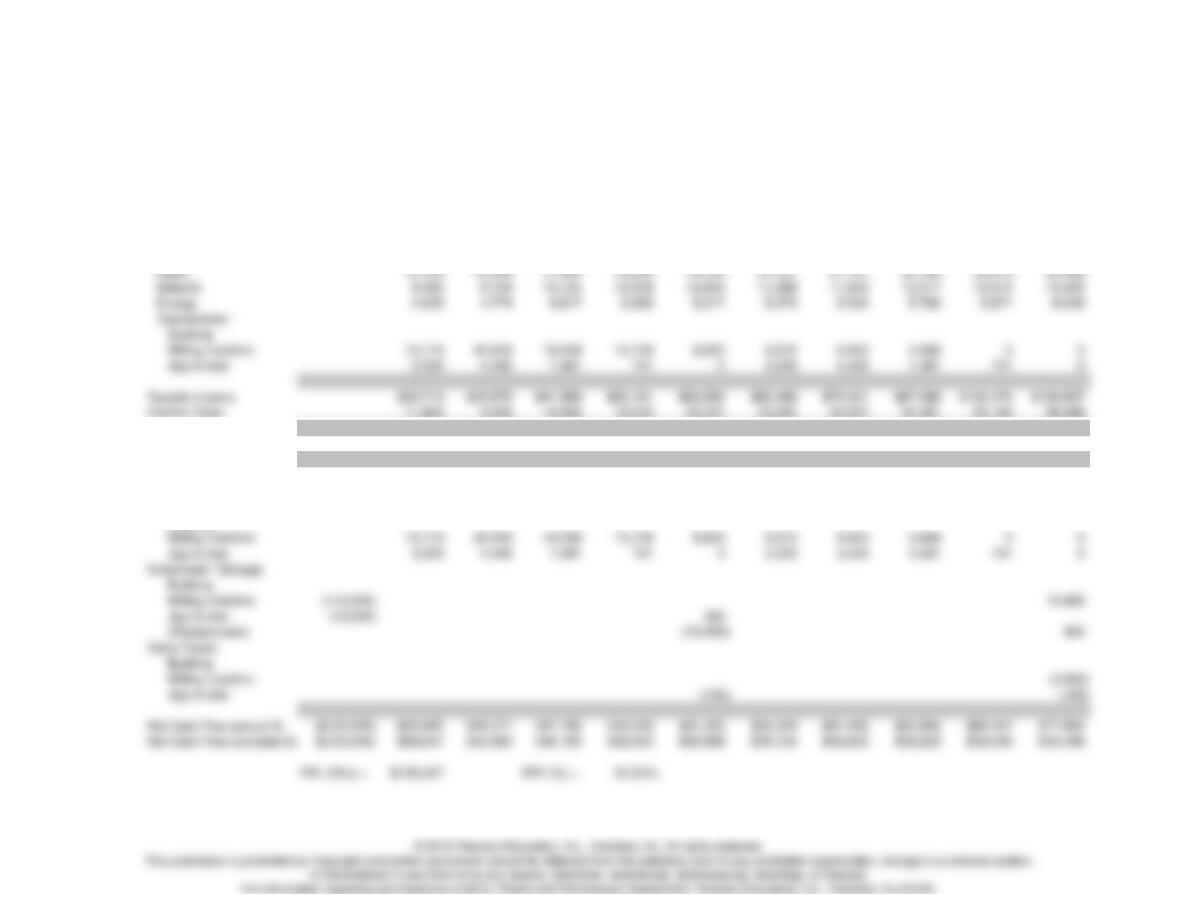
(c), (d) & (e): The economic gain in present worth due to inflation = $108,404 – $90,988 = $17,416.
0 1 2 3 4 5 6 7 8 9 10
Revenue $85,600 $91,592 $98,003 $104,864 $112,204 $120,058 $128,463 $137,455 $147,077 $157,372
Expenses:
O&M 3,090 3,183 3,278 3,377 3,478 3,582 3,690 3,800 3,914 4,032
Net Income $21,913 $16,887 $27,040 $34,568 $41,335 $43,204 $46,814 $56,607 $65,306 $71,199
Cash Flow Statement
Cash from operation
Net Income 21,913 16,887 27,040 34,568 41,335 43,204 46,814 56,607 65,306 71,199
Depreciation
Building
ST.11.3
(a) Assumption: The building will be placed in service in January.
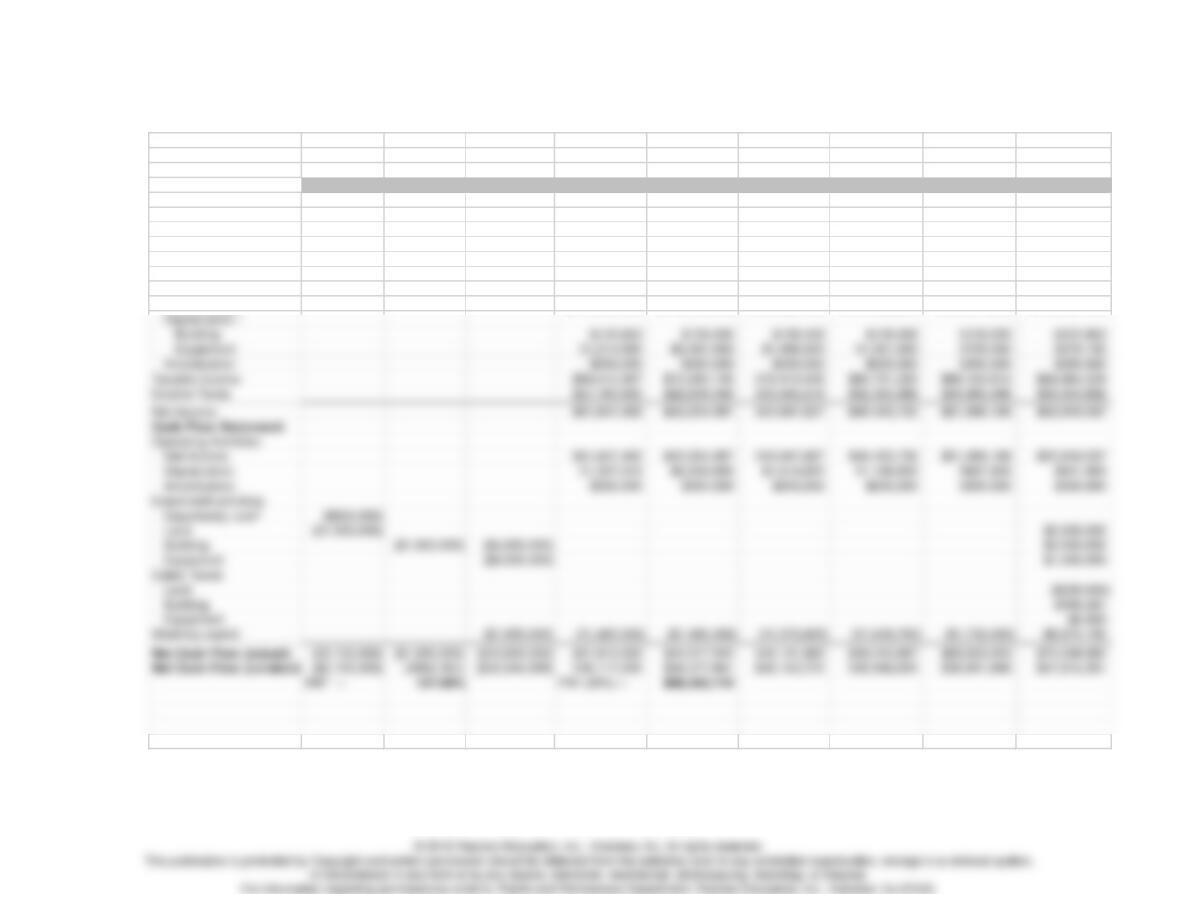
.
Income Statement 2014 2015 2016 2017 2018 2019 2020 2021 2022
-2 -1 0 1 2 3 4 5 6
Revenues:
Sales unit 2,000 2,000 2,000 2,000 2,000 2,000
Unit price $95,000 $99,750 $104,738 $109,974 $115,473 $121,247
Sales volume $190,000,000 $199,500,000 $209,476,000 $219,948,000 $230,946,000 $242,494,000
Expenses:
Fixed costs $5,000,000 $5,250,000 $5,512,500 $5,788,125 $6,077,531 $6,381,408
Variable costs $114,000,000 $119,700,000 $125,685,600 $131,968,800 $138,567,600 $145,496,400