
S-147
interactive activity
Chapter 11
Income and
Expenditure
1. Due to an increase in consumer wealth, there is a $40 billion autonomous
increase in consumer spending in the economies of Westlandia and Eastlandia.
and 0.75 in Eastlandia. What do your results indicate about the relationship
between the size of the marginal propensity to consume and the multiplier?
Westlandia
Rounds
Incremental
change
in GDP
Total
change
in GDP
1DC =$40 billion ?
. . . . . . . . .
Total
change
in GDP
(1/(1 – MPC)) ë DC = ?
Eastlandia
Rounds
Incremental
change
in GDP
Total
change
in GDP
1DC =$40 billion ?
2MPC × DC =? ?
. . . . . . . . .
Total
change
(1/(1 – MPC)) ë DC = ?

1. The accompanying tables clearly show that the larger the marginal propensity to
consume, the larger the size of the multiplier. In Westlandia, with the marginal
propensity to consume of 0.5, the multiplier equals 2. In Eastlandia, with the
marginal propensity to consume of 0.75, the multiplier equals 4.
Westlandia
Rounds
Incremental
change
in GDP
Total change
in GDP
1DC =$40 billion $40 billion
. . . . . . . . .
Total
change
in GDP
(1/(1 – MPC)) ë DC = (1/(1 – 0.5)) ë $40 billion = $80 billion
Eastlandia
Rounds
Incremental
change
in GDP
Total change
in GDP
1DC = $40 billion $40 billion
. . . . . . . . .
Total
change
in GDP
(1/(1 – MPC)) ë DC = (1/(1 – 0.75)) ë $40 billion = $160 billion
2. Assuming that the aggregate price level is constant, the interest rate is fixed, and
there are no taxes and no foreign trade, what will be the change in GDP if the
following events occur?
Solution

Chapter 11 Income and expendIture S-149
b. If firms reduce investment spending by $40 billion and the marginal
propensity to consume is 0.8, GDP will fall by $200 billion:
Total change in GDP = (1/(1 − MPC)) × DI
c. If government purchases of goods and services rise by $60 billion and the
marginal propensity to consume is 0.6, GDP will increase by $150 billion:
Total change in GDP = (1/(1 − MPC)) × DG
3. Economists observed the only five residents of a very small economy and esti-
mated each one’s consumer spending at various levels of current disposable
income. The accompanying table shows each resident’s consumer spending at
three income levels.
Individual consumer
spending by
Individual
current disposable income
$0 $20,000 $40,000
Andre $1,000 $15,000 $29,000
a. What is each resident’s consumption function? What is the marginal propen–
sity to consume for each resident?
b. What is the economy’s aggregate consumption function? What is the marginal
propensity to consume for the economy?
3. a. Each resident’s consumption function and marginal propensity to consume are
given in the table below. To determine autonomous consumer spending for each
resident (the vertical intercept of his or her consumption function), we can look
at each one’s consumer spending when disposable income is zero. To calculate
each resident’s marginal propensity to consume (the slope of his or her con–
sumption function), we can calculate the change in consumer spending when
there is a change in disposable income. For example, Andre’s marginal propen–
sity to consume is equal to ($29,000 − $15,000)/($40,000 − $20,000) = 0.70.
Autonomous
consumption (a)
Marginal propensity
to consume (MPC)
Consumption
function (c)
Andre $1,000 0.70 $1,000 + 0.70 × yd
Solution

S-150 Chapter 11 Income and expendIture
b. To find the economy’s consumption function, we calculate aggregate consumer
spending at each level of aggregate disposable income:
• Wheneachresidentearns$0indisposableincome,aggregateconsumer
4. From 2009 to 2014, Eastlandia experienced large fluctuations in both aggregate
consumer spending and disposable income, but wealth, the interest rate, and
expected future disposable income did not change. The accompanying table
shows the level of aggregate consumer spending and disposable income in mil-
lions of dollars for each of these years. Use this information to answer the fol-
lowing questions.
Year
Disposable income
(millions of dollars)
Consumer spending
(millions of dollars)
2009 $100 $180
a. Plot the aggregate consumption function for Eastlandia.
b. What is the marginal propensity to consume? What is the marginal propensity
to save?
c. What is the aggregate consumption function?
4. a. The accompanying diagram shows the aggregate consumption function for
Eastlandia.
$100 2000 300 400 500
600
$600
500
100
Consumer spending
(millions of dollars)
Disposable income
(millions of dollars)
CF
Solution

Chapter 11 Income and expendIture S-151
b. The marginal propensity to consume is determined by taking the change
in consumer spending divided by the change in disposable income over any
two-year period. From 2009 to 2010, consumer spending increased from $180
c. The aggregate consumption function is of the form C = A + MPC × YD. We know
MPC = 0.8, so we must now solve for A. Rearranging, we have A = C − MPC × YD.
Plugging in the data from the first row of the table, we have A = $180 million −
5. The Bureau of Economic Analysis reported that, in real terms, overall consumer
spending increased by $345.8 billion in 2015.
a. If the marginal propensity to consume is 0.50, by how much will real GDP
change in response?
b. If there are no other changes to autonomous spending other than the increase
in consumer spending in part a, and unplanned inventory investment,
IUnplanned, decreased by $100 billion, what is the change in real GDP?
5. a. Real GDP increases as a result of this change in consumer spending by
(1/(1 − 0.50)) × $345.8 billion = $691.6 billion.
b. If, in addition to the consumer spending change in part a, unplanned inven-
6. During the early 2000s, the Case–Shiller U.S. Home Price Index, a measure of
average home prices, rose continuously until it peaked in March 2006. From
March 2006 to May 2009, the index lost 32% of its value. Meanwhile, the stock
market experienced similar ups and downs. From March 2003 to October 2007,
Solution

S-152 Chapter 11 Income and expendIture
7. How will planned investment spending change as the following events occur?
8. Explain how each of the following actions will affect the level of planned invest-
ment spending and unplanned inventory investment. Assume the economy is
9. In an economy with no government and no foreign sectors, autonomous con–
sumer spending is $250 billion, planned investment spending is $350 billion, and
the marginal propensity to consume is 2
/
3.
a. Plot the aggregate consumption function and planned aggregate spending.
b. What is unplanned inventory investment when real GDP equals $600 billion?
c. What is Y*, income–expenditure equilibrium GDP?
d. What is the value of the multiplier?
e. If planned investment spending rises to $450 billion, what will be the new Y*?
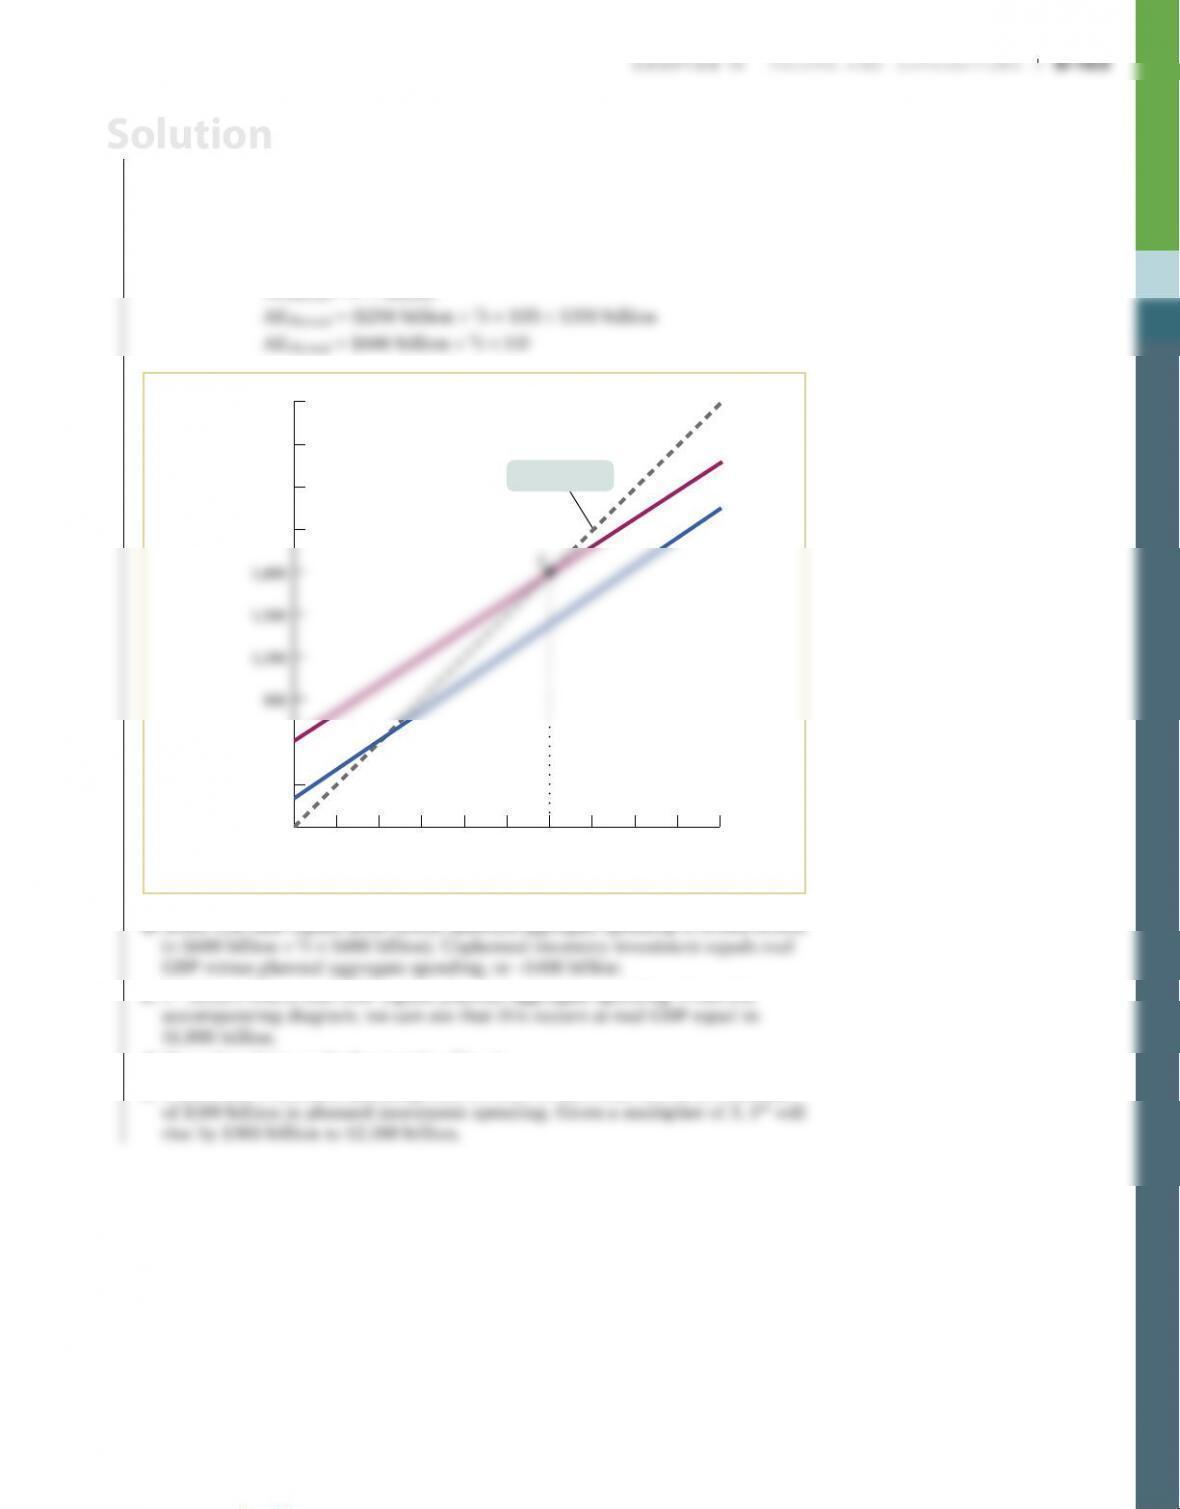
9. a. If autonomous consumer spending is $250 billion and the marginal propensity
to consume is 2
/
3, the aggregate consumption function is:
C = $250 billion + 2
/
3 × YD
Planned aggregate spending equals consumer spending plus planned invest-
ment spending:
AEPlanned = C + IPlanned
3,0002,4001,8001,200600 2,7002,100900
CF
AEPlanned
$300 1,500
0
250
$3,000
2,700
2,400
2,100
600
300
AE
Planned
,
consumer
spending
(billions
of
dollars)
Real GDP (billions of dollars)
45-degree line
b. When real GDP equals $600 billion, planned aggregate spending is $1,000 billion
c. Y* occurs where real GDP equals planned aggregate spending. From the
d. The value of the multiplier is 1/(1 − 2
/
3) = 3.
e. If planned investment spending rises to $450 billion, that will be an increase
Solution

10. An economy has a marginal propensity to consume of 0.5, and Y*, income–
expenditure equilibrium GDP, equals $500 billion. Given an autonomous
increase in planned investment of $10 billion, show the rounds of increased
spending that take place by completing the accompanying table. The first and
second rows are filled in for you. In the first row, the increase of planned invest-
ment spending of $10 billion raises real GDP and YD by $10 billion, leading to
an increase in consumer spending of $5 billion (MPC × change in disposable
income) in row 2, raising real GDP and YD by a further $5 billion.
Rounds
Change in
IPlanned or C
Change in
real GDP
Change in
YD
(billions of dollars)
1DIPlanned = $10.00 $10.00 $10.00
2DC = $5.00 $5.00 $5.00
3DC = ? ??
4DC = ? ??
5DC = ? ??
6DC = ? ??
7DC = ? ??
8DC = ? ??
9DC = ? ??
10 DC = ? ??
a. What is the total change in real GDP after the 10 rounds? What is the value of
the multiplier? What would you expect the total change in Y* to be based on
the multiplier formula? How do your answers to the first and third questions
compare?
10. a. The total change in GDP after the 10 rounds is $19.98 billion, obtained by add–
ing up the change in GDP for each of the first 10 rounds. The multiplier is
1/(1 − 0.5) = 2. We would expect the total change in Y* to be twice the change in
planned investment spending. Since the autonomous change in planned invest–
ment spending was $10 billion, we would expect a change in Y* of $20 billion.
This is very similar to the change in GDP after 10 rounds ($19.98 billion).
Rounds
Change in
IPlanned or C
Change in
real GDP
Change in
YD
(billions of dollars)
1DIPlanned = $10.00 $10.00 $10.00
2DC = 5.00 5.00 5.00
3DC = 2.50 2.50 2.50
4DC = 1.25 1.25 1.25
Solution

Chapter 11 Income and expendIture S-155
b. The total change in GDP after 10 rounds is $37.74 billion, obtained by add-
ing up the change in GDP for each of the first 10 rounds. The value of the
multiplier is 4. As the marginal propensity to consume increases, so does the
value of the multiplier.
Rounds
Change in
IPlanned or C
Change in
real GDP
Change in
YD
(billions of dollars)
1DIPlanned = $10.00 $10.00 $10.00
2DC = 7.50 7.50 7.50
3DC = 5.63 5.63 5.63
4DC = 4.22 4.22 4.22
11. Although the United States is one of the richest nations in the world, it is also
the world’s largest debtor nation. We often hear that the problem is the nation’s
low savings rate. Suppose policy makers attempt to rectify this by encouraging
greater savings in the economy. What effect will their successful attempts have
on real GDP?
12. The U.S. economy slowed significantly in early 2008, and policy makers were
extremely concerned about growth. To boost the economy, Congress passed
several relief packages (the Economic Stimulus Act of 2008 and the American
Recovery and Reinvestment Act of 2009) that combined would deliver about
S-156 Chapter 11 Income and expendIture
12. a. Government spending increases the disposable income of American consum-
ers. The MPC can be used to calculate the effect of government spending on
consumer spending: ΔC = MPC × ΔYD = 0.5 × $700 billion = $350 billion. We
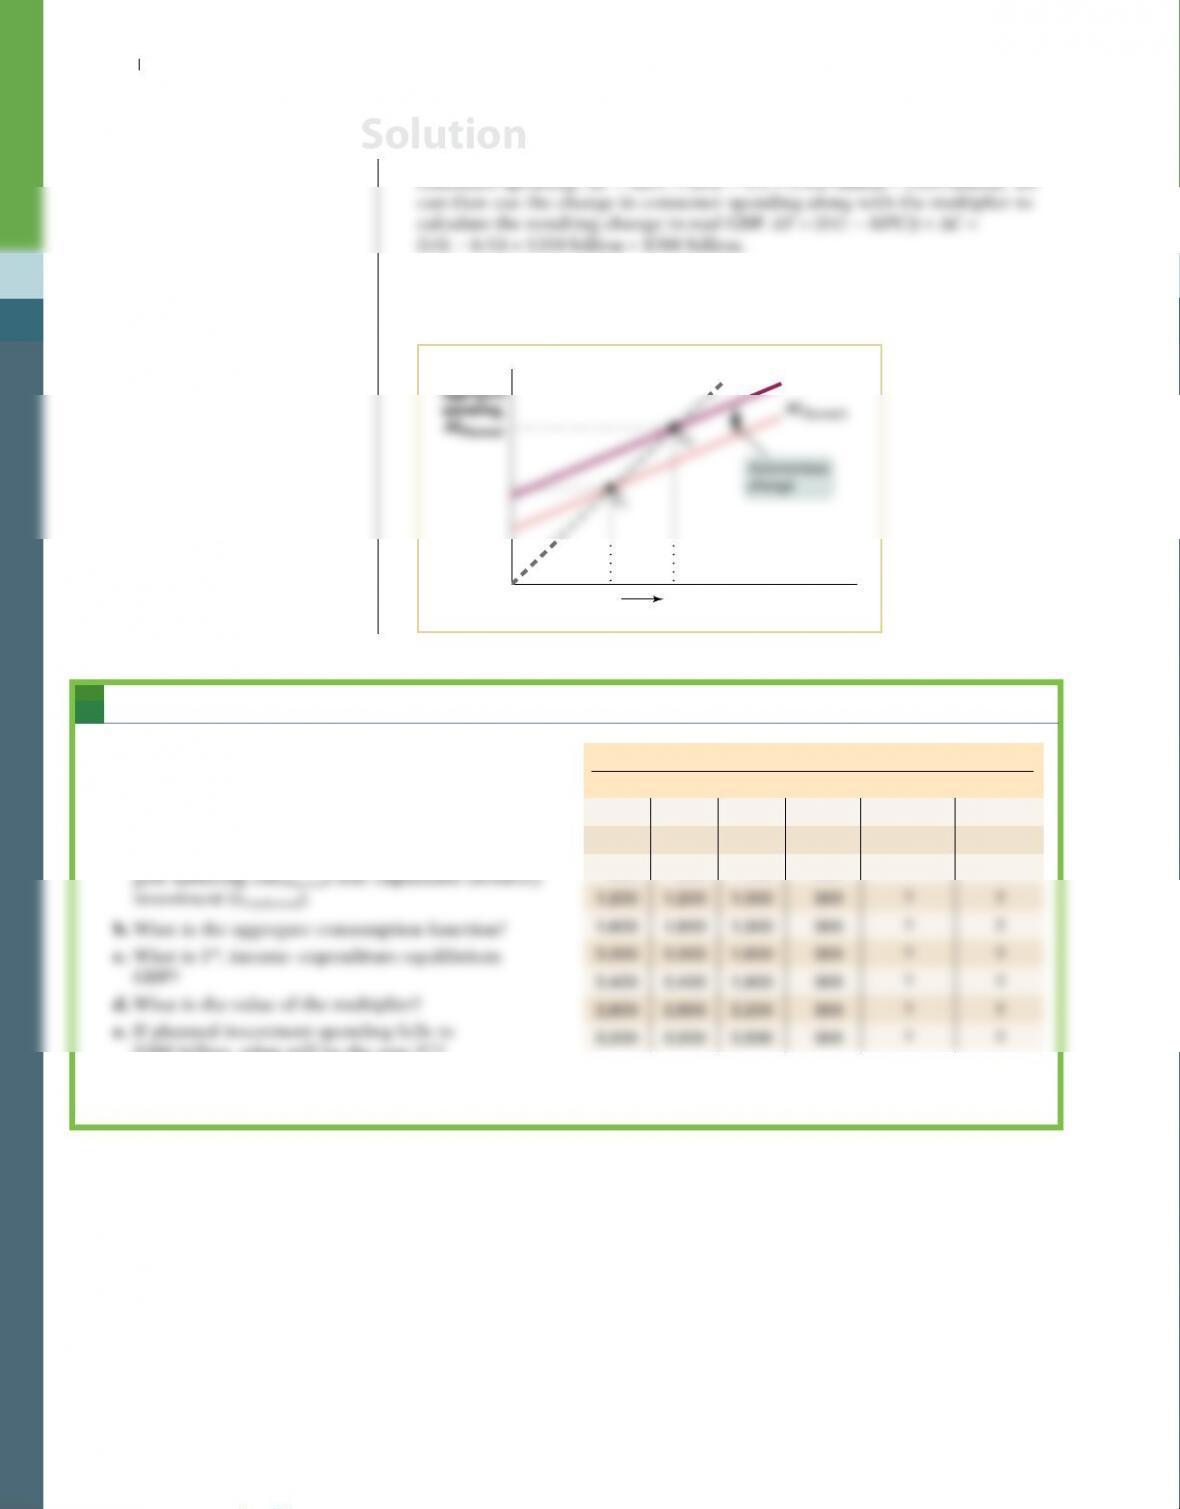
b. As shown in the accompanying diagram, the payments result in an autono–
mous increase in planned aggregate spending. This change results in an
increase in real GDP.
Real GDP
Planned
aggr
egate
Y1Y2
AE
Planned2
Solution
WORK IT OUT Interactive step-by-step help with solving this problem can be found online.
13. a. The accompanying table shows gross domestic
product (GDP), disposable income (YD), consumer
spending (C), and planned investment spend-
ing (IPlanned) in an economy. Assume there is no
government or foreign sector in this economy.
Complete the table by calculating planned aggre–
$200 billion, what will be the new Y*?
f. If autonomous consumer spending rises to
$200 billion, what will be the new Y*?
GDP YD C IPlanned AEPlanned IUnplanned
(billions of dollars)
$0 $0 $100 $300 ? ?
400 400 400 300 ? ?
800 800 700 300 ? ?

13. a. The completed table looks like this:
GDP YD C IPlanned AEPlanned IUnplanned
(billions of dollars)
$0 $0 $100 $300 $400 −$400
400 400 400 300 700 −300
800 800 700 300 1,000 −200
b. We can find the aggregate consumption function by calculating aggregate
autonomous consumer spending and the marginal propensity to consume.
Aggregate autonomous consumer spending equals aggregate consumer spend–
ing when disposable income is zero; in this case, aggregate autonomous con-
c. Y* is the level of GDP at which planned aggregate spending equals GDP. From
the accompanying table, Y* is $1,600 billion.
d. The multiplier equals 1/(1 − MPC); the value of the multiplier is 4 = 1/(1 − 0.75).
e. If planned investment spending falls to $200 billion, the new Y* will equal
$1,200 billion. If planned investment spending equals $200 billion, it has fallen
Solution