11 Chapter model 12/12/2018
NET PRESENT VALUE (Section 11-2)
Table 11.1 Data on Projects S and L
WACC for both projects = 10%
Initial Cost Total
Year 0 1 2 3 4 Inflows
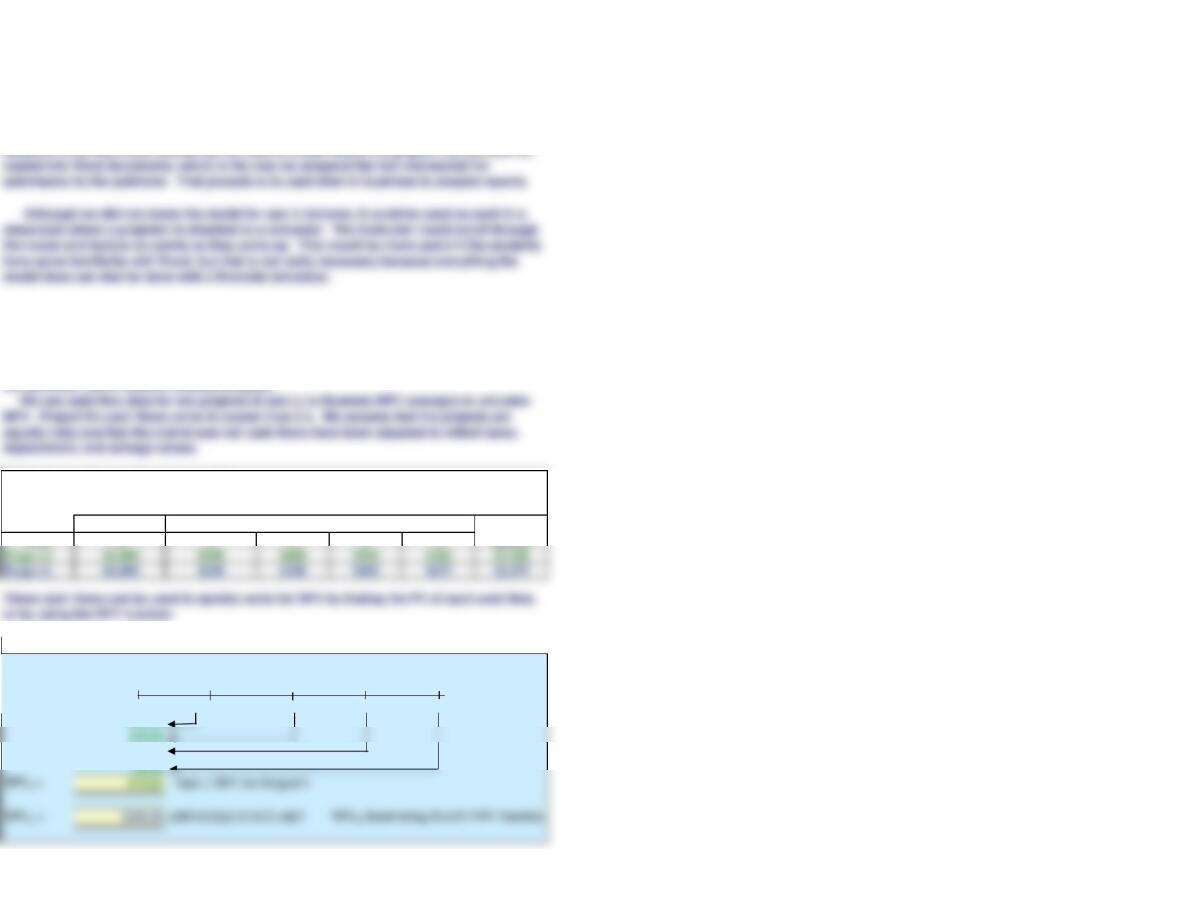
Figure 11.1 Finding the NPV for Projects S and L
0 1 2 3 4
-1,000.00 500 400 300 100
454.55
225.39
9/12/22 4:00 PM
Chapter 11. The Basics of Capital Budgeting
The Net Present Value (NPV) method estimates how much a potential project contributes to
shareholder wealth and is the primary capital budgeting decision criterion. While other
capital budgeting tools are important and provide valuable information, the NPV is clearly
the dominant metric used to evaluate projects.
We used this model to create most of the chapter exhibits (Tables and Figures). We pasted
in a few dialog boxes for specific Excel functions and features and show them off to the
right of where they apply, but in general we encourage students who want to know more
about Excel to use the Excel Tutorial and refer to it as necessary. We also like to let
students know that Excel models can be used to create tables and graphs that can then be
depreciation, and salvage values.
After-Tax, End-of-Year Cash Inflows, CFt
Project S
r = 10%
INTERNAL RATE OF RETURN (Section 11-3)
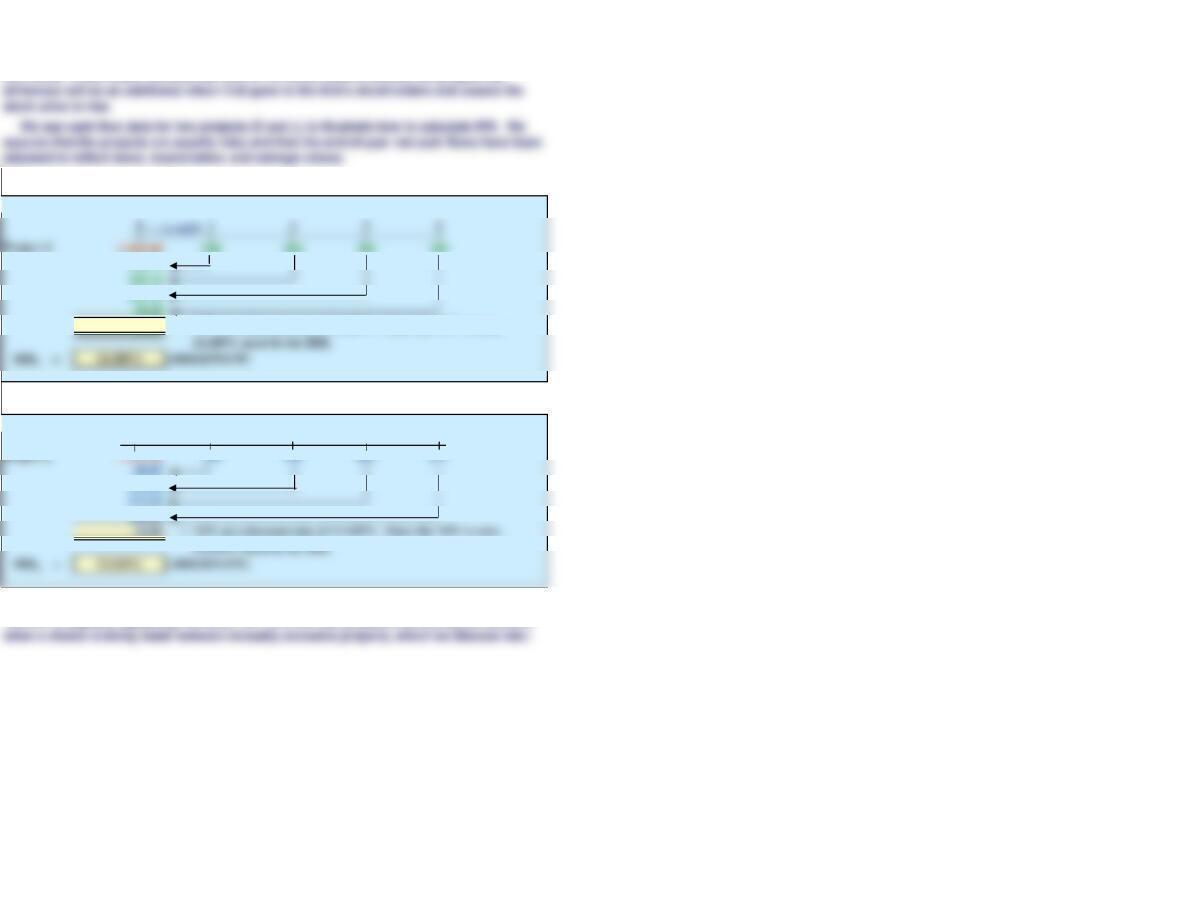
Figure 11.2 Finding the IRR for Project S
436.72
$0.00 = NPV at a discount rate of 14.489%. Since the NPV is zero,
Finding the IRR for Project L
0 1 2 3 4
232.68
The Internal Rate of Return (IRR) is the discount rate that forces a project’s NPV to equal
zero. The IRR is an estimate of the project’s rate of return, and it is comparable to the YTM
on a bond. If this return exceeds the cost of the funds used to finance the project, the
The IRR is logically appealing; however, NPV and IRR can produce conflicting conclusions
r = 13.549%
MULTIPLE IRRs (Section 11-4)
Multiple IRRs: NPV profile and IRR calculation
WACC 10%
Project M
Year (t) CFs
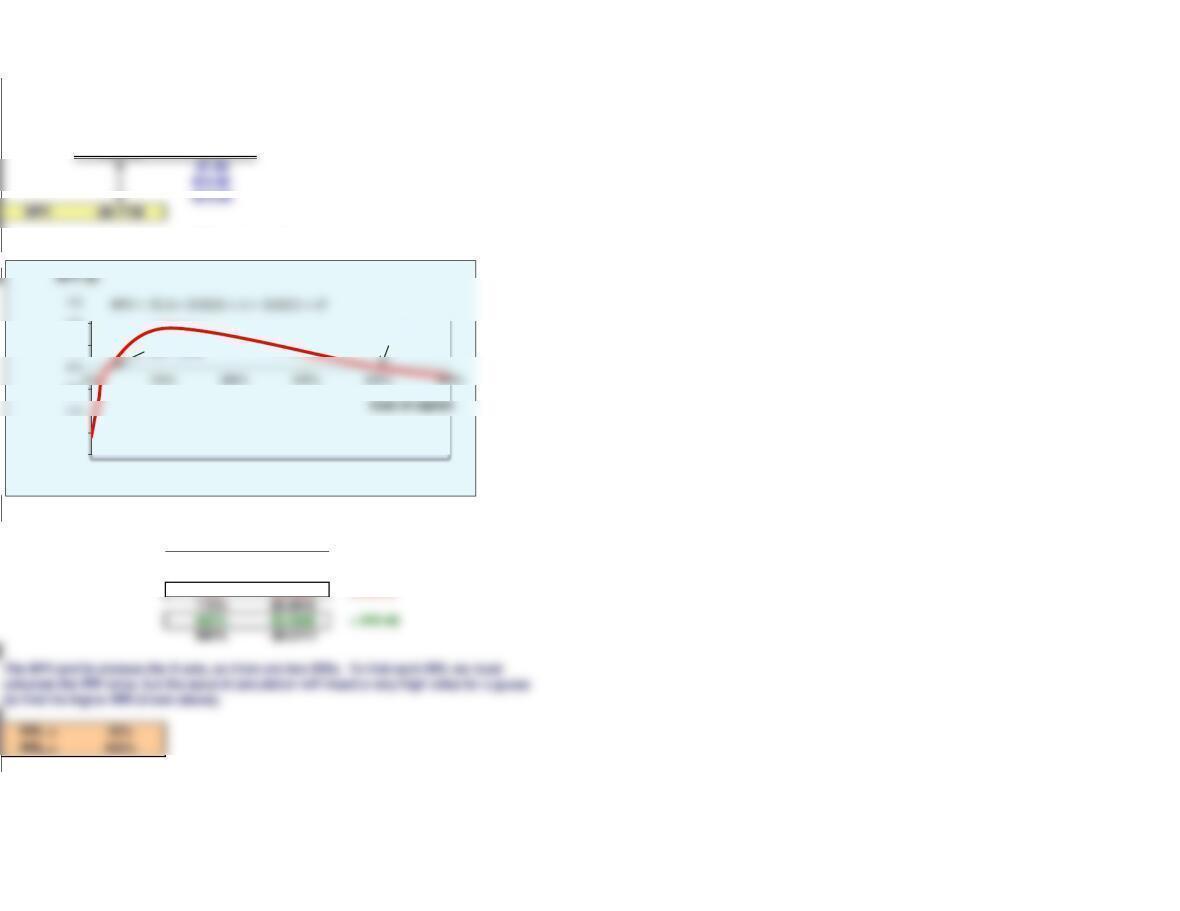
Figure 11.3 Graph for Multiple IRRs: Project M
WACC = 10%
Discount
Rate
NPV
0% -$1.6000
10% -$0.7736
25% $0.0000 = IRR #1
If a project has nonnormal cash flows (more than one sign change), the project may have
multiple IRRs. Consider Project M below, which has nonnormal cash flows. Construct an
NPV profile for Project M and determine its IRRs.
-2.0
-1.5
-0.5
0.5
1.0
IRR = 400%
IRR = 25%
MODIFIED IRR (Section 11-6)
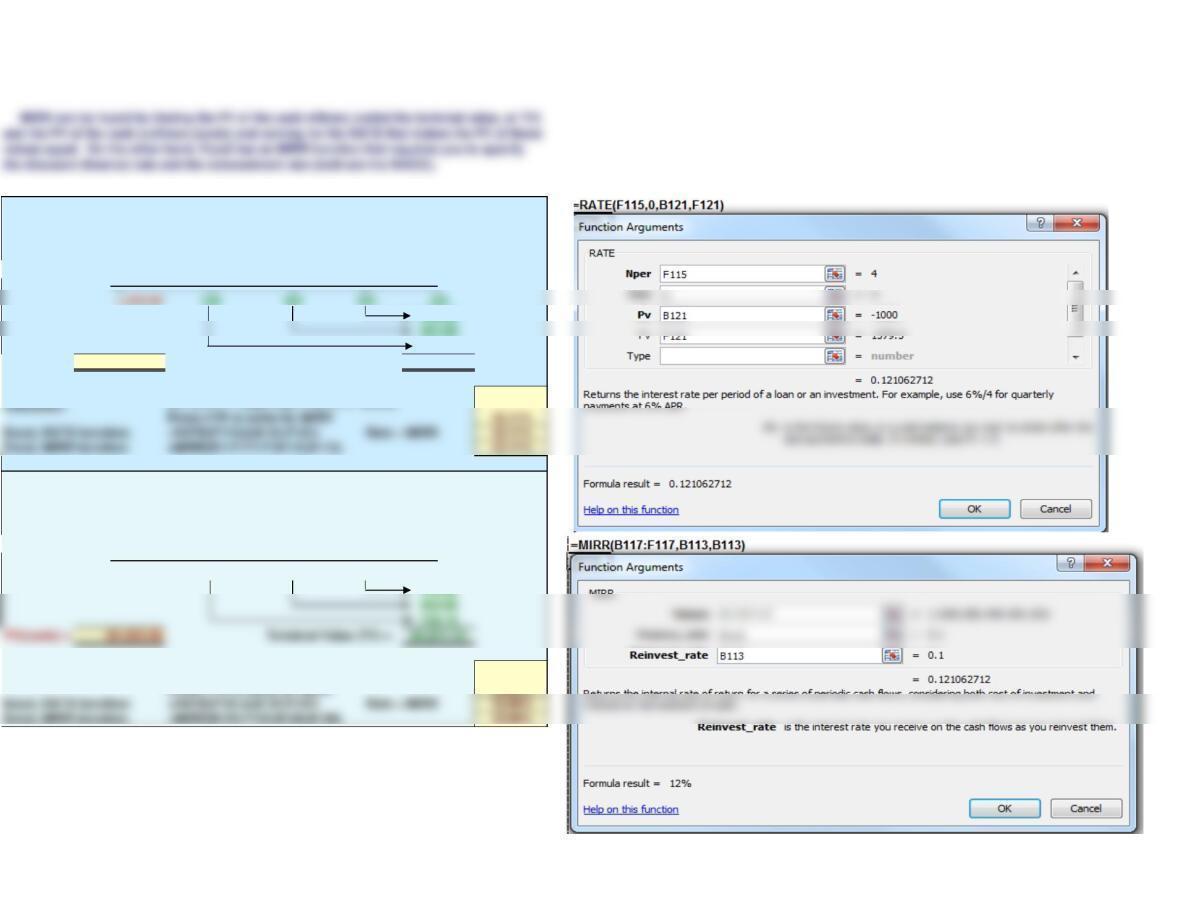
Figure 11.4 Finding the MIRR for Project S, WACC = 10%
WACC = 10%
Project S 0 1 2 3 4
330.00
484.00
665.50
PV(costs) = -$1,000.00 $1,579.50
Press I/YR to solve for MIRR
Finding the MIRR for Project L, WACC = 10%
WACC = 10%
Project L 0 1 2 3 4
| | | | |
-1,000.00 100 300 400 675
440.00
363.00
133.10
PV(costs) = -$1,000.00 $1,611.10
Calculator: 12.66%
The MIRR calculates a project’s expected rate of return based upon the assumption that
cash flows are reinvested at the cost of capital, rather than the IRR. The MIRR uses a better
reinvestment assumption than the IRR and is immune to the multiple IRR problem. For
these reasons, many analysts believe it is a better indicator of relative profitability.
N = 4, PV = -1000, PMT = 0, FV = 1579.5,
N = 4, PV = -1000, PMT = 0, FV = 1611.1,
Press I/YR to solve for MIRR
Terminal Value (TV) =
NPV PROFILES (Section 11-7)
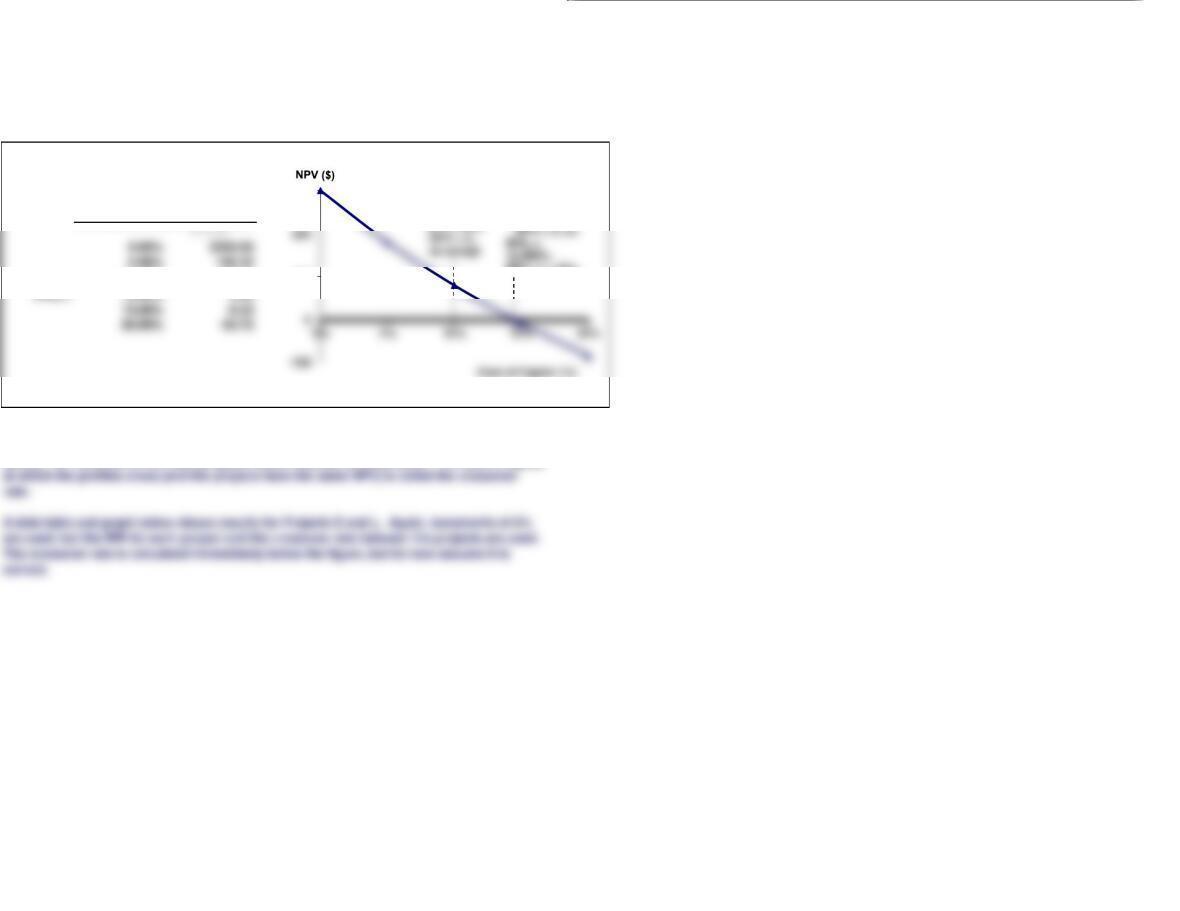
Figure 11.5 NPV Profile for Project S
Cost of
Capital
NPVS
10.00% 78.82
IRRS = 14.49% 0.00
The NPV and IRR methods can provide conflicting results when used to evaluate mutually
exclusive projects. Therefore, it is important that you understand the IRR method and know
how it is related to the NPV. An NPV profile helps analyze the situation better.
An NPV profile is a graph that plots a project’s NPV against the discount rate. To create
an NPV profile, first we construct a data table that calculates NPVs at various costs of
capital. Notice, we have used increments of 5% and added Project S’s IRR.
at which the profiles cross (and the projects have the same NPV) is called the crossover
are used, but the IRR for each project and the crossover rate between the projects are used.
The crossover rate is calculated immediately below the figure, but for now assume it is
When comparing mutually exclusive projects whose cash flows differ with respect to size or
timing, conflicts arise between the NPV and IRR methods (as indicated by calculations
above). NPV profiles of two such projects would intersect at some point. The cost of capital
Data for the Graph:
* For a primer on making data
tables, refer to the Excel Tutorial.
100
300
At r = 10%,
IRR > r = 10%,
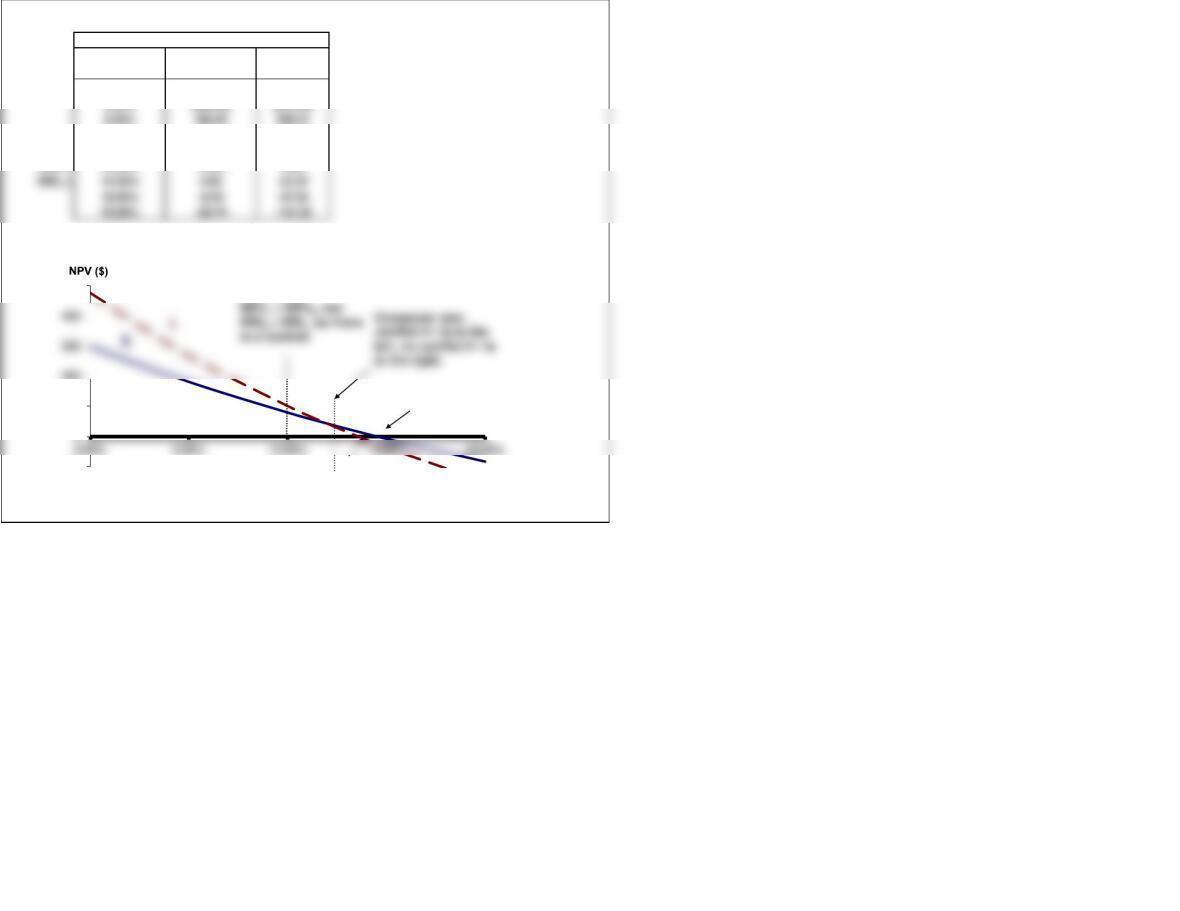
Figure 11.6 NPV Profiles for Projects S and L
Cost of
Capital
NPVS NPVL
$78.82 $100.40
10.00% 78.82 100.40
Crossover = 11.97% 42.84 42.84
IRRL = 13.55% 15.64 0.00
IRRS = 14.49% 0.00 -24.37
Data for the Graph:
-100
100
200
500
Cost of Capital (%)
IRRS
IRRL
At r = 10%,
CALCULATING THE CROSSOVER RATE
Year (t) Project S Project L
0 -$1,000 -$1,000 $0
PAYBACK PERIOD (Section 11-8)
Figure 11.7 Payback Calculations
Project S Years 0 1 2 3 4
Project L Years 0 1 2 3 4
| | | | |
Expected After-Tax Net
Cash Flows, CFt
CF
Differential
The payback period is defined as the length of time required for an investment’s cash flows
to cover its costs.
The NPV and IRR methods can provide conflicting results when used to evaluate mutually

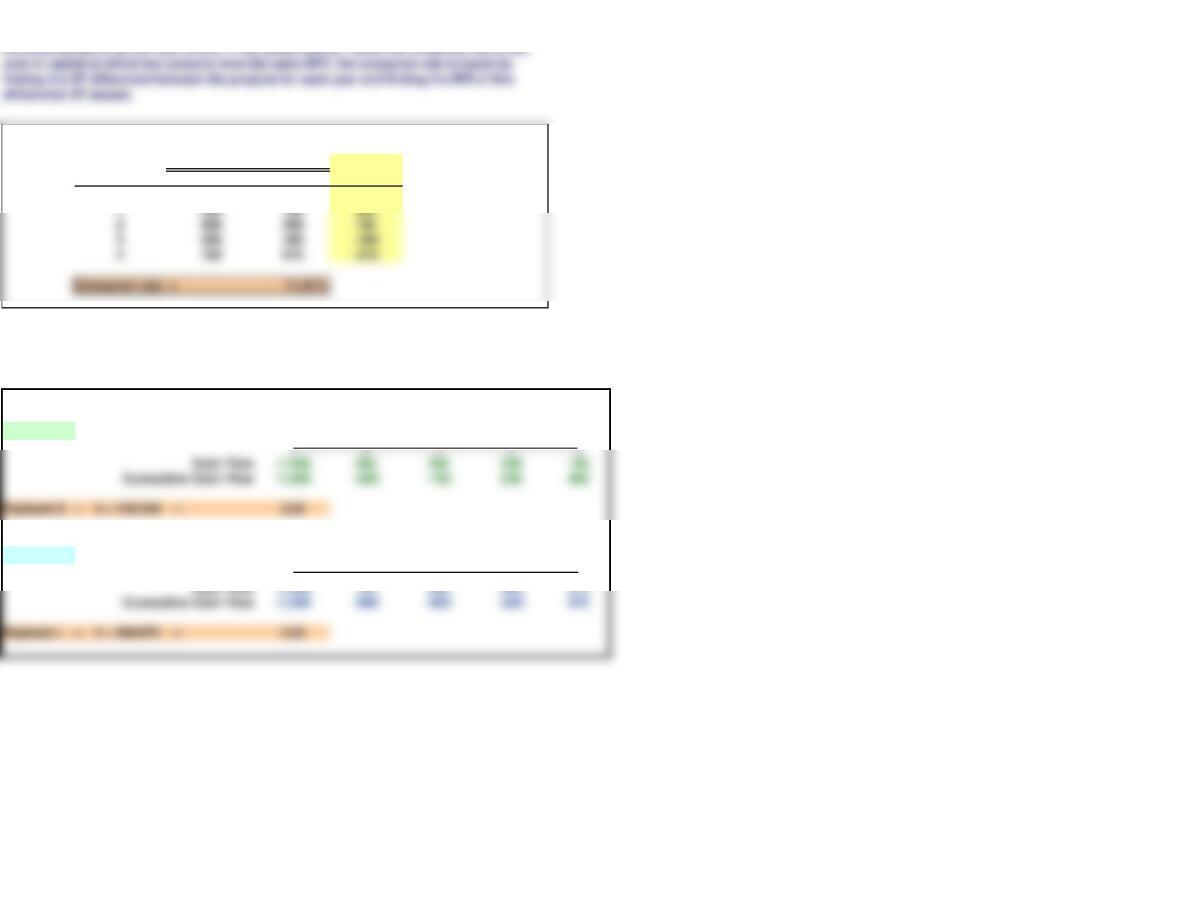
Figure 11.8 Discounted Payback Calculations at 10% Cost of Capital
WACC 10%
Project S Years 0 1 2 3 4
| | | | |
Cash Flow -1,000 500 400 300 100
Project L Years 0 1 2 3 4
| | | | |
Cash Flow -1,000 100 300 400 675
However, the payback period ignores cash flows occurring after the cost is recovered and it
ignores the time value of money. In an effort to alleviate the second concern, the discounted
payback was developed, which incorporates the present value of cash flows received.
SECTION 11-4 12/12/2018
SOLUTIONS TO SELF-TEST QUESTIONS
Project MM
Year (t) CFs
0-$1,000
WACCs
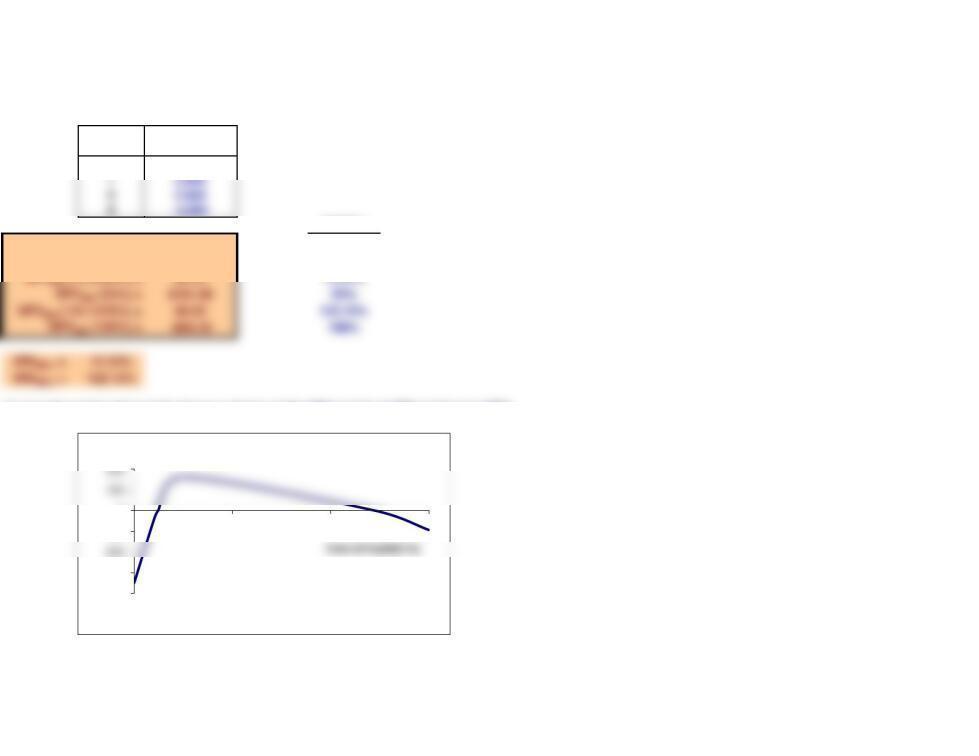
NPVMM (0%) = -$350.00 0%
NPVMM (10%) = -$45.83 10%
NPVMM (12.2258%) = $0.00 12.23%
NPVMM (25%) = $164.80 25%
2. Project MM has the cash flows shown below. Calculate MM’s NPV at discount rates of 0%,
10%,12.2258%, 25%, 122.1470%, and 150%. What are MM’s IRRs? If the cost of capital were
10%, should the project be accepted or rejected?
*** A quick scatter plot graph shows a sketch of the NPV profile of MM and its two IRRs.
-400
-300
-100
0
0% 50% 100% 150%
NPV ($)
Multiple IRRs: Project MM

SECTION 11-8 12/12/2018
SOLUTIONS TO SELF-TEST QUESTIONS
Regular payback
Years 0 1 2 3 4
Discounted payback
WACC 15%
Years 0 1 2 3 4
| | | | |
Cash Flow -1,000 300 300 300 1,000
3. Project P has a cost of $1,000 and cash flows of $300 per year for 3 years plus another
$1,000 in Year 4. The project’s cost of capital is 15%. What are P’s regular and discounted
paybacks? If the company requires a payback of 3 years or less, would the project be
accepted? Would this be a good accept/reject decision, considering the NPV and/or the IRR?
| | | | |
Cash Flow -1,000 300 300 300 1,000