Unlock document.
This document is partially blurred.
Unlock all pages and 1 million more documents.
Get Access
Solution 12/7/2012
Chapter: 11
Problem: 18
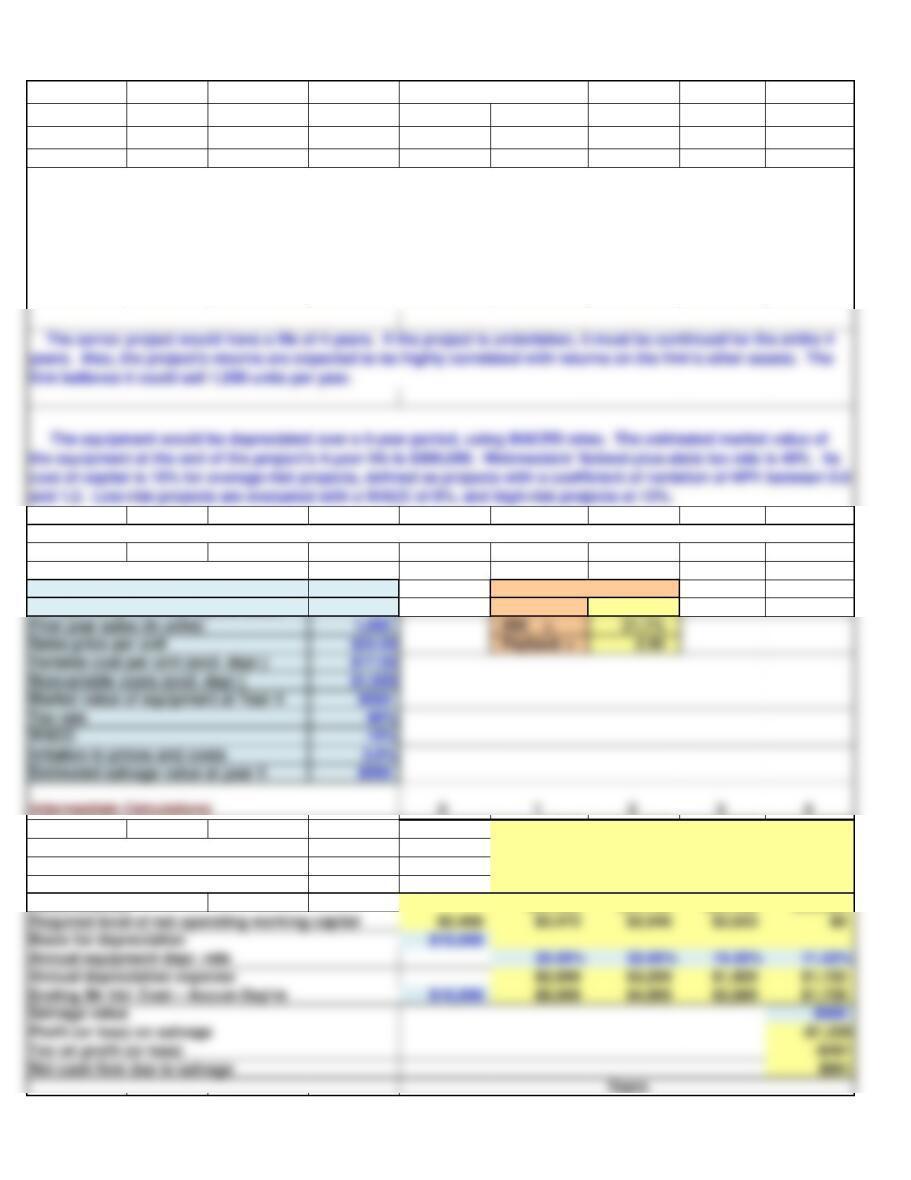
Input Data (in thousands of dollars)
Equipment cost $10,000 Key Results:
Net operating working capital/Sales 10% NPV = $3,463
Units sold 1,000 1,000 1,000 1,000
Sales price per unit (excl. depr.) $24.00 $24.72 $25.46 $26.23
Variable costs per unit (excl. depr.) $17.50 $18.03 $18.57 $19.12
Nonvariable costs (excl. depr.) 1,000 1,030 1,061 1,093
Sales revenue $24,000 $24,720 $25,462 $26,225
a. Develop a spreadsheet model, and use it to find the project’s NPV, IRR, and payback.
Webmasters.com has developed a powerful new server that would be used for corporations’ Internet activities. It
would cost $10 million at Year 0 to buy the equipment necessary to manufacture the server. The project would
require net working capital at the beginning of each year in an amount equal to 10% of the year's projected sales; for
example, NWC0 = 10%(Sales1). The servers would sell for $24,000 per unit, and Webmasters believes that variable
costs would amount to $17,500 per unit. After Year 1, the sales price and variable costs will increase at the inflation
rate of 3%. The company’s nonvariable costs would be $1 million at Year 1 and would increase with inflation.
Page 1
Cash Flow Forecast 0 1 2 3 4
Sales revenue $24,000 $24,720 $25,462 $26,225
Variable costs 17,500 18,025 18,566 19,123
Nonvariable operating costs 1,000 1,030 1,061 1,093
Key Results: Appraisal of the Proposed Project
Net Present Value (at 10%) = $3,463
IRR = 21.09%
MIRR = 16.99%
Payback = 2.90
Data for Payback Years
0 1 2 3 4
Net cash flow -$12,400 $4,028 $4,605 $4,193 $7,681
Cumulative CF -$12,400 -$8,372 -$3,767 $425 $8,106
Part of year required for payback 1.00 1.00 0.90 0.00
% Deviation
SALES PRICE
b. Now conduct a sensitivity analysis to determine the sensitivity of NPV to changes in the sales price, variable
costs per unit, and number of units sold. Set these variables’ values at 10% and 20% above and below their base-
case values. Include a graph in your analysis.
Years
Note about data tables. The data in the column input should
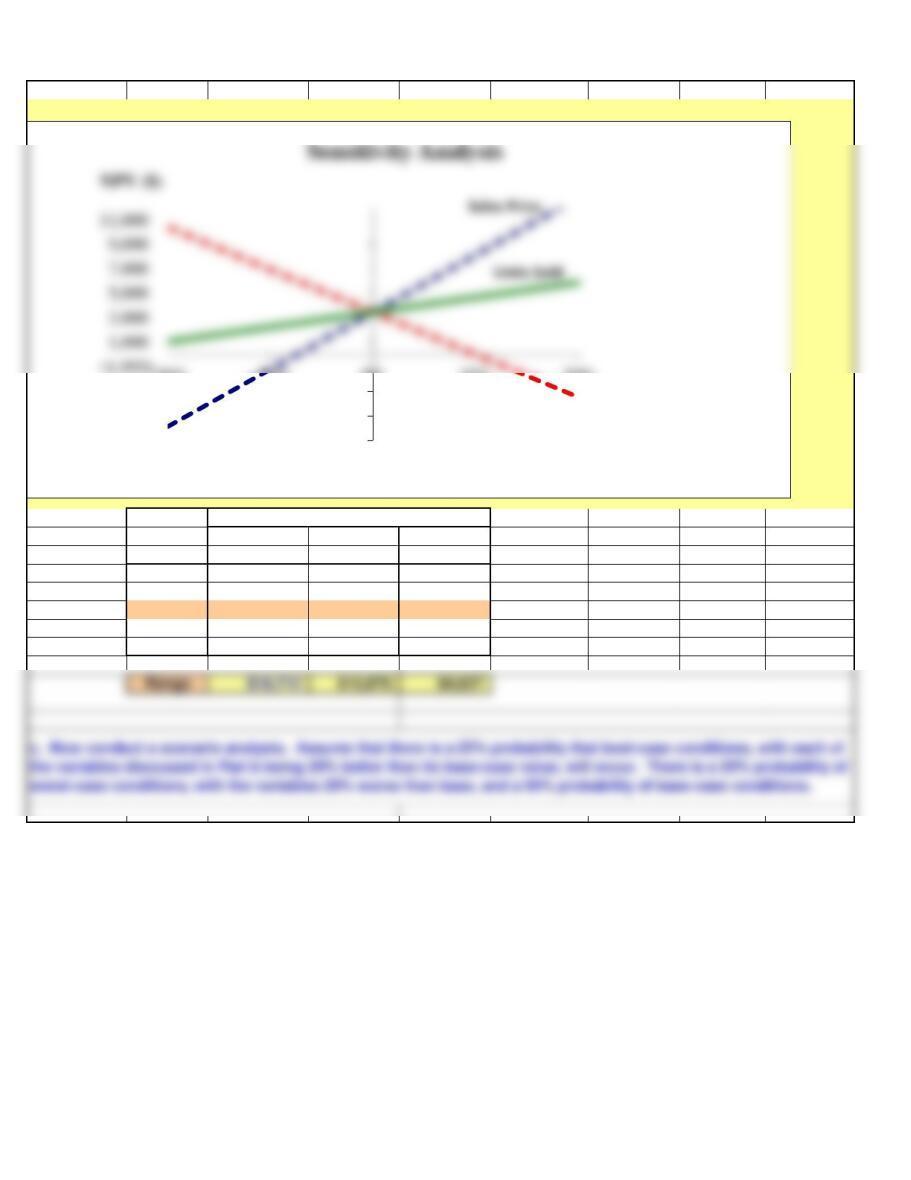
Deviation NPV at Different Deviations from Base
from Sales Variable
Base Case Price Cost/Unit Units Sold
-20% -$5,893 $10,401 $1,045
-10% -$1,215 $6,932 $2,254
0% $3,463 $3,463 $3,463
10% $8,141 -$6 $4,673
20% $12,820 -$3,475 $5,882
(7,000)
(5,000)
(3,000)
-20% -10% 0% 10% 20%
Percentage Deviation from Base
Variable Cost
Page 3
Sales Unit Variable
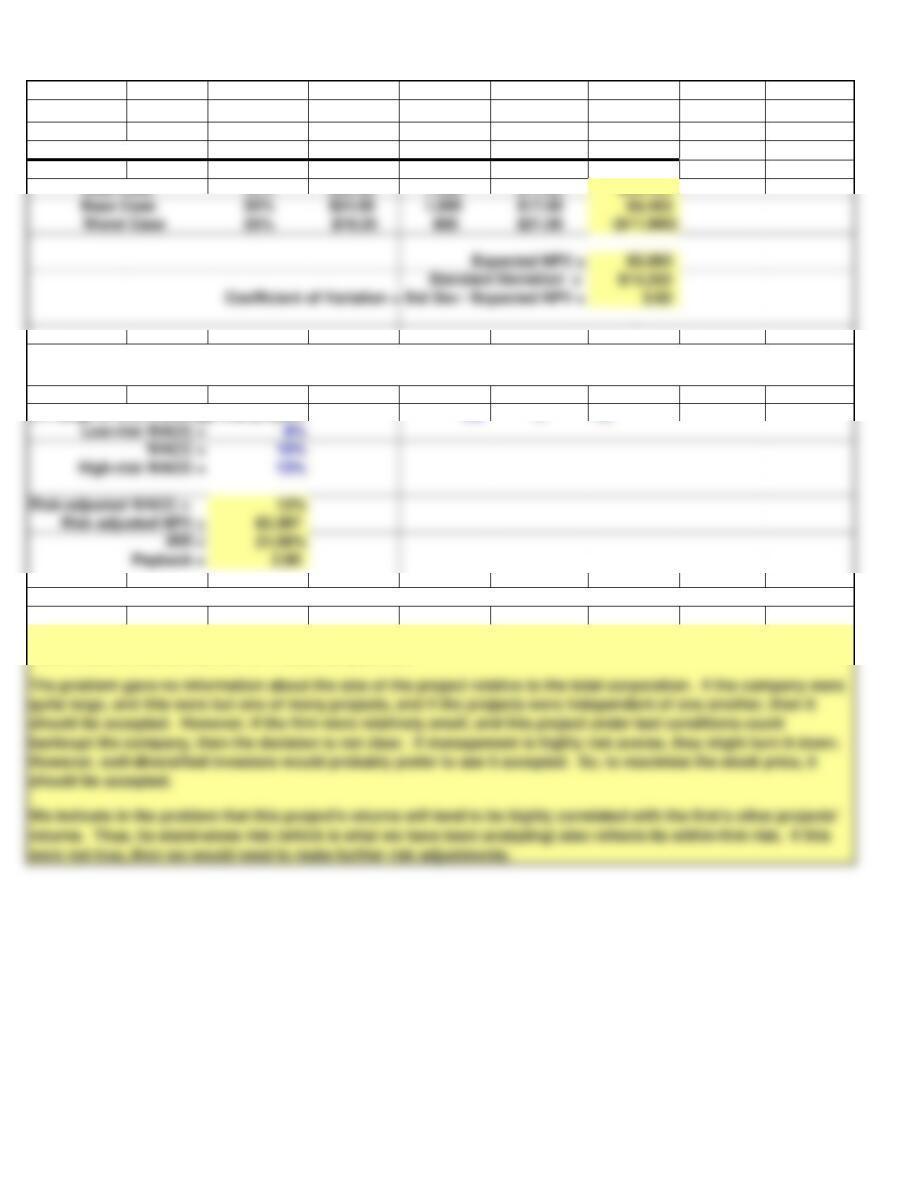
Probability Price Sales Costs NPV
25% $28.80 1,200 $14.00 $25,435
CV range of firm's average-risk project:
0.8 to 1.2
At this point, the project looks risky but acceptable. There is a good chance that it will produce a positive NPV, but
there is also a chance that the NPV could be quite low.
e. On the basis of information in the problem, would you recommend that the project be accepted?
Scenario
d. If the project appears to be more or less risky than an average project, find its risk-adjusted NPV, IRR, and
payback.
Best Case
Page 4
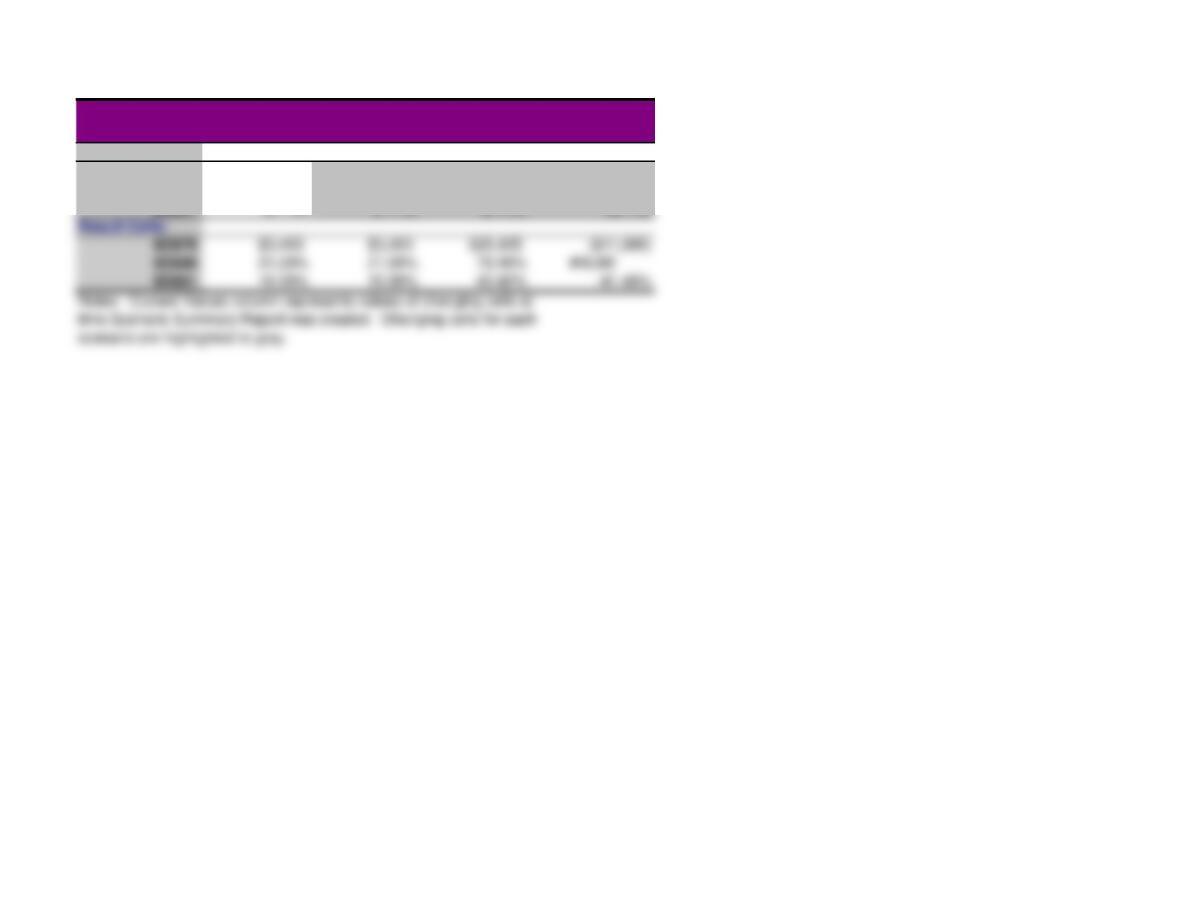
Scenario Summary
Current Values: Base Best Worst
Changing Cells:
$D$29 1,000 1,000 1,200 800
$D$30 $24.00 $24.00 $28.80 $19.20
$D$31 $17.50 $17.50 $14.00 $21.00


