
Chapter 11: The Basics of Capital Budgeting
Learning Objectives
281
Chapter 11
The Basics of Capital Budgeting
Learning Objectives
After reading this chapter, students should be able to do the following:
◆ Discuss capital budgeting.
◆ Calculate and use the major capital budgeting decision criteria, which are NPV, IRR, MIRR, and
payback.
282
Lecture Suggestions
Chapter 11: The Basics of Capital Budgeting
Lecture Suggestions
This is a relatively straight-forward chapter, and, for the most part, it is a direct application of the time
value concepts first discussed in Chapter 5. We point out that capital budgeting is to a company what
buying stocks or bonds is to an individual—an investment decision. The company wants to know if the
expected value of the cash flows is greater than the cost of the project, and whether or not the expected
rate of return on the project exceeds the cost of the funds required to do the project. We cover the
DAYS ON CHAPTER: 4 OF 56 DAYS (50-minute periods)
Answers to End-of-Chapter Questions
11-1 Project classification schemes can be used to indicate how much analysis is required to evaluate
11-2 The regular payback method has three main flaws: (1) Dollars received in different years are all
given the same weight. (2) Cash flows beyond the payback year are given no consideration
11-3 The NPV is obtained by discounting future cash flows, and the discounting process actually
11-4 Mutually exclusive projects are a set of projects in which only one of the projects can be
accepted. For example, the installation of a conveyor-belt system in a warehouse and the
11-5 The first question is related to Question 11-3 and the same rationale applies. A high cost of
11-6 The statement is true. The NPV and IRR methods result in conflicts only if mutually exclusive
projects are being considered because the NPV is positive if and only if the IRR is greater than
11-7 Payback provides information on how long funds will be tied up in a project. The shorter the
payback, other things held constant, the greater the project’s liquidity. This factor is often
11-8 Project X should be chosen over Project Y. Because the two projects are mutually exclusive, only
one project can be accepted. The decision rule that should be used is NPV. Since Project X has
11-9 The NPV method assumes reinvestment at the cost of capital, while the IRR method assumes
reinvestment at the IRR. MIRR is a modified version of IRR that assumes reinvestment at the
cost of capital.
11–10 a. In general, the answer is no. The objective of management should be to maximize value,
and as we point out in subsequent chapters, stock values are determined by both earnings
and growth. The NPV calculation automatically takes this into account, and if the NPV of a
Chapter 11: The Basics of Capital Budgeting
Answers and Solutions
285
Solutions to End-of-Chapter Problems
11-1 Financial calculator solution: Input CF0 = –65000, CF1-9 = 12000, I/YR = 9, and then solve for
NPV = $6,942.96. Alternatively,
Annual Discounted @9%
Period Cash Flows Cash Flows
11.57%.
11-3 MIRR: PV costs = $65,000.
FV inflows:
PV FV
0 1 2 3 4 5 6 7 8 9
| | | | | | | | | |
12,000 12,000 12,000 12,000 12,000 12,000 12,000 12,000 12,000
13,080.00
14,257.20
15,540.35
(1.09)5
11-4 Since the cash flows are a constant $12,000, calculate the payback period as: $65,000/$12,000
9%
1.09
(1.09)2
(1.09)3
286
Answers and Solutions
Chapter 11: The Basics of Capital Budgeting
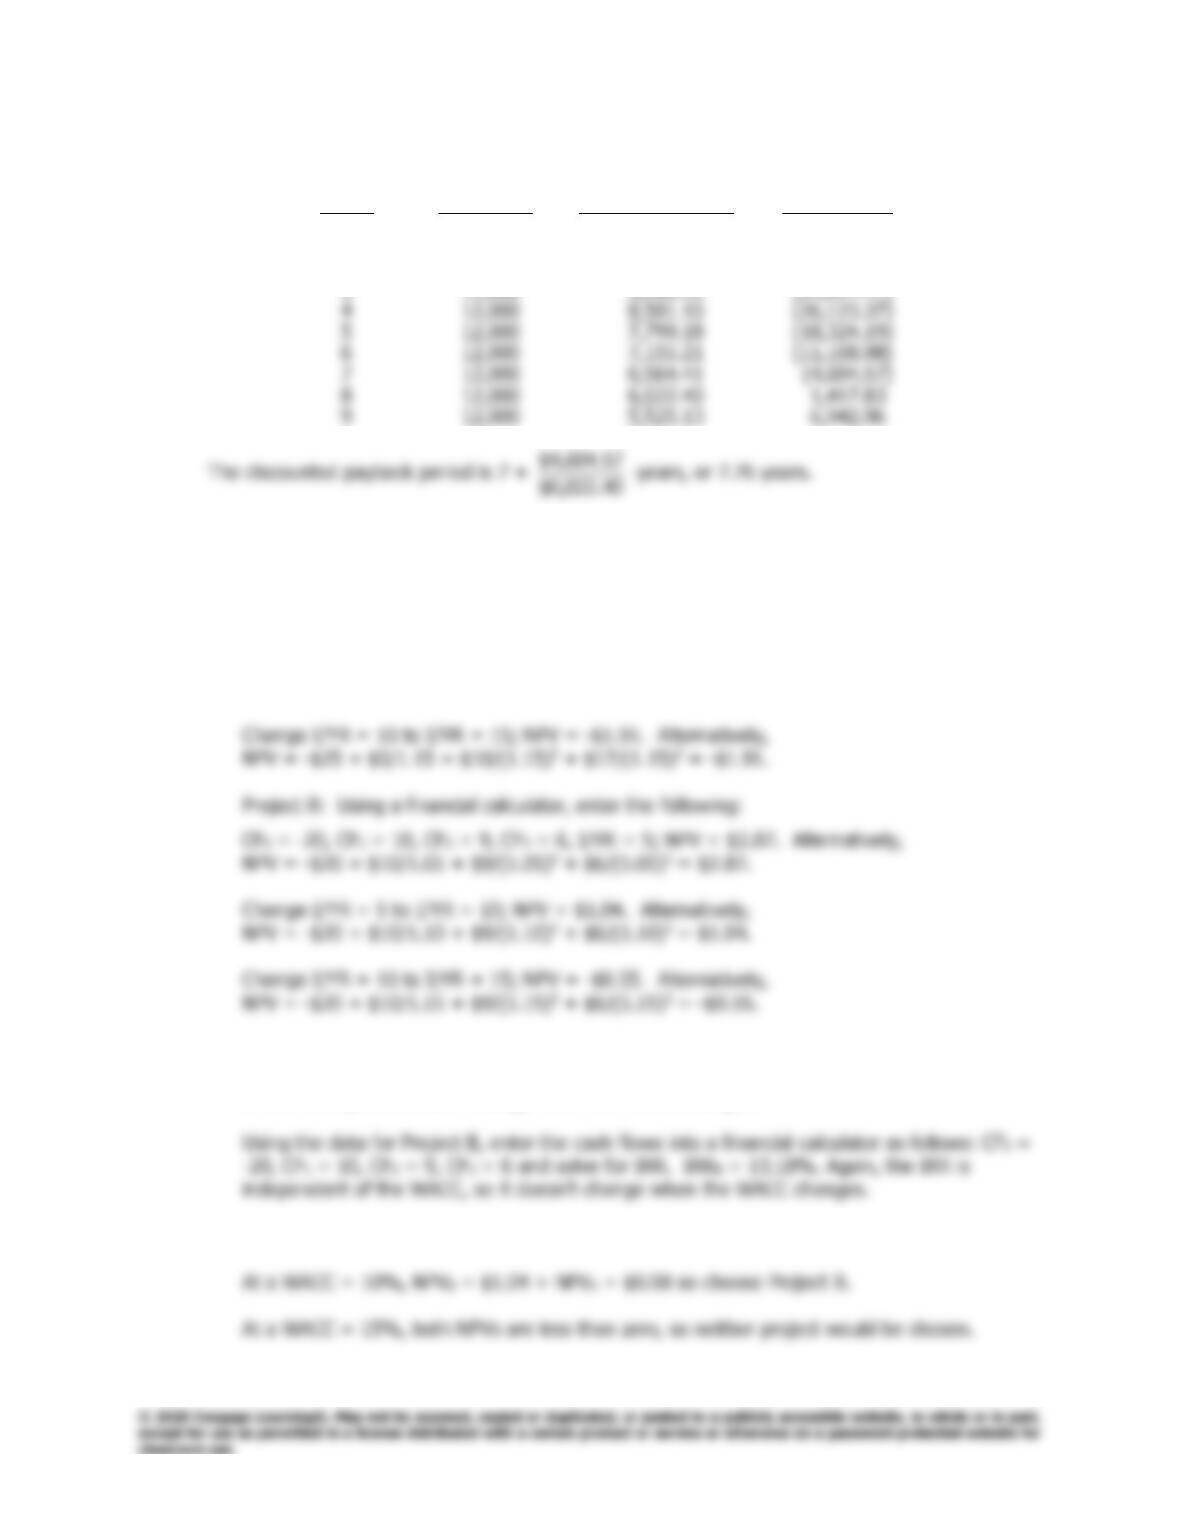
11-5 Project L’s discounted payback period is calculated as follows:
Annual Discounted @9%
Period Cash Flows Cash Flows Cumulative
0 ($65,000) ($65,000.00) ($65,000.00)
1 12,000 11,009.17 (53,990.83)
2 12,000 10,100.16 (43,890.67)
3 12,000 9,266.20 (34,624.47)
11-6 a. Project A: Using a financial calculator, enter the following:
CF0 = –25, CF1 = 5, CF2 = 10, CF3 = 17, I/YR = 5; NPV = $3.52. Alternatively,
NPV = -$25 + $5/1.05 + $10/(1.05)2 + $17/(1.05)3 = $3.52.
Change I/YR = 5 to I/YR = 10; NPV = $0.58. Alternatively,
NPV = -$25 + $5/1.10 + $10/(1.10)2 + $17/(1.10)3 = $0.58.
b. Using the data for Project A, enter the cash flows into a financial calculator as follows: CF0 =
-25, CF1 = 5, CF2 = 10, CF3 = 17 and solve for IRR. IRRA = 11.10%. The IRR is independent
of the WACC, so it doesn’t change when the WACC changes.
c. At a WACC = 5%, NPVA = $3.52 > NPVB = $2.87 so choose Project A.
Chapter 11: The Basics of Capital Budgeting
Answers and Solutions
287
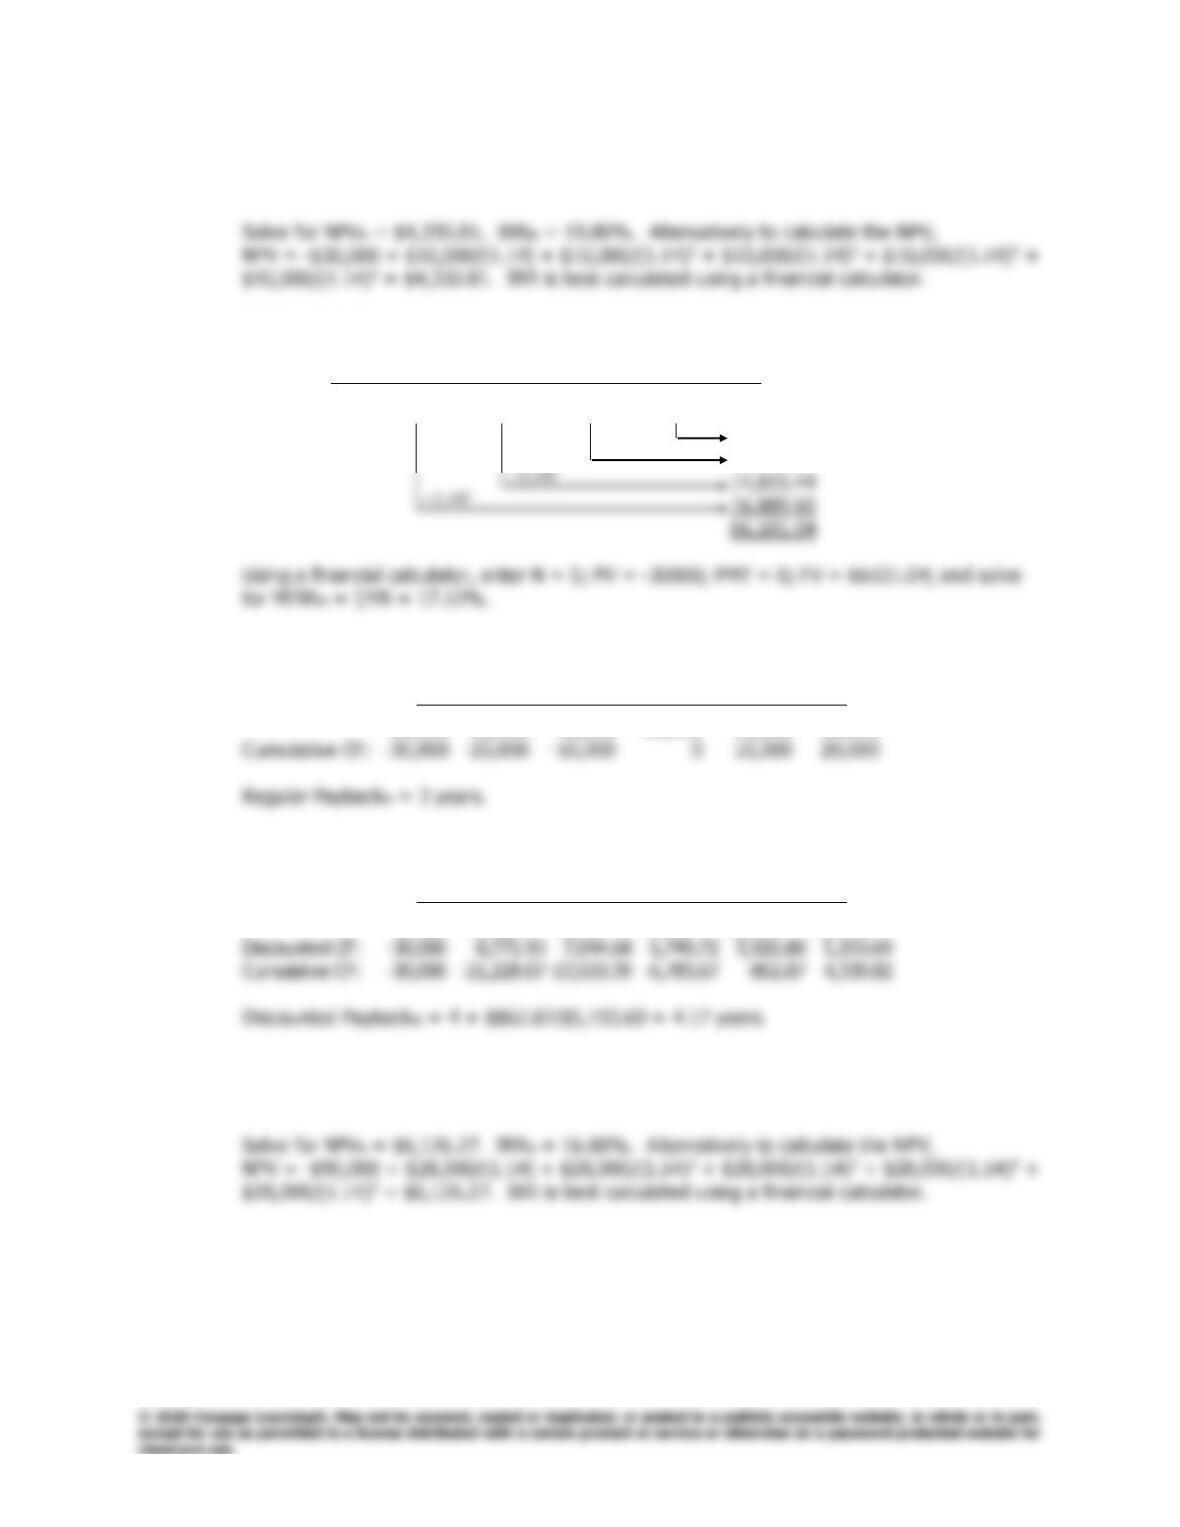
11-7 a. Project M:
Using a financial calculator, enter CF0 = –30000; CF1-5 = 10000; I/YR = 14.
MIRR calculation:
0 1 2 3 4 5
| | | | | |
–30,000 10,000 10,000 10,000 10,000 10,000
11,400.00
12,996.00
Payback calculation:
0 1 2 3 4 5
| | | | | |
–30,000 10,000 10,000 10,000 10,000 10,000
Discounted payback calculation:
0 1 2 3 4 5
| | | | | |
–30,000 10,000 10,000 10,000 10,000 10,000
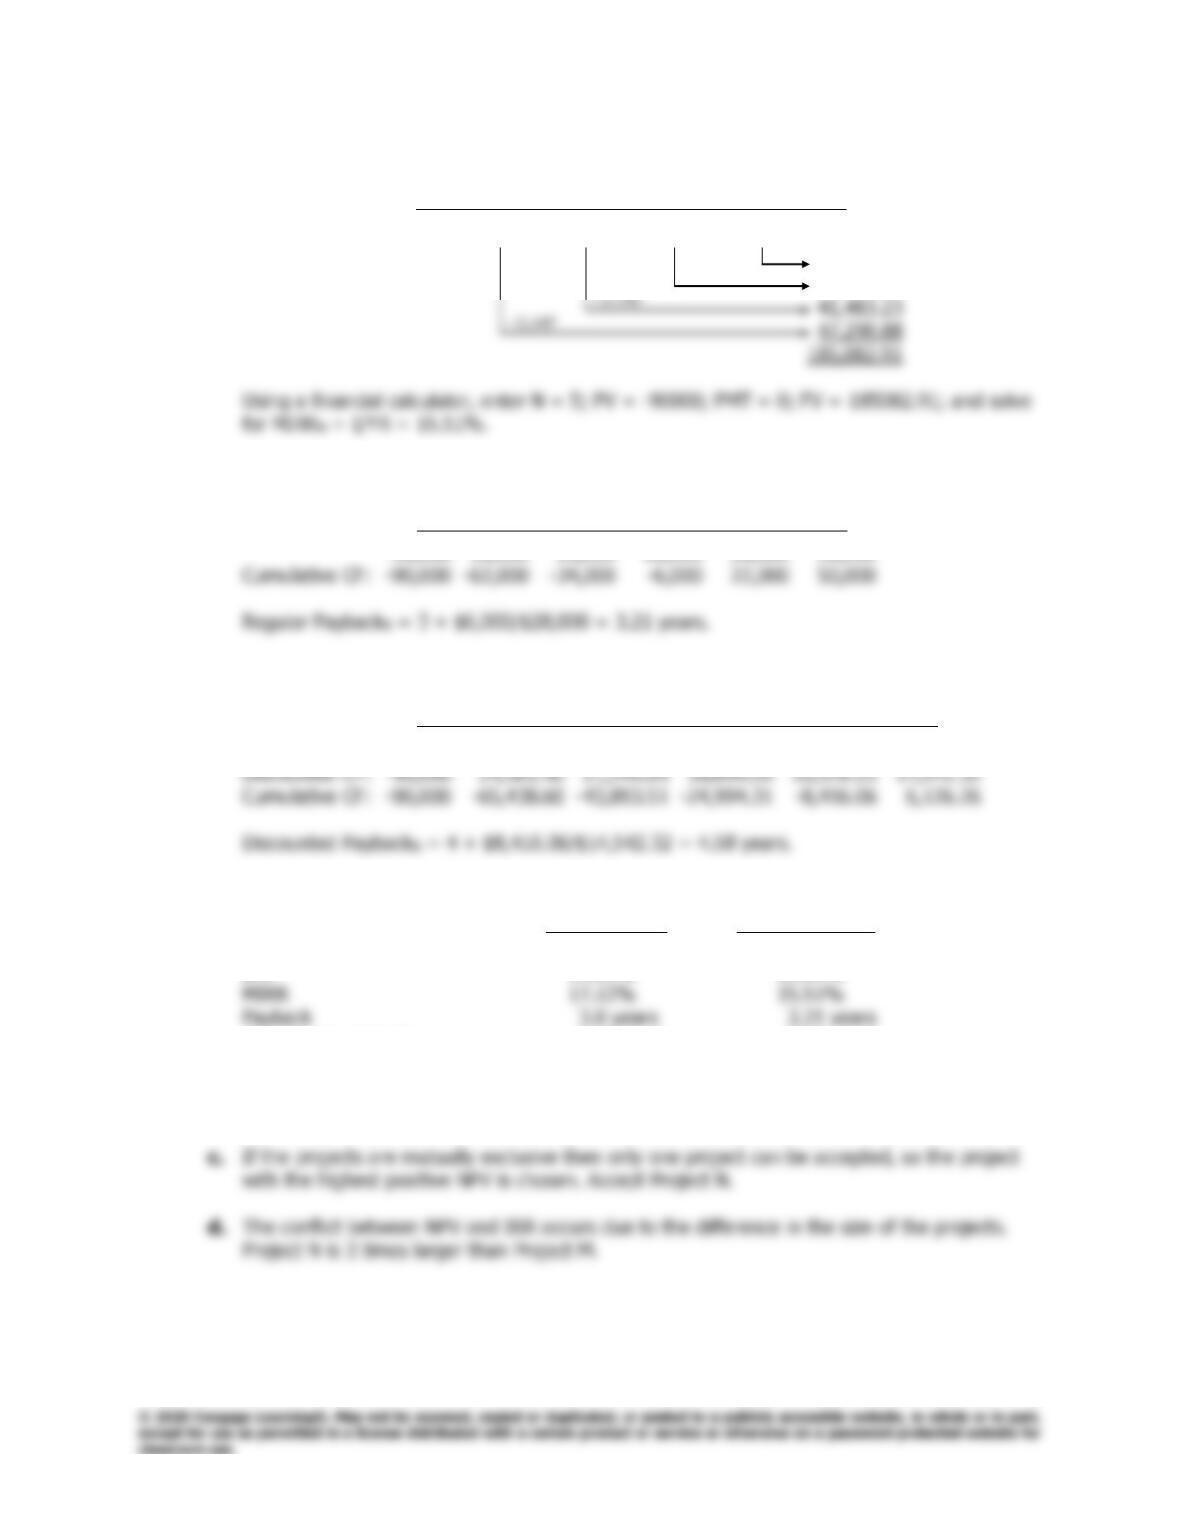
Project N:
CF0 = –90000; CF1-5 = 28000; I/YR = 14.
1.14
(1.14)2
14%
14%
288
Answers and Solutions
Chapter 11: The Basics of Capital Budgeting
MIRR calculation:
0 1 2 3 4 5
| | | | | |
–90,000 28,000 28,000 28,000 28,000 28,000
31,920.00
36,388.80
Payback calculation:
0 1 2 3 4 5
| | | | | |
–90,000 28,000 28,000 28,000 28,000 28,000
Discounted payback calculation:
0 1 2 3 4 5
| | | | | |
–90,000 28,000 28,000 28,000 28,000 28,000
Summary of capital budgeting rules results:
Project M Project N
NPV $4,330.81 $6,126.27
IRR 19.86% 16.80%
Discounted payback 4.17 years 4.58 years
b. If the projects are independent, both projects would be accepted because both of their NPVs
are positive.
1.14
(1.14)2
14%
14%
Chapter 11: The Basics of Capital Budgeting
Answers and Solutions
289
11-8 a. No mitigation analysis (in millions of dollars):
0 1 2 3 4 5
| | | | | |
–60 20 20 20 20 20
Using a financial calculator, enter the data as follows: CF0 = -60; CF1-5 = 20; I/YR = 12.
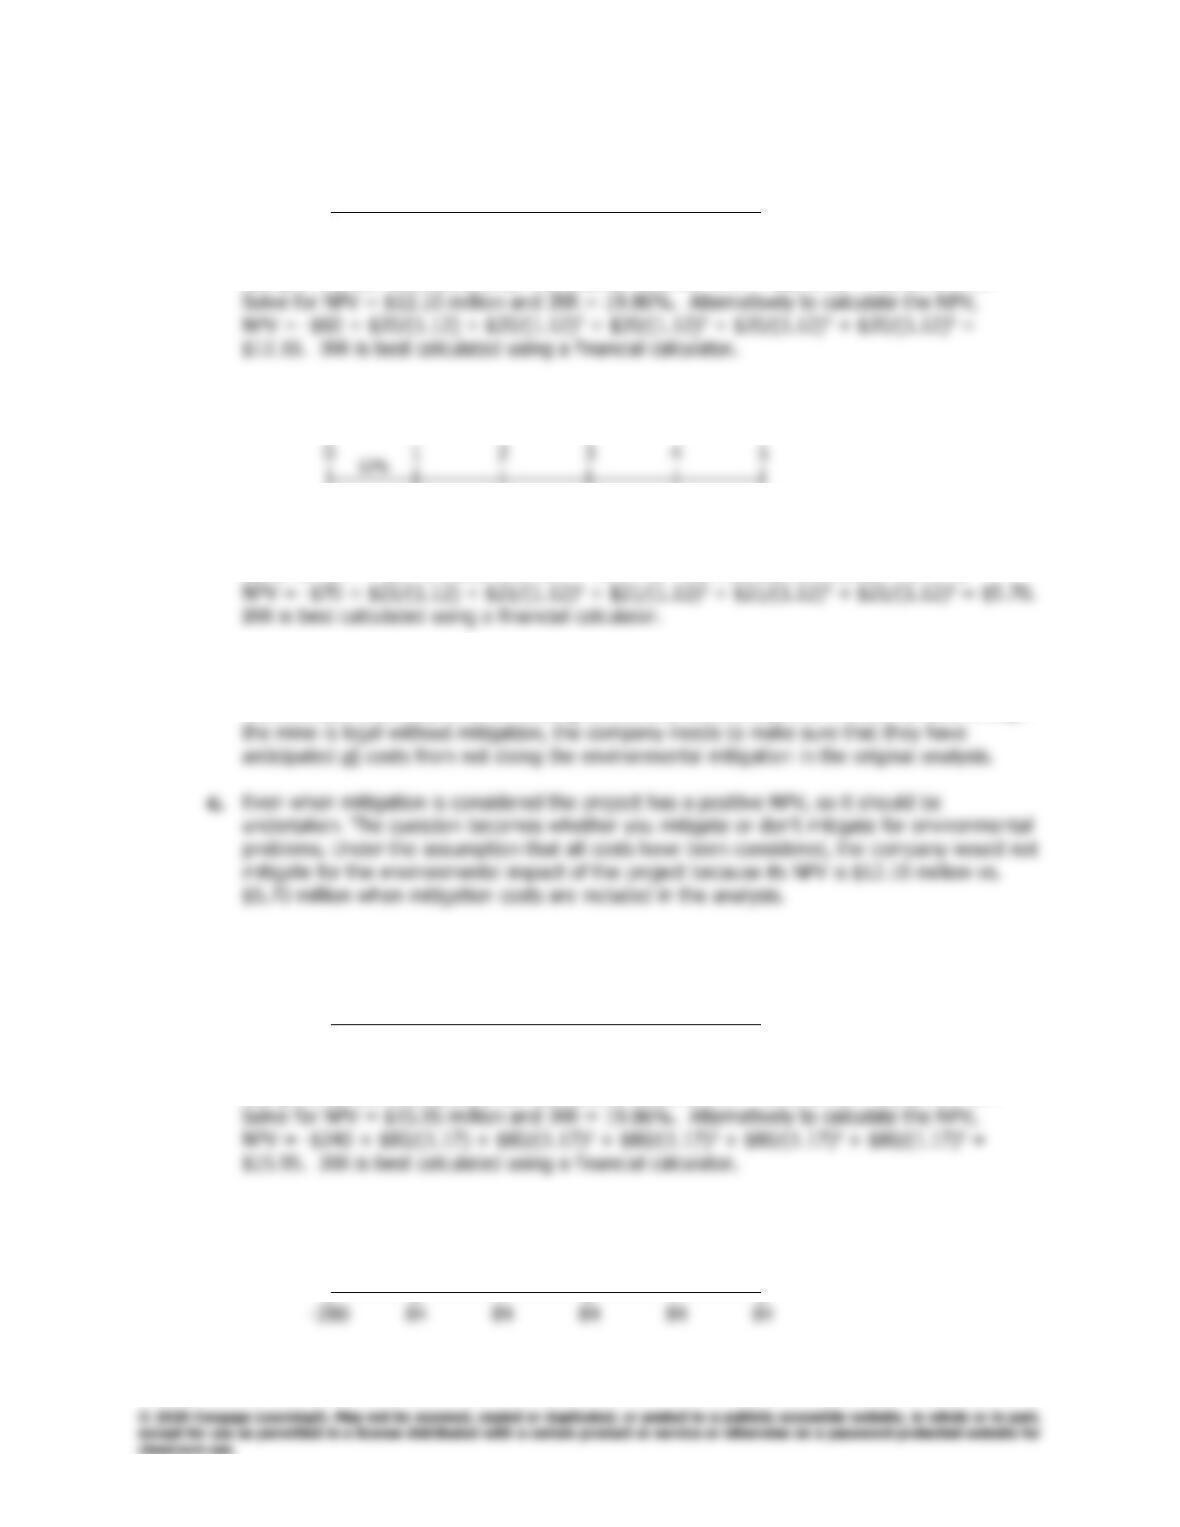
With mitigation analysis (in millions of dollars):
12%
–70 21 21 21 21 21
Using a financial calculator, enter the data as follows: CF0 = -70; CF1-5 = 21; I/YR = 12.
Solve for NPV = $5.70 million and IRR = 15.24%. Alternatively to calculate the NPV,
b. The environmental effects if not mitigated could result in additional loss of cash flows and/or
fines and penalties due to ill will among customers, community, etc. Therefore, even though
11-9 a. No mitigation analysis (in millions of dollars):
0 1 2 3 4 5
| | | | | |
–240 80 80 80 80 80
Using a financial calculator, enter the data as follows: CF0 = -240; CF1-5 = 80; I/YR = 17.
With mitigation analysis (in millions of dollars):
0 1 2 3 4 5
| | | | | |
12%
17%
17%
Using a financial calculator, enter the data as follows: CF0 = -280; CF1-5 = 84; I/YR = 17.
b. If the utility mitigates for the environmental effects, the project is not acceptable. However,
before the company chooses to do the project without mitigation, it needs to make sure that
11–10 Project 1: Using a financial calculator, enter the following data: CF0 = -200; CF1-3 = 75; CF4-5
= 190; I/YR = 10. Solve for NPV1 = $234.26. Alternatively, NPV1 = -$200 + $75/1.10 +
$75/(1.10)2 + $75/(1.10)3 + $190/(1.10)4 + $190/(1.10)5 = $234.26.
11–11 Project S: Using a financial calculator, enter the following data: CF0 = -17000; CF1-5 = 5000;
I/YR = 12. NPVS = $1,023.88. Alternatively, NPVS = -$17,000 + $5,000/1.12 + $5,000/(1.12)2
+ $5,000/(1.12)3 + $5,000/(1.12)4 + $5,000/(1.12)5 = $1,023.88.
11–12 Input the appropriate cash flows into the cash flow register, and then calculate NPV at 8.5% and
the IRR of each of the projects:
Project S: CF0 = -1000; CF1 = 870; CF2 = 250; CF3-4 = 25; I/YR = 8.5. Solve for NPVS = $51.82;
IRRS = 12.85%. Alternatively to calculate the NPV, NPVS = –$1,000 + $870/(1.085) +
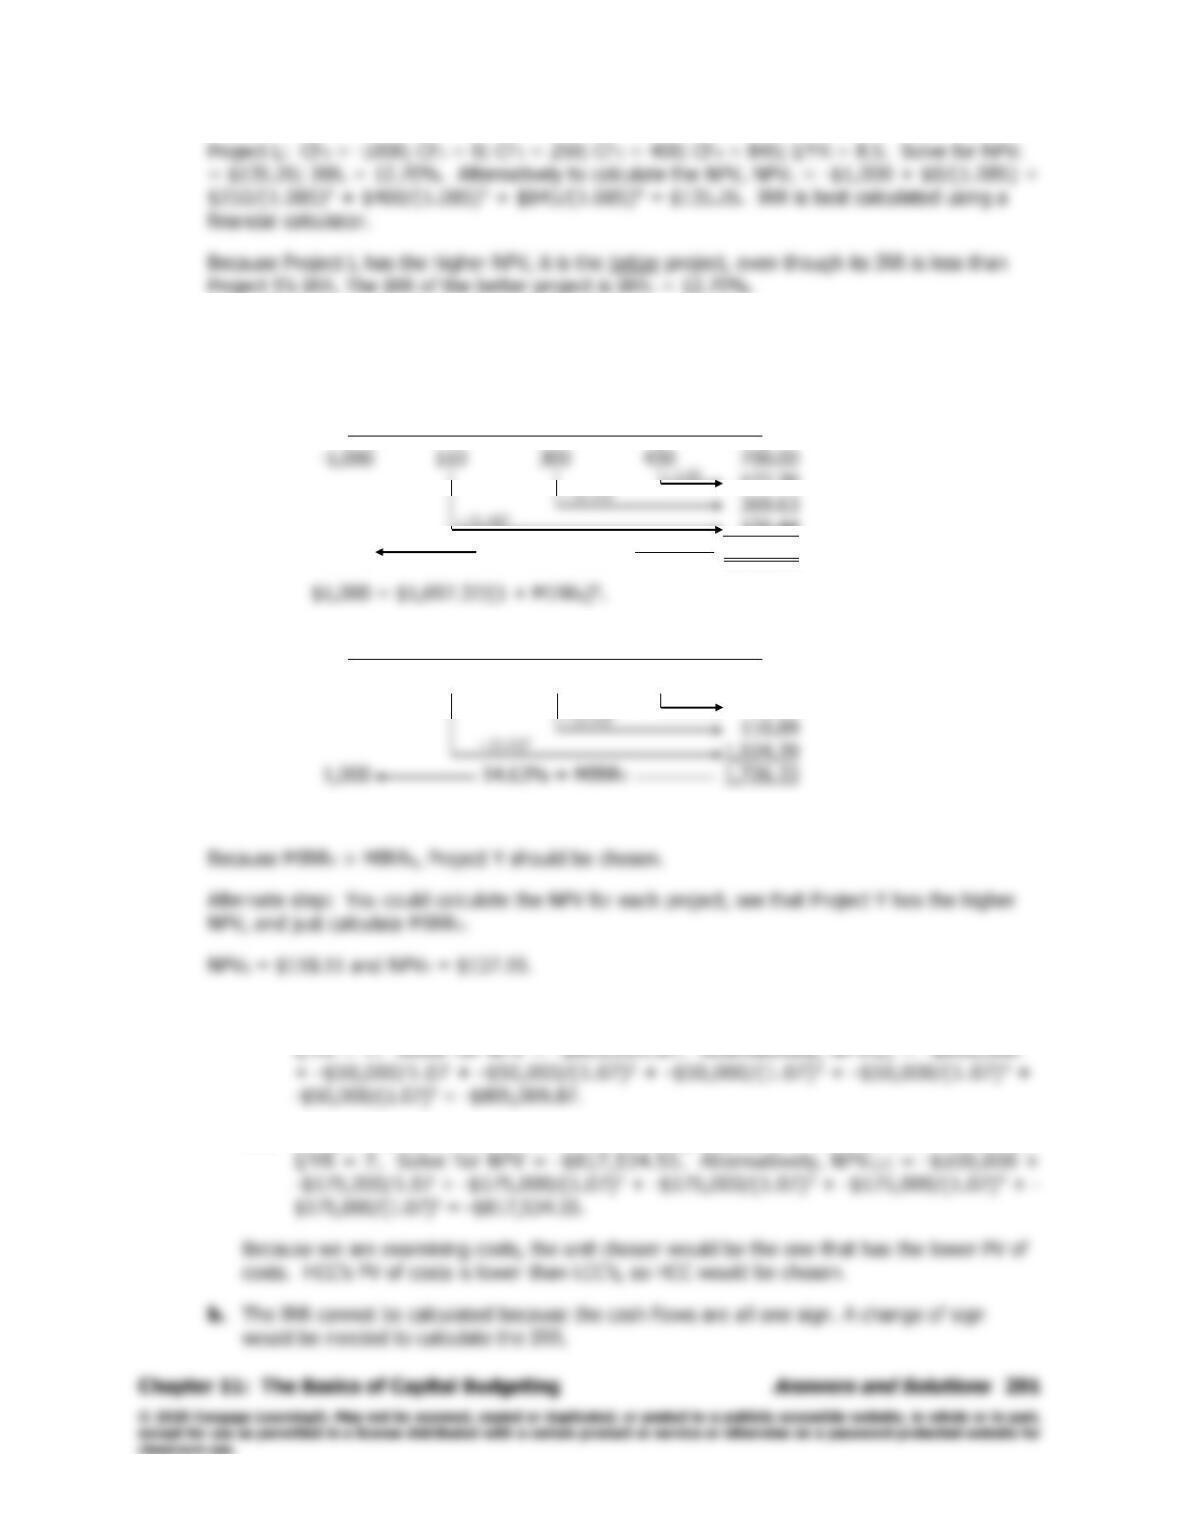
11–13 Because both projects are the same size you can just calculate each project’s MIRR and choose
the project with the higher MIRR.
Project X: 0 1 2 3 4
| | | | |
477.30
150.44
1,000 14.14% = MIRRX 1,697.37
Project Y: 0 1 2 3 4
| | | | |
-1,000 1,100 90 55 50.00
61.05
$1,000 = $1,726.33/(1 + MIRRY)4.
11–14 a. HCC: Using a financial calculator, enter the following data: CF0 = -600000; CF1-5 = –50000;
LCC: Using a financial calculator, enter the following data: CF0 = -100000; CF1-5 = –175000;
11%
11%
1.11
292
Answers and Solutions
Chapter 11: The Basics of Capital Budgeting
c. HCC: Using a financial calculator, enter the following data: CF0 = –600000; CF1-5 = –50000;
I/ Y R = 1 5. S olv e f or N PV = –$ 7 6 7,6 0 7 .75 . Alt e rna t iv ely , N PV H C C = –
$600,000 + -$50,000/1.15 + -$50,000/(1.15)2 + -$50,000/(1.15)3 + –$50,000/(1.15)4
+ -$50,000/(1.15)5 = -$767,607.75.
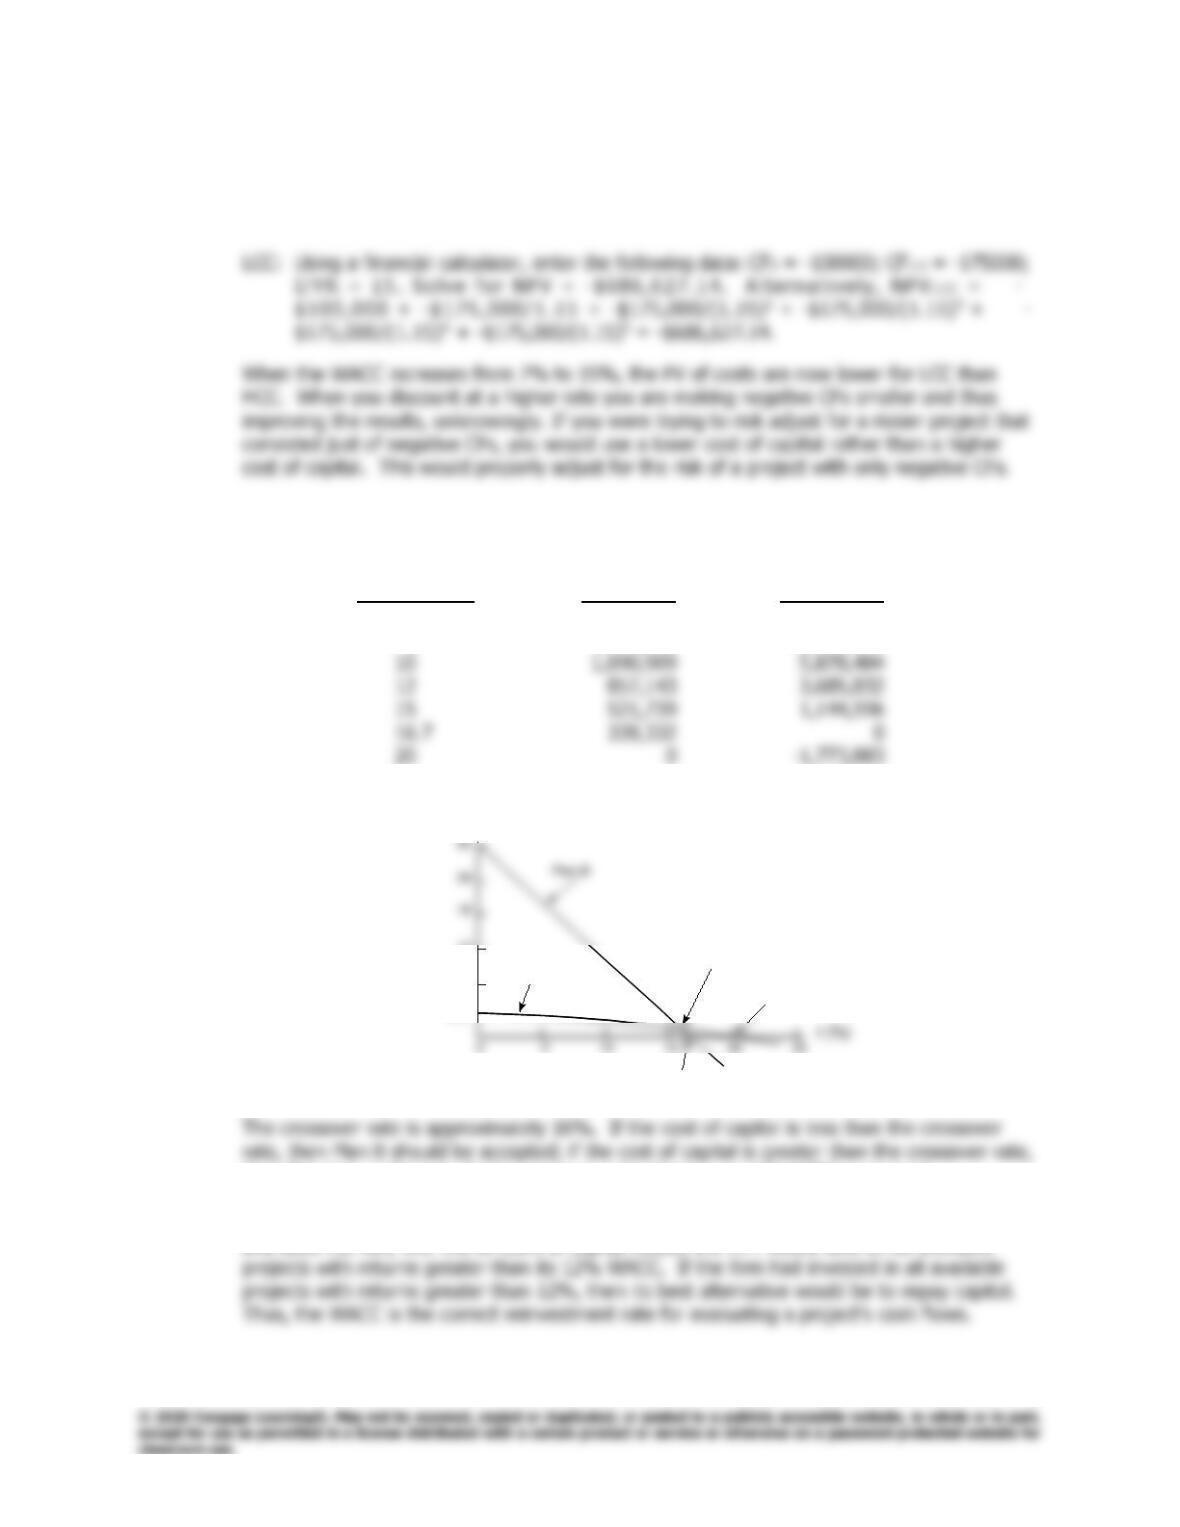
11–15 a. Using a financial calculator, calculate NPVs for each plan (as shown in the table below) and
graph each plan’s NPV profile.
Discount Rate NPV Plan A NPV Plan B
0% $2,400,000 $30,000,000
5 1,714,286 14,170,642
NPV
(Millions of Dollars)
Plan A
Crossover Rate 16%
IRRA= 20%
2.4
6
12
IRRB= 16.7%
NPV
(Millions of Dollars)
Plan A
Crossover Rate 16%
IRRA= 20%
2.4
6
12
IRRB= 16.7%
then Plan A is preferred. At the crossover rate, the two projects’ NPVs are equal.
b. Yes. Assuming (1) equal risk among projects, and (2) that the cost of capital is a constant
and does not vary with the amount of capital raised, the firm would take on all available
Chapter 11: The Basics of Capital Budgeting
Answers and Solutions
293
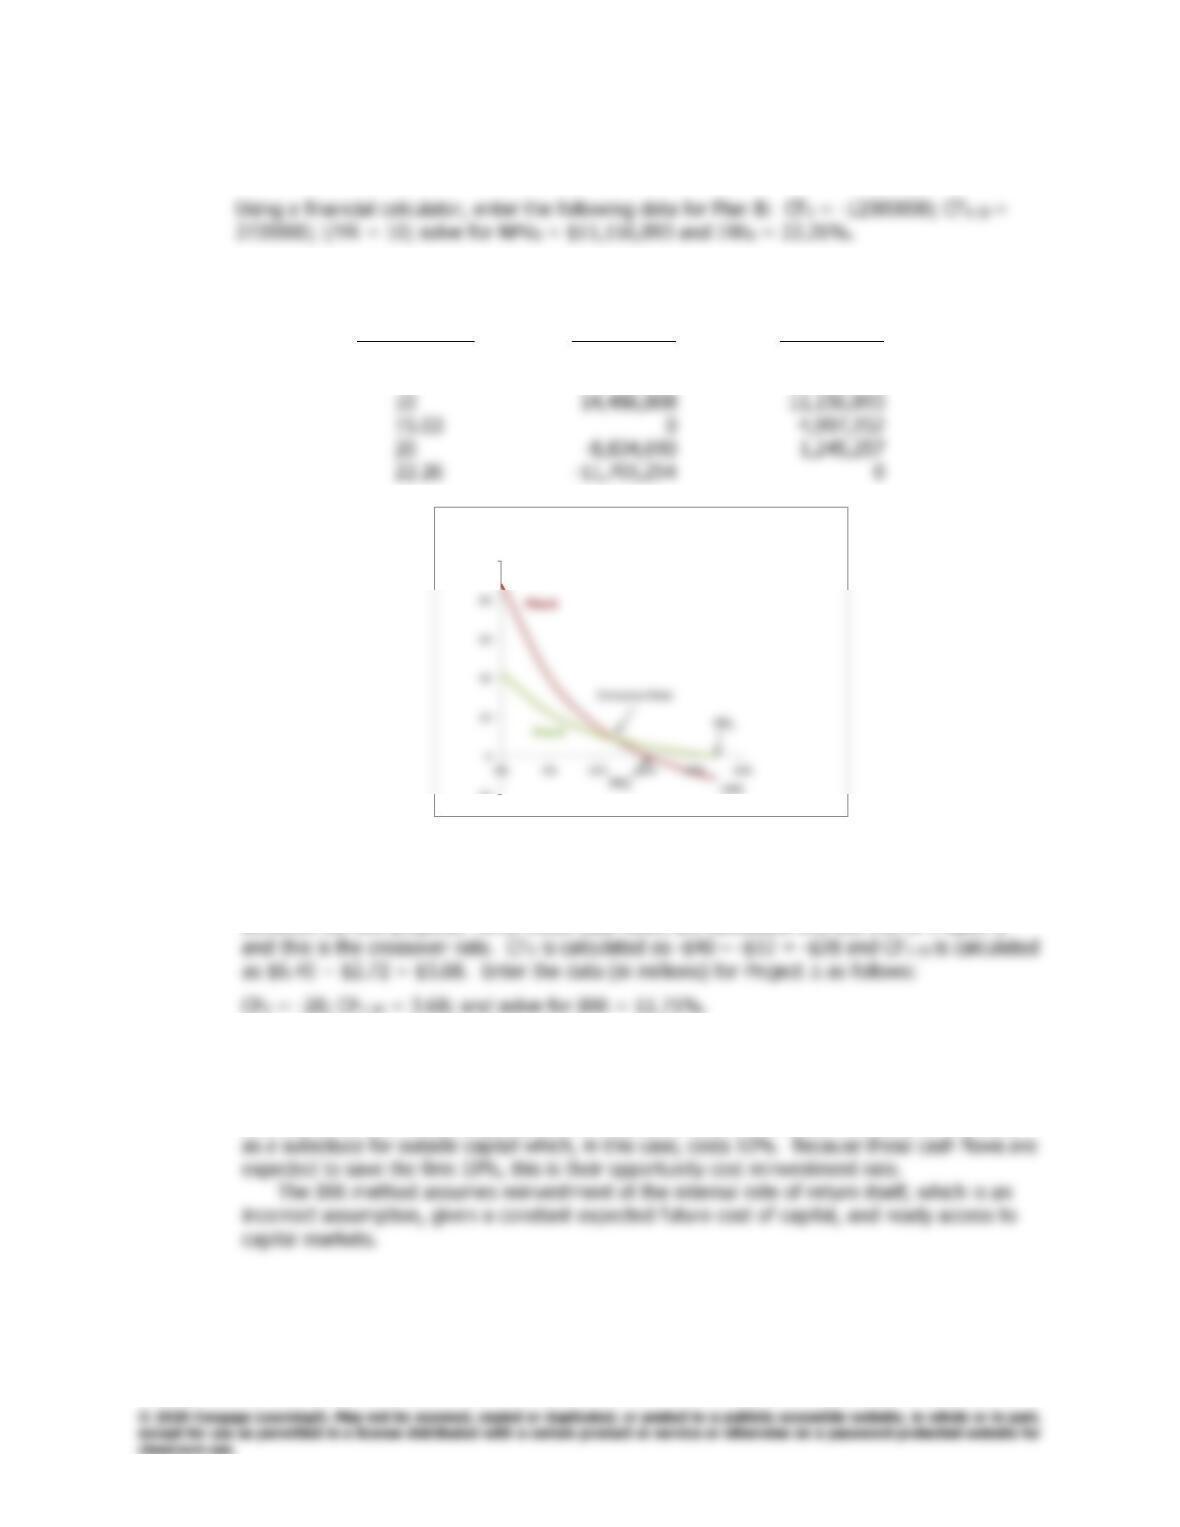
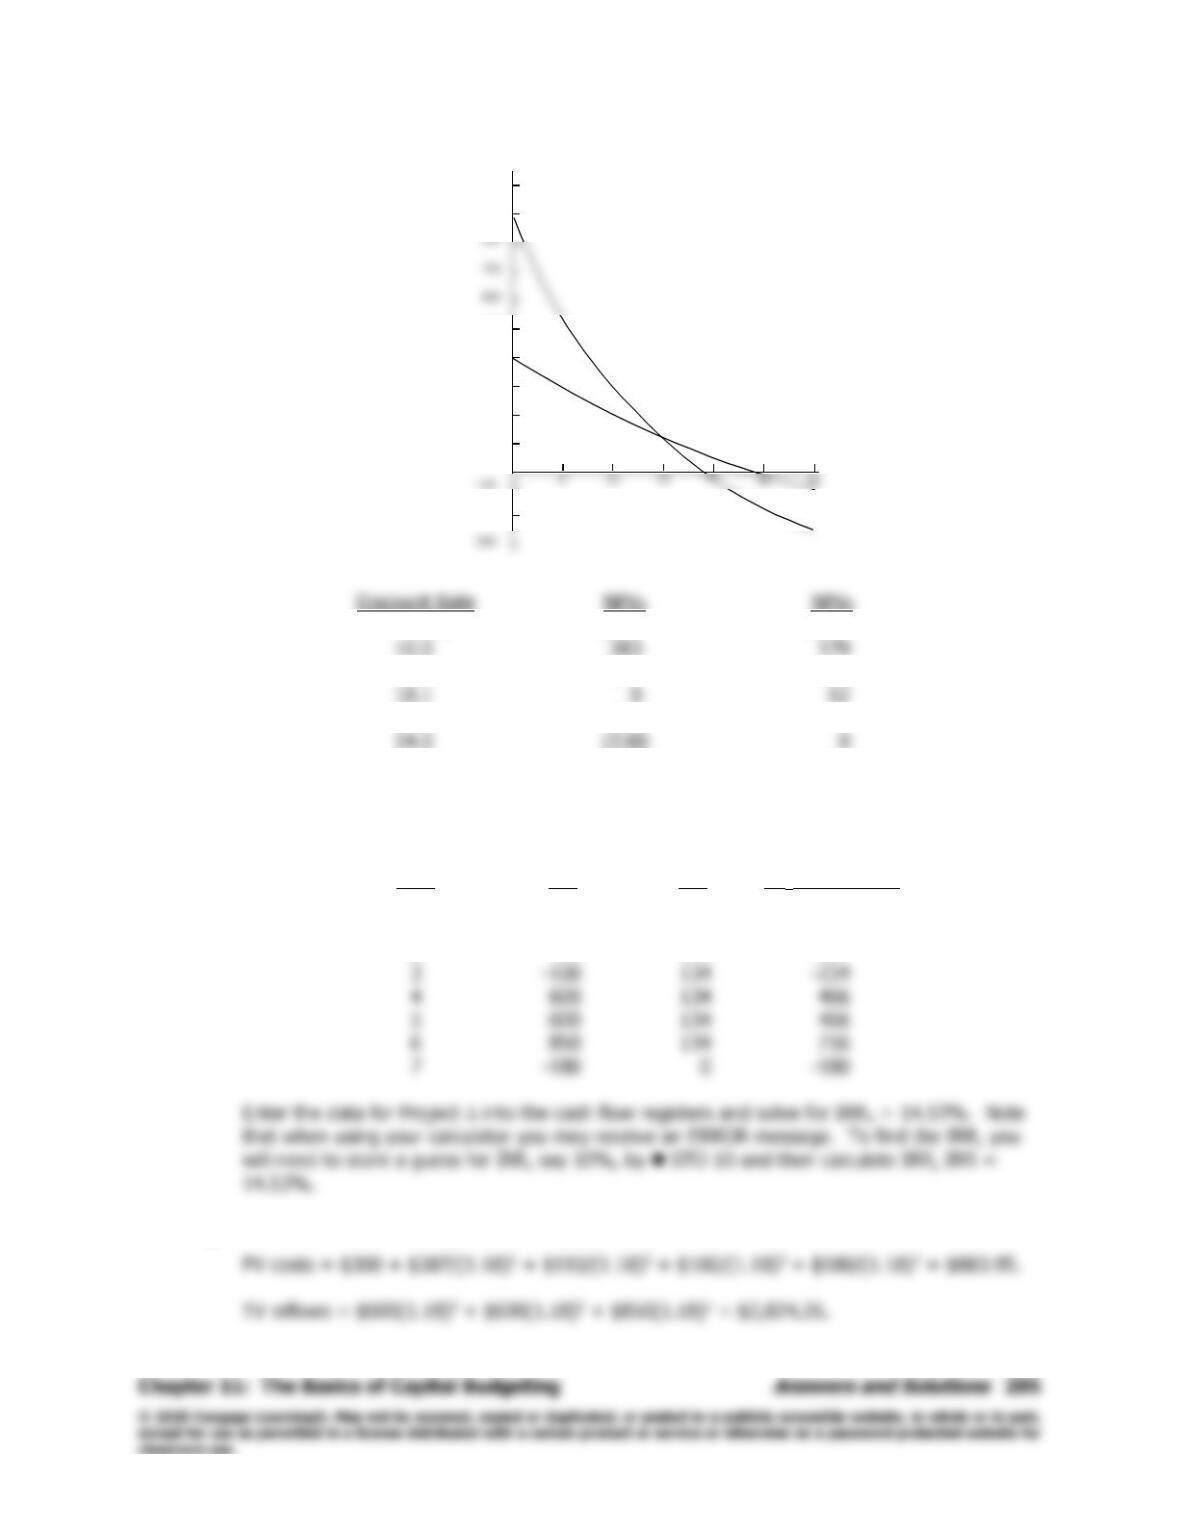
11-16 a. Using a financial calculator, enter the following data for Plan A: CF0 = –40000000; CF1-20 =
6400000; I/YR = 10; solve for NPVA = $14,486,808 and IRRA = 15.03%.
b. Using a financial calculator, calculate each plan’s NPVs at different discount rates (as shown
in the table below) and graph the NPV profiles.
Discount Rate NPV Plan A NPV Plan B
0% $88,000,000 $42,400,000
5 39,758,146 21,897,212
–20
100
NPV
(Millions of
Dollars)
The crossover rate is somewhere between 11% and 12%.
c. To calculate the crossover rate, create Project which represents the cash flow differences
between the two projects. Once those cash flows are calculated find the IRR of Project
d. The NPV method implicitly assumes that the opportunity exists to reinvest the cash flows
generated by a project at the WACC, while use of the IRR method implies the opportunity to
reinvest at the IRR. The firm will invest in all independent projects with an NPV > $0. As cash
flows come in from these projects, the firm will either pay them out to investors, or use them
11–17 a. Using a financial calculator, enter each project’s cash flows into the cash flow registers and
enter I/YR = 11. Then, you calculate each project’s NPV. At WACC = 11%, Project A has the
greater NPV, specifically $240.64 as compared to Project B’s NPV of $161.89.
b. Using a financial calculator and entering each project’s cash flows into the cash flow
registers, you would calculate each project’s IRR. IRRA = 18.1%; IRRB = 23.97%.
c. Here is the MIRR for Project A when WACC = 11%:
PV costs = $300 + $387/(1.11)1 + $193/(1.11)2 + $100/(1.11)3 + $180/(1.11)7 = $965.11.
TV inflows = $600(1.11)3 + $600(1.11)2 + $850(1.11)1 = $2,503.34.
d. WACC = 11% criteria:
Project A Project B
NPV $240.64 $161.89
The correct decision is that Project A should be chosen because NPVA > NPVB.
NPVA = $2.66; NPVB = $63.68.
e.
0.0% $890 $399
11.0 241 162
20.0 (49) 41
30.0 (238) (51)
f. To calculate the crossover rate, create Project which represents the cash flow differences
between the two projects. The IRR of Project is the crossover rate.
Year CFA CFB CF = CFA – CFB
0 –300 –405 105
1 –387 134 –521
2 –193 134 –327
g. Here is the MIRR for Project A when WACC = 18%:
1,000
900
500
400
300
200
100
-200
Cost of
Capital (%)
NPV
($)
Project A
Project B
296
Answers and Solutions
Chapter 11: The Basics of Capital Budgeting
MIRR is the discount rate that forces the TV of $2,824.26 in 7 years to equal $883.95.
Using a financial calculator enter the following inputs: N = 7; PV = -883.95; PMT = 0; and FV
= 2824.26. Then, solve for I/YR = MIRRA = 18.05%.
11–18 Facts: 5 years remaining on lease; rent = $2,000/month; 60 payments left, payment at end of
month.
a. 0 1 2 59 60
| | | • • • | |
-2,000 -2,000 -2,000 -2,000
PV cost of old lease: N = 60; I/YR = 1; PMT = -2000; FV = 0; PV = ? PV = -$89,910.08.
0 1 9 10 59 60
| | • • • | | • • • | |
0 0 -2,600 -2,600 -2,600
b. At t = 9 the FV of the original lease’s cost = -$89,910.08(1.01)9 = -$98,333.33. Since lease
payments for months 0-9 would be zero, we can calculate the lease payments during the
remaining 51 months as follows: N = 51; I/YR = 1; PV = 98333.33; and FV = 0. Solve for
PMT = -$2,470.80.
1%
1%
1%
Chapter 11: The Basics of Capital Budgeting
Answers and Solutions
297
c. Period Old Lease New Lease Lease
0 0 0 0
1-9 -2,000 0 -2,000
10–60 -2,000 -2,600 600
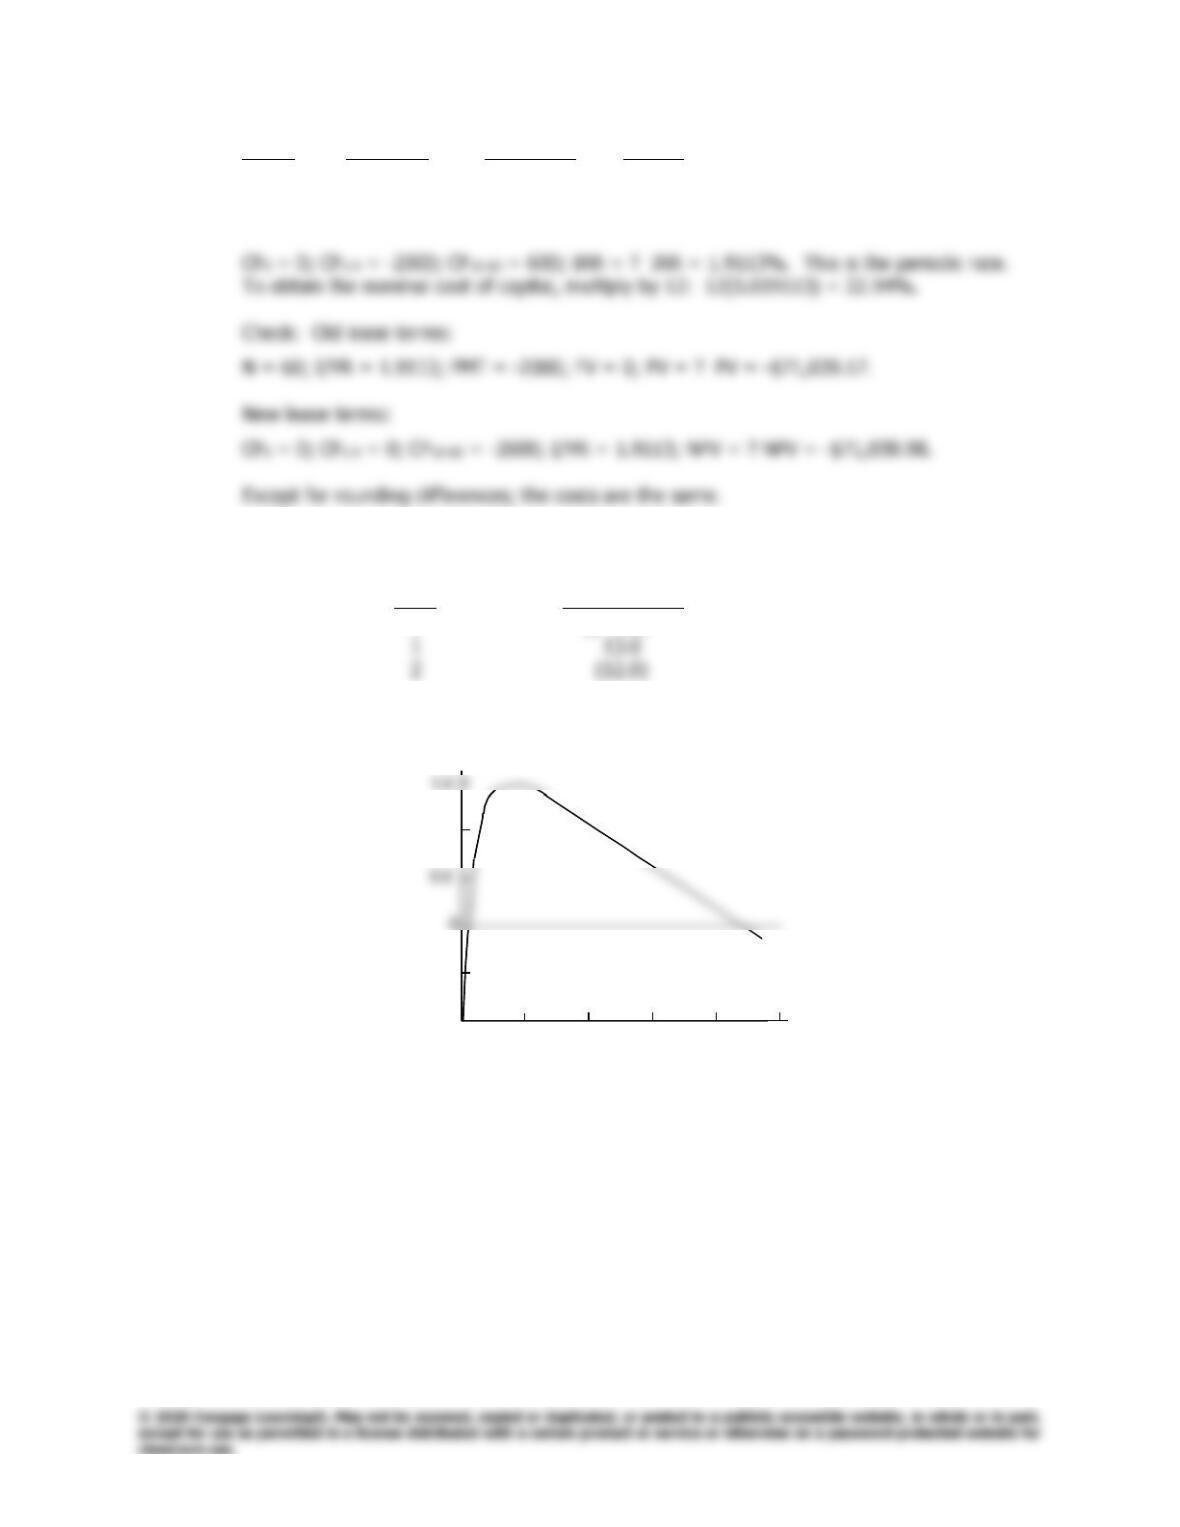
11–19 a. The project’s expected cash flows are as follows (in millions of dollars):
Time Net Cash Flow
0 ($ 2.0)
We can construct the following NPV profile:
NPV
(Millions of Dollars)
1.0
-0.5
-1.0
0 100 200 300 400 500 WACC (%)
NPV
(Millions of Dollars)
1.0
-0.5
-1.0
0 100 200 300 400 500 WACC (%)
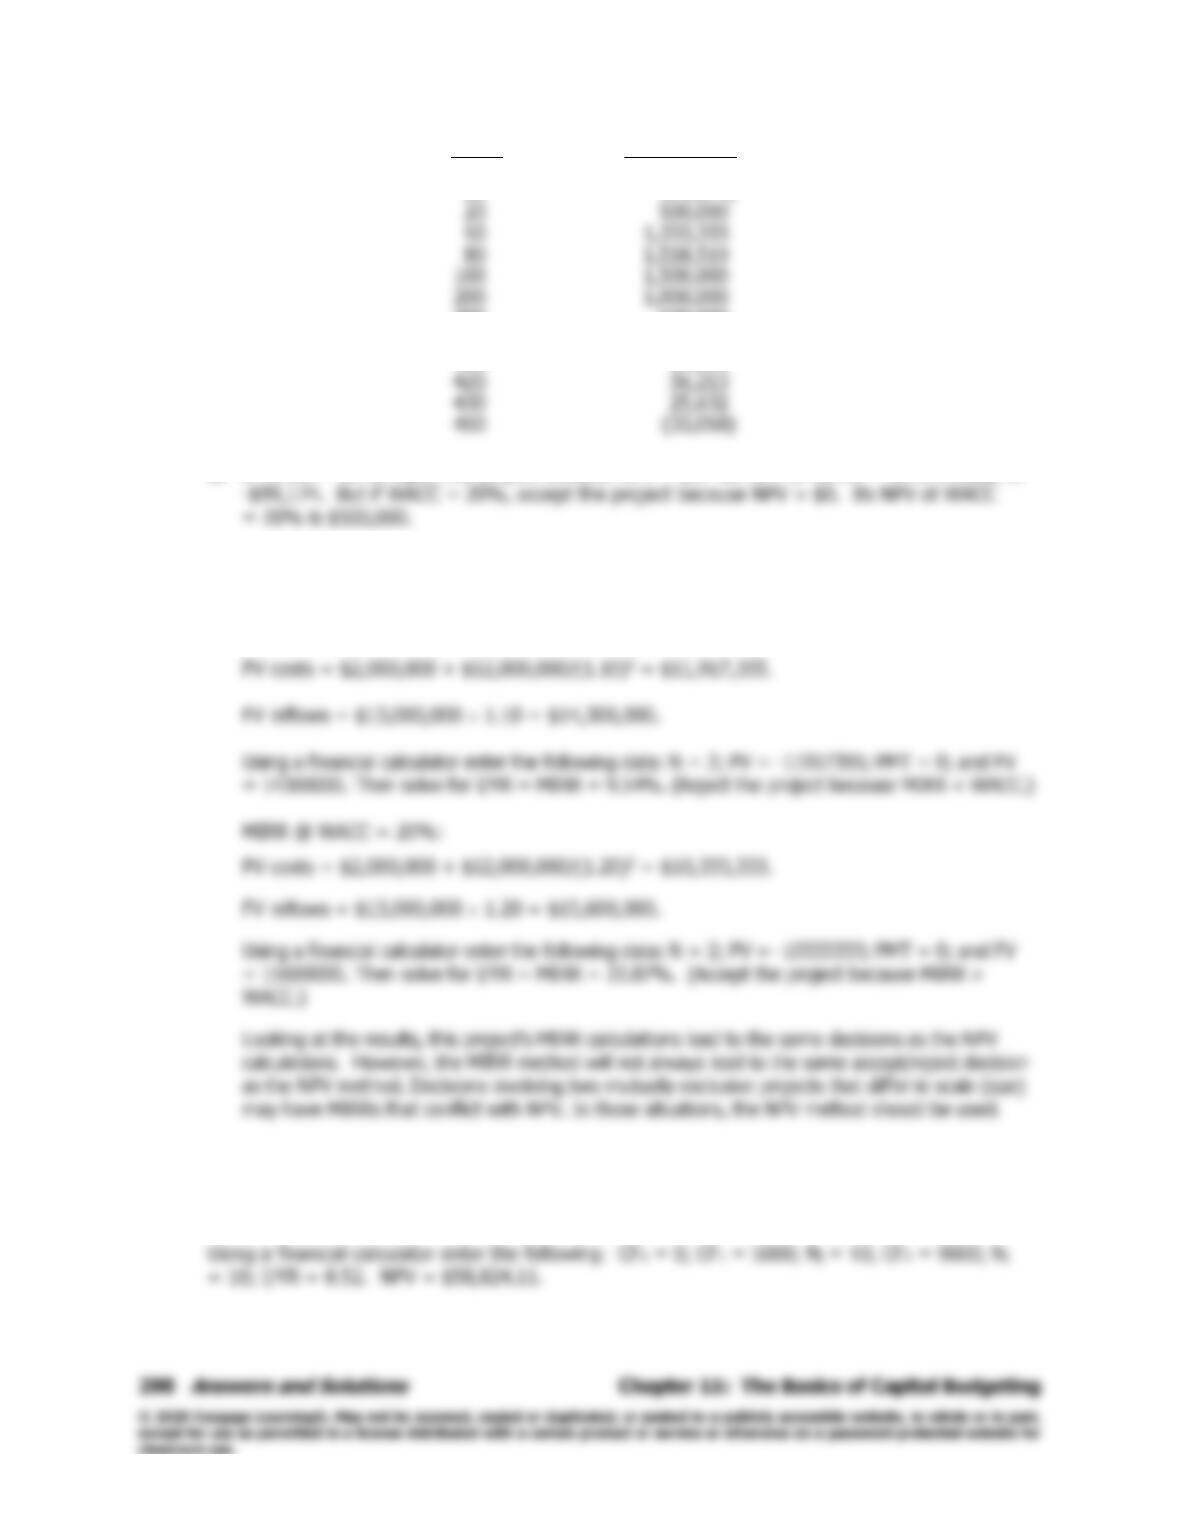
WACC NPV
0% ($1,000,000)
10 (99,174)
300 500,000
400 120,000
410 87,659
b. If WACC = 10%, reject the project because NPV < $0. Its NPV at WACC = 10% is equal to
c. Other possible projects with multiple rates of return could be nuclear power plants where
disposal of radioactive wastes is required at the end of the project’s life.
d. MIRR @ WACC = 10%:
11–20 Because the IRR is the discount rate at which the NPV of a project equals zero, the project’s
inflows can be evaluated at the IRR and the present value of these inflows must equal the
initial investment.
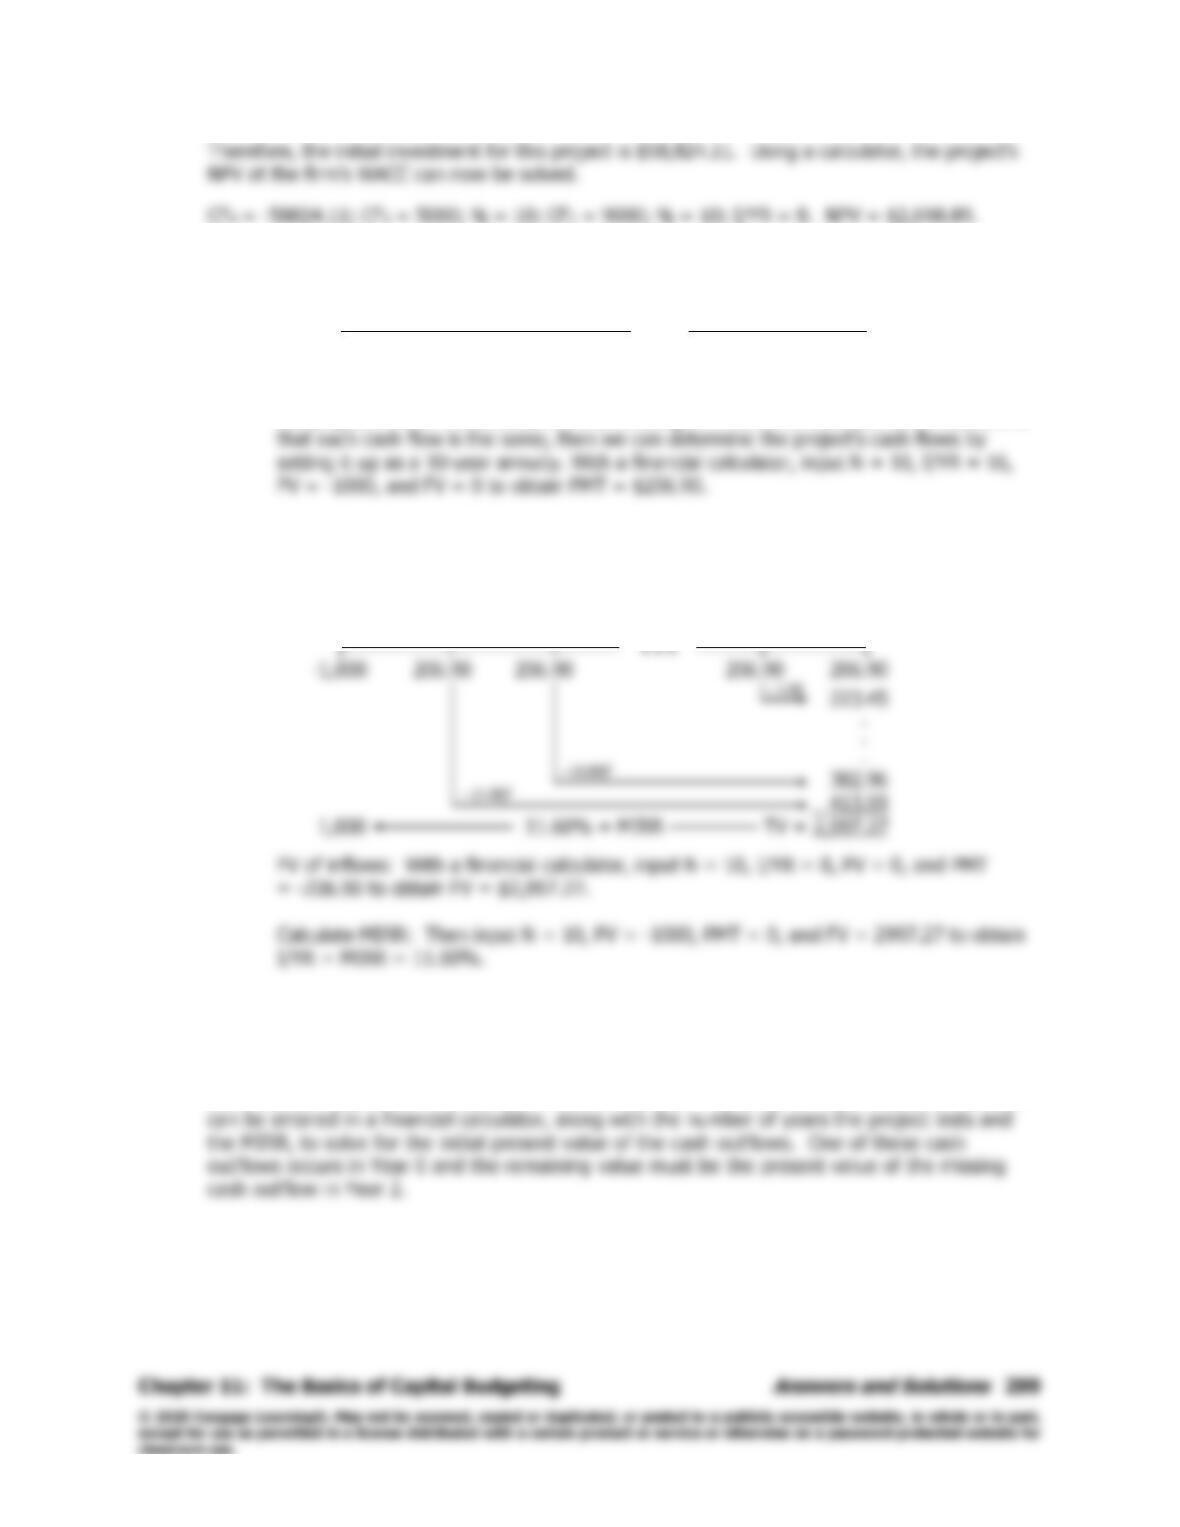
11–21 Step 1: Determine the PMT:
0 1 10
| | • • • |
-1,000 PMT PMT
The IRR is the discount rate at which the NPV of a project equals zero. Since we know
the project’s initial investment, its IRR, the length of time that the cash flows occur, and
Step 2: We’ve been given the WACC, so once we have the project’s cash flows we can now
calculate the project’s MIRR.
Calculate the project’s MIRR:
0 1 2 9 10
11–22 The MIRR can be solved with a financial calculator by finding the terminal future value of the
cash inflows and the initial present value of cash outflows and solving for the discount rate that
equates these two values. In this instance, the MIRR is given, but a cash outflow is missing
and must be calculated. Therefore, if the terminal future value of the cash inflows is found, it
16%
8%

300
Answers and Solutions
Chapter 11: The Basics of Capital Budgeting
Cash Inflows Compounding Rate FV in Year 5 @ 10%
CF1 = $202 (1.10)4 $ 295.75
The total present value of cash outflows is $706.62, and since the outflow for Year 0 is $500, the