Chapter 11
PERFORMANCE AND STRATEGY IN COMPETITIVE MARKETS
QUESTIONS AND ANSWERS
Q11.1 Your best income-earning opportunity appears to be an offer to work for a local
developer during the month of June and earn $2,000. However, before taking the
job, you accept a surprise offer from a competitor. If you actually earn $2,600
during the month, how much producer surplus have you earned? Explain.
Q11.1 ANSWER
Q11.2 Assume that you are willing to pay $1,100 for a new personal computer that has all
the “bells and whistles.” On the Internet, you buy one for the bargain price of $900.
Unbeknownst to you, the Internet retailer’s marginal cost was only $750. How much
consumer surplus, producer surplus, and net addition to social welfare stems from
your purchase? Explain.
Q11.2 ANSWER
Consumer surplus is the amount that consumers are willing to pay for a good or
service minus the amount that they are required to pay. Consumer surplus represents
320 Chapter 11
Q11.3 After having declined during the 1970s and 1980s, the proportion of teenage smokers
in the United States has risen sharply since the early-1990s. To reverse this trend,
advertising programs have been launched to discourage teenage smoking, penalties
for selling cigarettes to teenagers have been toughened, and the excise tax on
cigarettes has been increased. Explain how each of these public policies affects
demand for cigarettes by teenagers.
Q11.3 ANSWER
Like any drug interdiction program, advertising programs designed to discourage
teenage smoking can have a favorable effect by causing an inward shift in the
Performance and Strategy in Competitive Markets 321
Q11.4 In 2004, OPEC reduced the quantity of oil it was willing to supply to world markets.
Explain why the resulting price increase was much larger in the short run than in the
long run.
Q11.4 ANSWER
The supply and demand for oil are relatively inelastic in the short run, but fairly
elastic in the long run. In the short run, oil supply is quite inelastic because it takes
Q11.5 The demand for basic foodstuffs, like feed grains, tends to be inelastic with respect to
price. Use this fact to explain why highly fertile farmland will fetch a relatively high
price at any point in time, but that rising farm productivity over time has a negative
overall influence on farmland prices.
Q11.5 ANSWER
At any point in time, farmers with especially fertile farmland earn economic rents
because of the superior productivity of their soil. Even in competitive long-run
Q11.6 In 1990, Congress adopted a luxury tax to be paid by buyers of high-price cars,
yachts, private airplanes, and jewelry. Proponents saw the levy as an effective means
of taxing the rich. Critics pointed out that those bearing the hardship of a tax may or
may not be the same as those who pay the tax (the point of tax incidence). Explain
322 Chapter 11
how the elasticities of supply and demand in competitive markets can have direct
implications for the ability of buyers and sellers to shift the burden of taxes imposed
upon them. Also explain how elasticity information has implications for the amount
of social welfare lost due to the deadweight loss of taxation.
Q11.6 ANSWER
When Congress passed the luxury tax, the goal was to raise revenues from those who
could most easily afford to pay for government services, the rich. Unfortunately,
because the demand for new luxury items produced and sold in the United States is
Q11.7 Both employers and employees pay Social Security (FICA) on wage income. While
the burden of this tax is designed to be borne equally by employers and employees, is
a straight 50/50 sharing of the FICA tax burden likely? Explain.
Q11.7 ANSWER
Performance and Strategy in Competitive Markets 323
Q11.8 The Fair Labor Standards Act establishes a federal minimum wage of $7.25 per hour
effective July 24, 2009. Use your knowledge of market equilibrium and the elasticity
of demand to explain how an increase in the minimum wage could have no effect on
unskilled worker income. When will increasing the minimum wage have an income–
increasing effect versus an income-decreasing effect. Which influence is more
likely?
Q11.8 ANSWER
Federal minimum wage policy is an important economic and social concern. As
such, it is a special focus of the economic analysis of markets for labor and other
324 Chapter 11
Q11.9 The New York City Rent Stabilization Law of 1969 established maximum rental rates
for apartments in New York City. Explain how such controls can lead to shortages,
especially in the long run, and other economic costs. Despite obvious disadvantages,
why does rent control remain popular?
Q11.9 ANSWER
Ostensibly, the goal of rent control is to make housing more affordable, especially for
the elderly and the poor. Since the supply of apartments is fixed (perfectly inelastic)
in the short run, imposition of rent controls has little effect on short-run supply. In
the long run, however, landlords can decided whether or not to exit the rental
Q11.10 Wal-Mart founder Sam Walton amassed an enormous fortune in discount retailing,
one of the most viciously competitive markets imaginable. How is this possible?
Q11.10 ANSWER
In long-run equilibrium, the typical firm in a competitive market is only able to earn
Performance and Strategy in Competitive Markets 325
During the last quarter of the twentieth century, Wal-Mart grew to dominate the
discount retailing business and became one of the most enormous success stories in
corporate America. Wal-Mart is clearly much more efficient than the typical retailer,
SELF-TEST PROBLEMS AND SOLUTIONS
ST11.1 Social Welfare. A number of domestic and foreign manufacturers produce
replacement parts and components for personal computer systems. With exacting
user specifications, products are standardized and price competition is brutal. To
illustrate the net amount of social welfare generated in this hotly competitive market,
assume that market supply and demand conditions for replacement tower cases can
be described as:
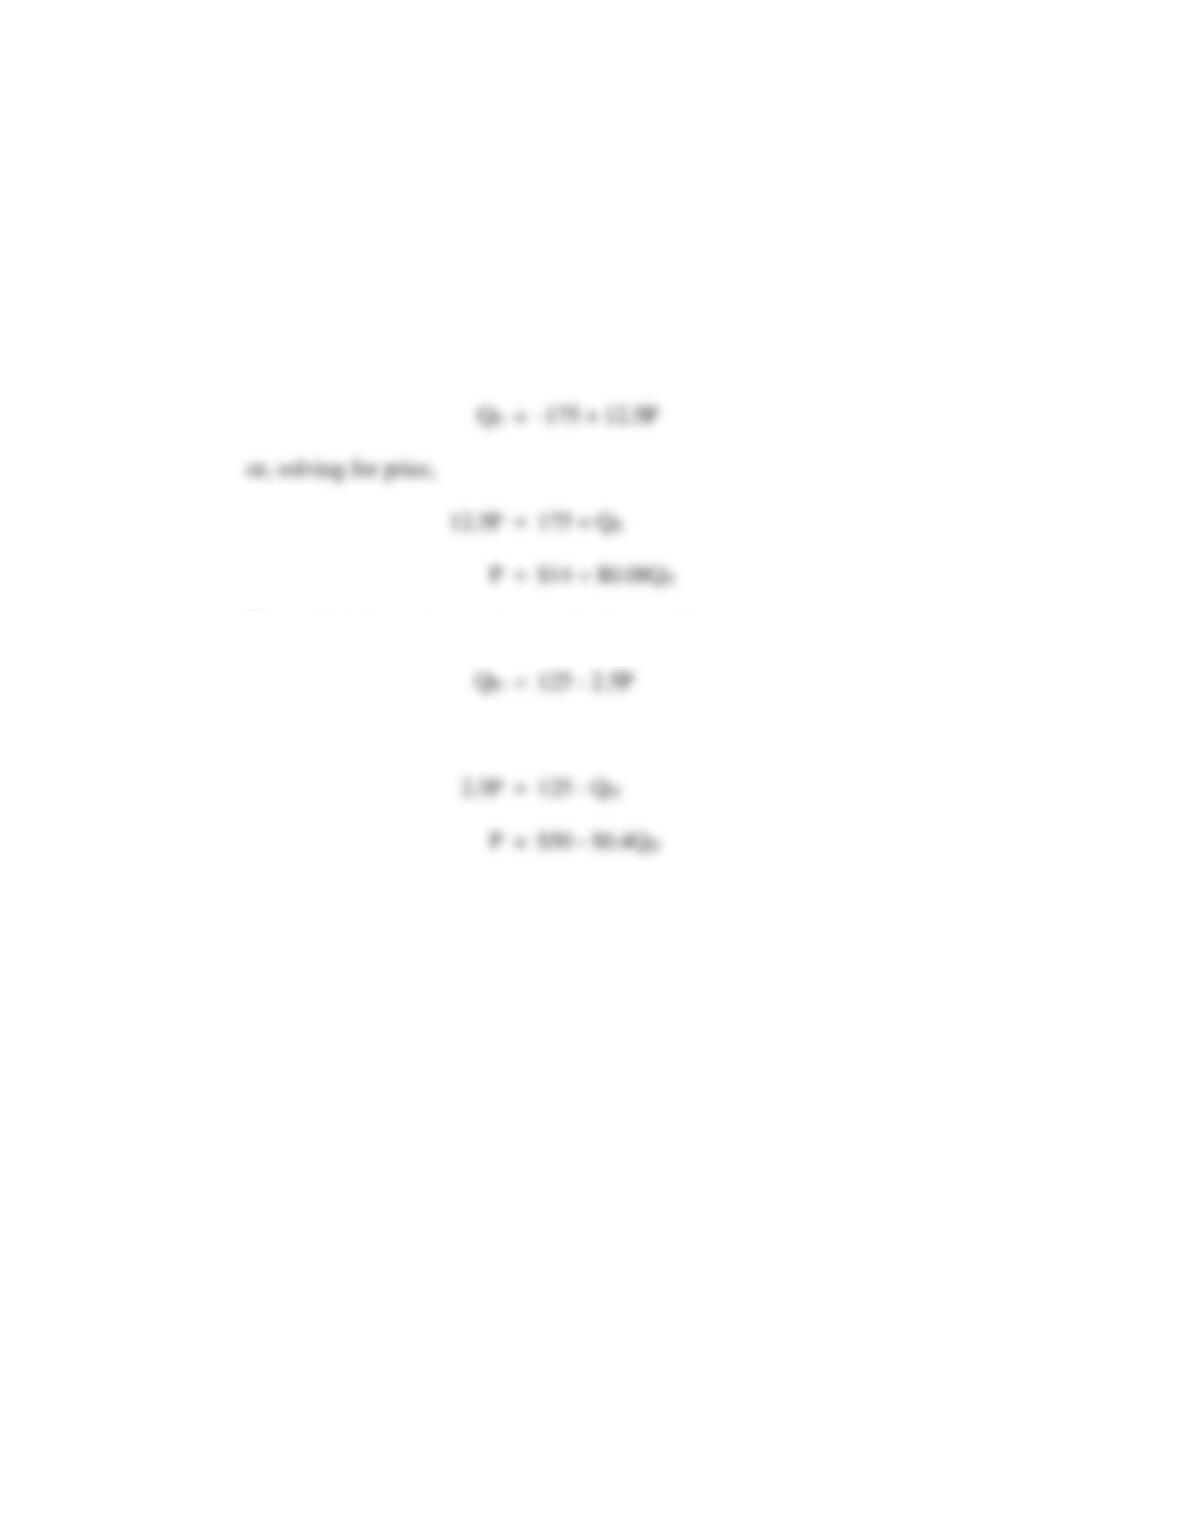
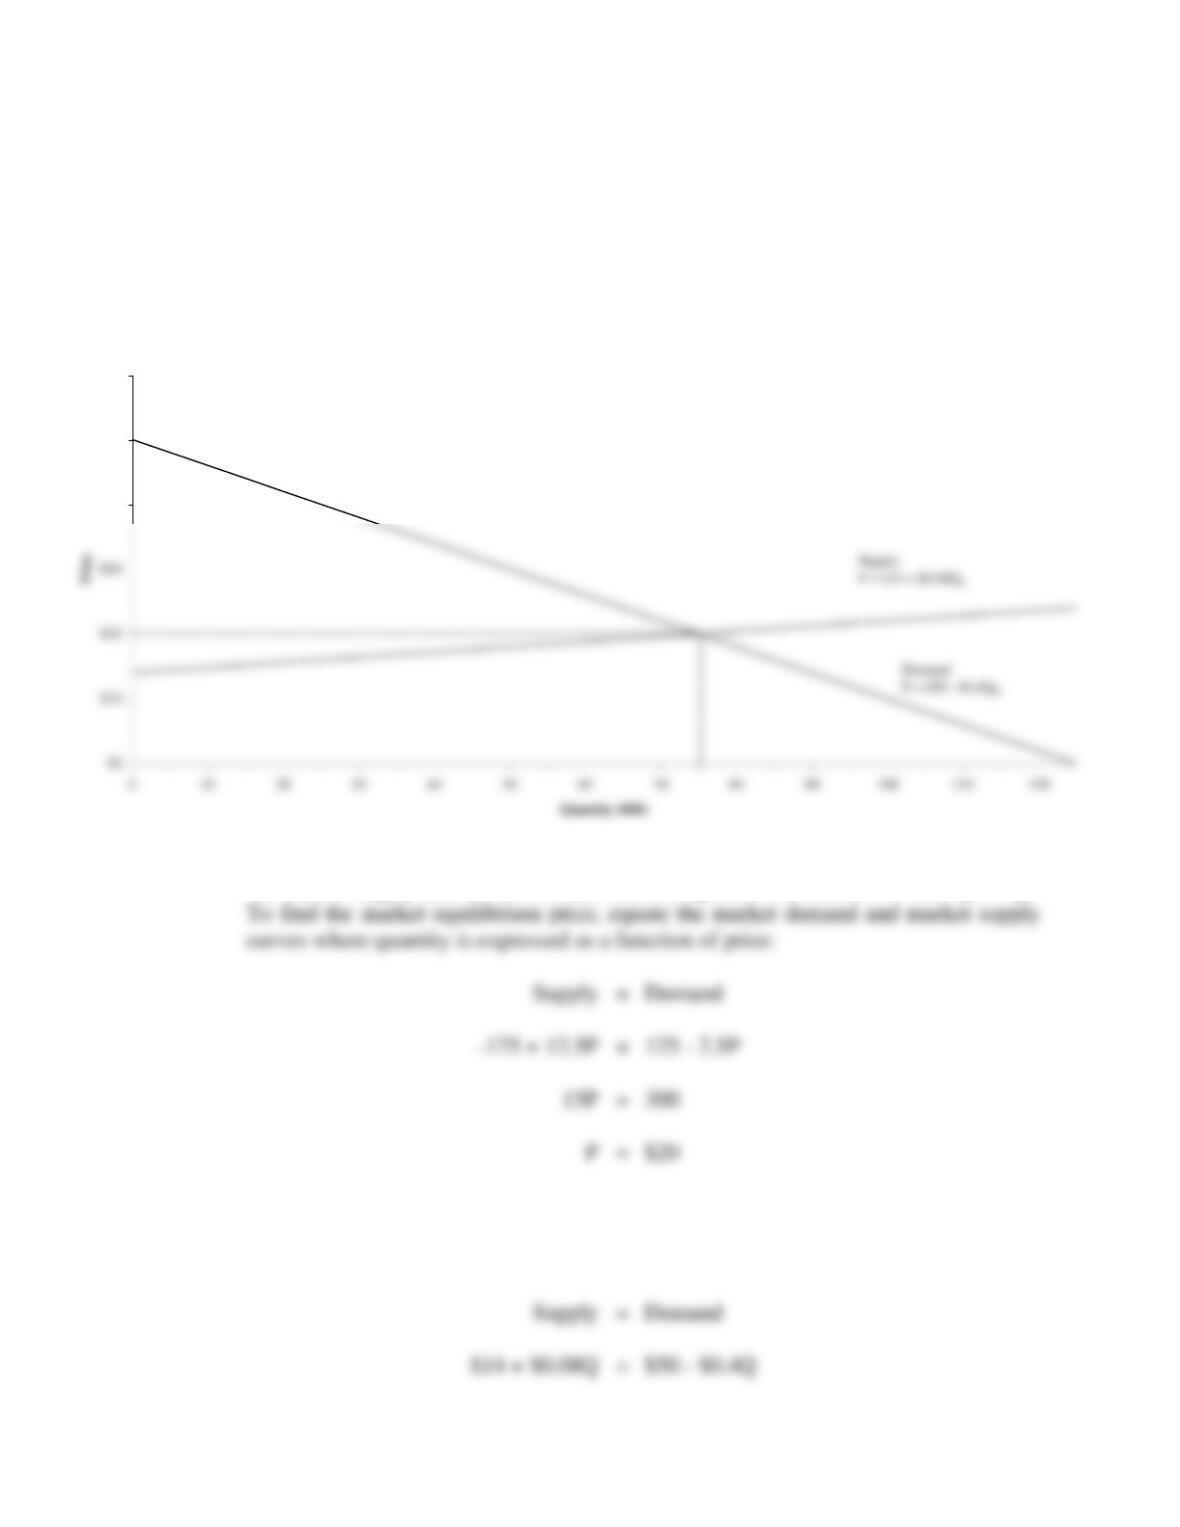
QS = -175+ 12.5P (Market Supply)
QD = 125 – 2.5P (Market Demand)
where Q is output in thousands of units and P is price per unit.
A. Graph and calculate the equilibrium price/output solution.
326 Chapter 11
B. Use this graph to help you algebraically determine the amount of consumer
surplus, producer surplus and net social welfare generated in this market.
ST11.1 SOLUTION
A. The market supply curve is given by the equation
The market demand curve is given by the equation
or, solving for price,
Graphically, demand and supply curves appear as follows:
Performance and Strategy in Competitive Markets 327
Algebraically, to find the market equilibrium levels for price and quantity, simply set
the market supply and market demand curves equal to one another so that QS = QD.
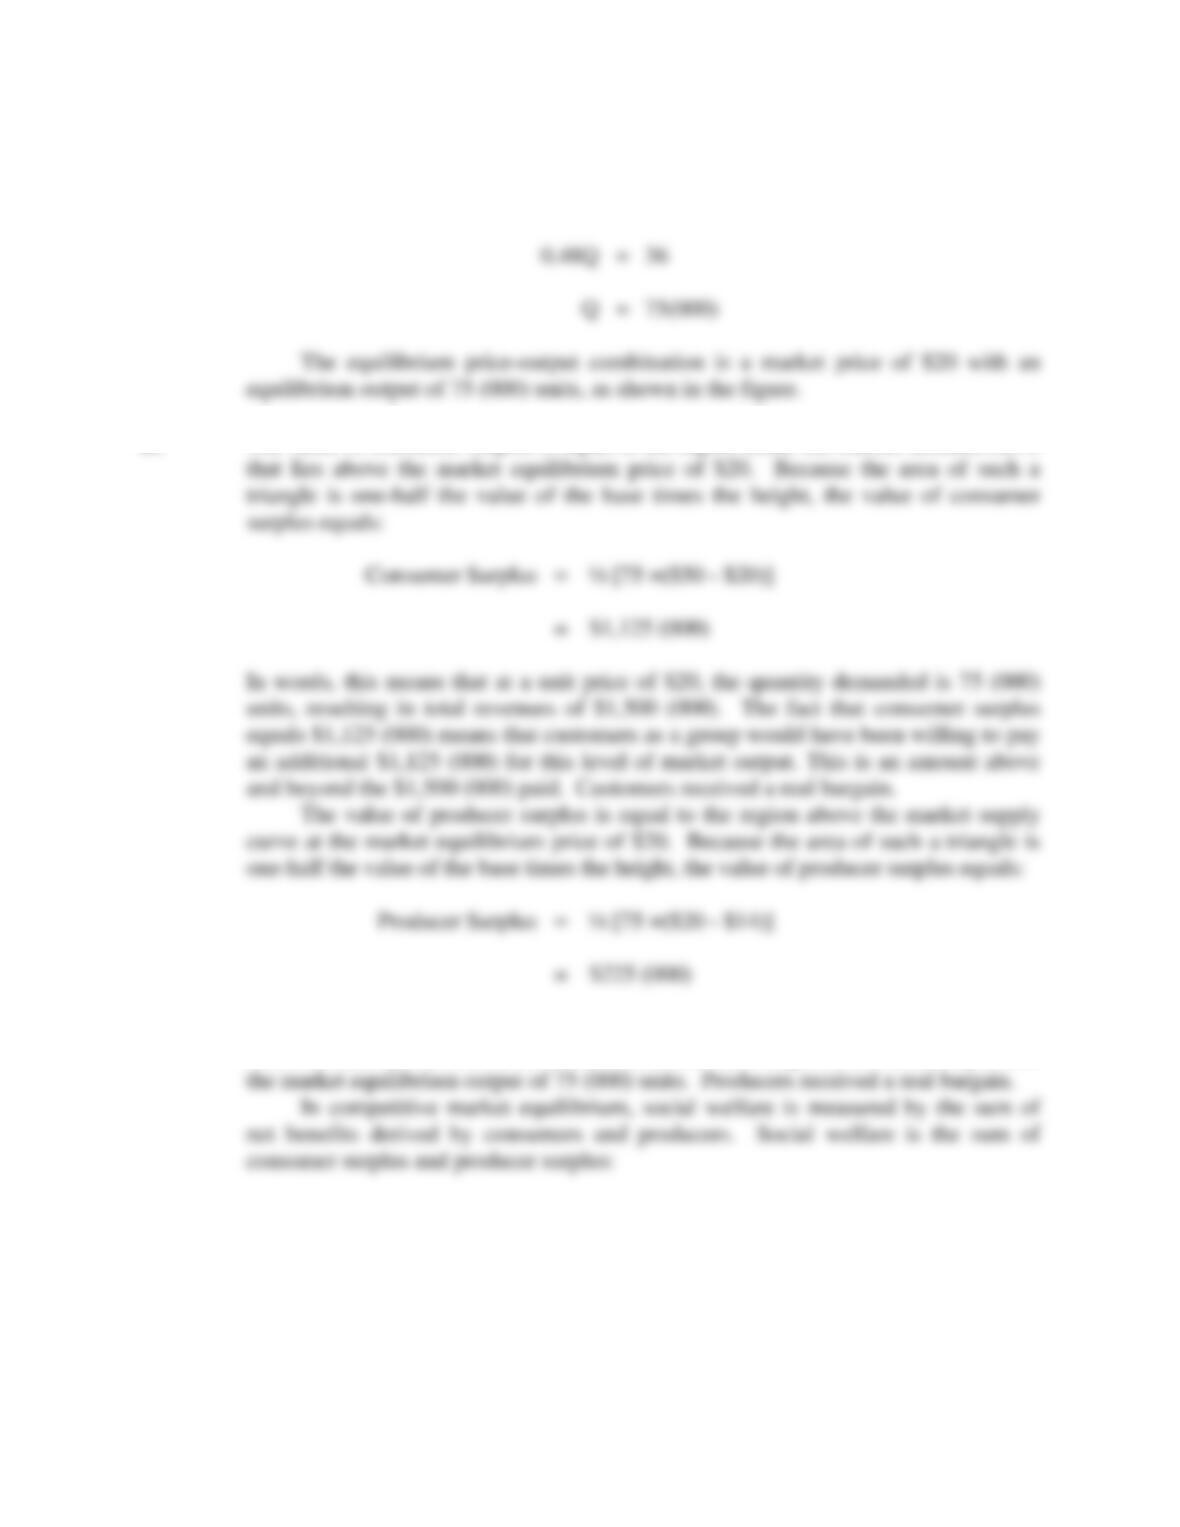
To find the market equilibrium quantity, set equal the market supply and
market demand curves where price is expressed as a function of quantity, and QS =
QD:
Replacement Computer Tower Equilibrium
$40
$50
$60
328 Chapter 11
B. The value of consumer surplus is equal to the region under the market demand curve
At a unit price of $20, producer surplus equals $225 (000). Producers as a group
received $225 (000) more than the absolute minimum required for them to produce
ST11.2 Price Ceilings. The local government in a West Coast college town is concerned
about a recent explosion in apartment rental rates for students and other low-income
renters. To combat the problem, a proposal has been made to institute rent control
that would place a $900 per month ceiling on apartment rental rates. Apartment
supply and demand conditions in the local market are:
QS = -400+ 2P (Market Supply)
QD = 5,600 – 4P (Market Demand)
where Q is the number of apartments and P is monthly rent.
A. Graph and calculate the equilibrium price/output solution. How much
consumer surplus, producer surplus, and social welfare is produced at this
activity level?
B. Use the graph to help you algebraically determine the quantity demanded,
quantity supplied, and shortage with a $900 per month ceiling on apartment
rental rates.
C. Use the graph to help you algebraically determine the amount of consumer and
producer surplus with rent control.
D. Use the graph to help you algebraically determine the change in social welfare
and deadweight loss in consumer surplus due to rent control.
ST11.2 SOLUTION
A. The competitive market supply curve is given by the equation
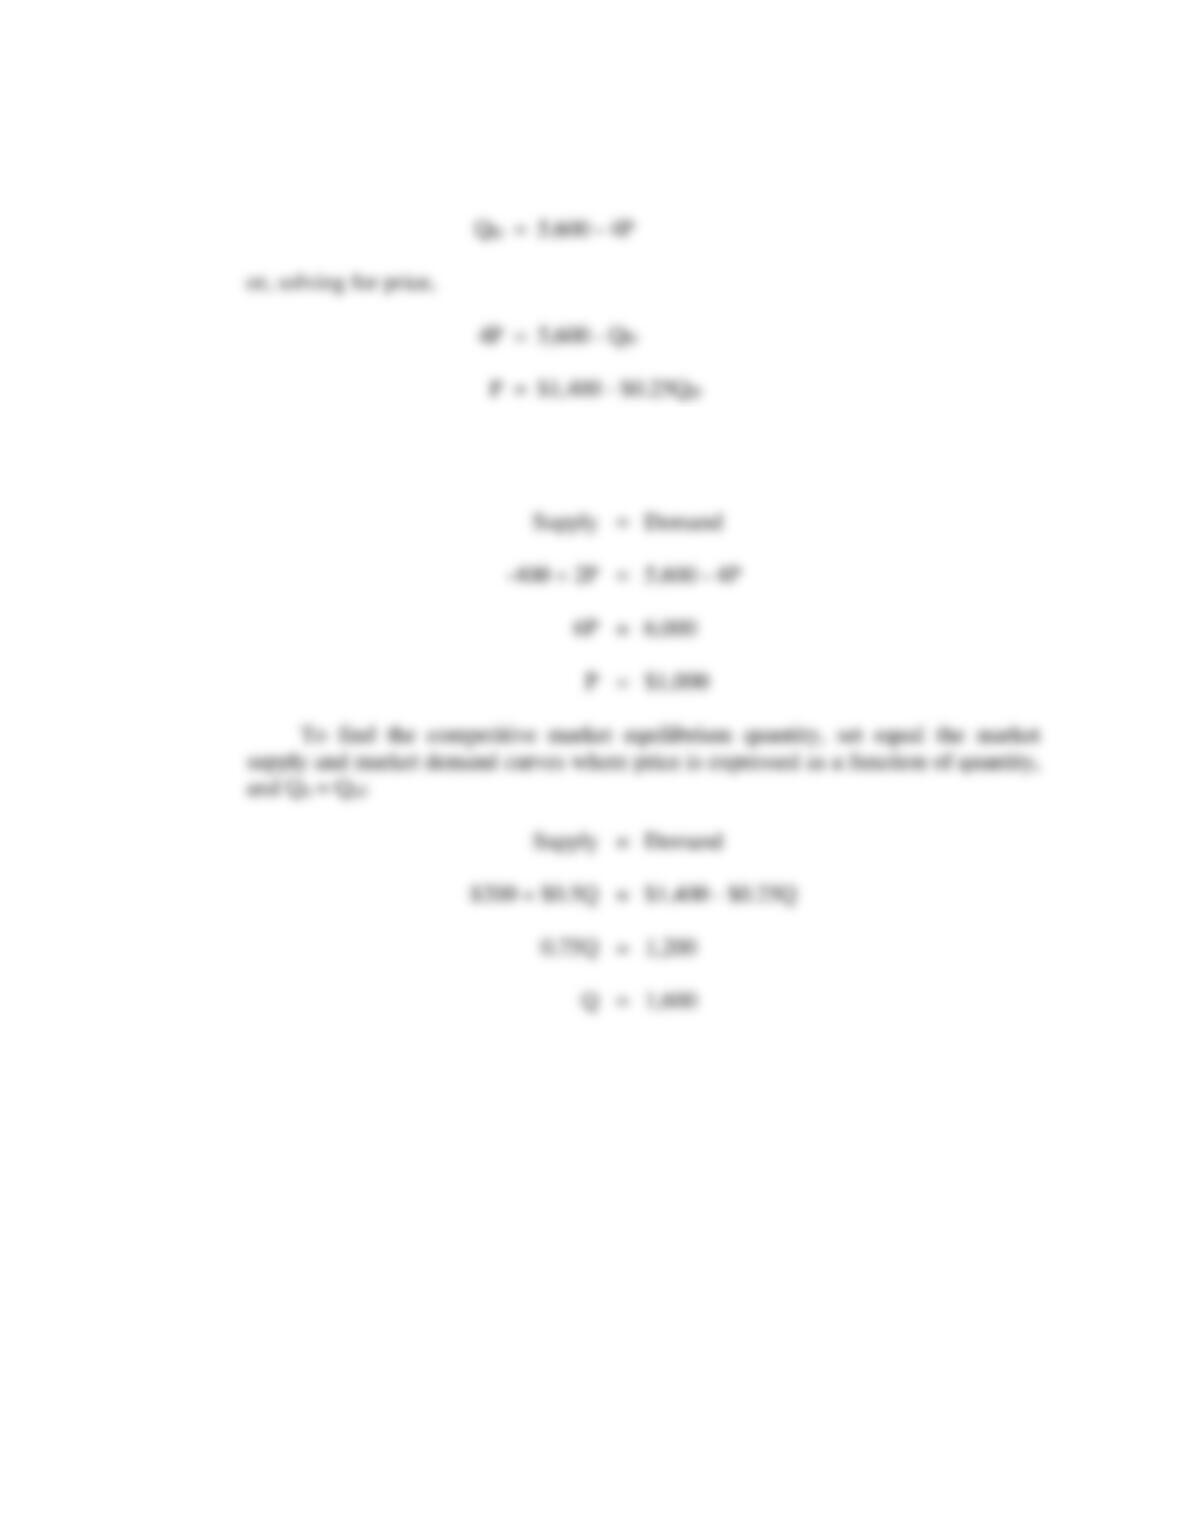
The competitive market demand curve is given by the equation
330 Chapter 11
To find the competitive market equilibrium price, equate the market demand
and market supply curves where quantity is expressed as a function of price:
Therefore, the competitive market equilibrium price-output combination is a
market price of $1,000 with an equilibrium output of 1,600 units.
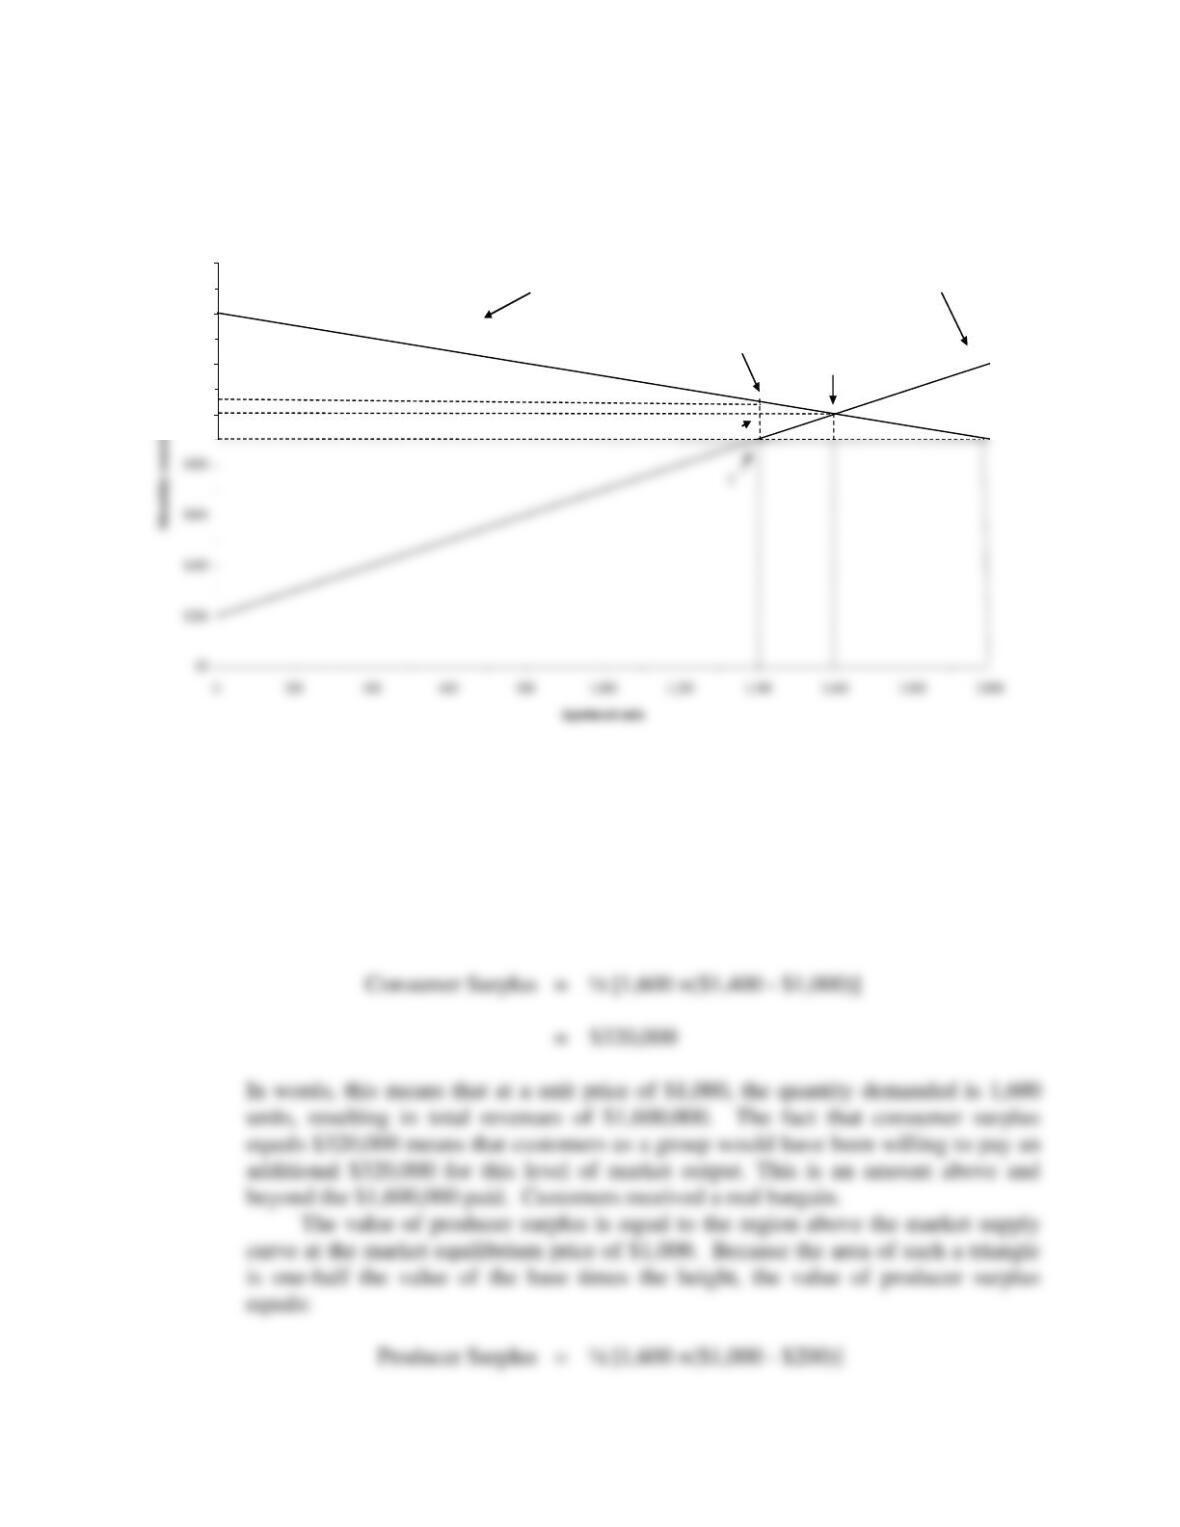
Performance and Strategy in Competitive Markets 331
The value of consumer surplus is equal to the region under the market demand
curve that lies above the market equilibrium price of $1,000. Because the area of
such a triangle is one-half the value of the base times the height, the value of
consumer surplus equals:
Apartment Rental Equilibrium
$1,000
$1,200
$1,400
$1,600
Demand
P = $1,400 – $0.25QD
Supply
P = $200 + $0.5QS
A
B
D
332 Chapter 11
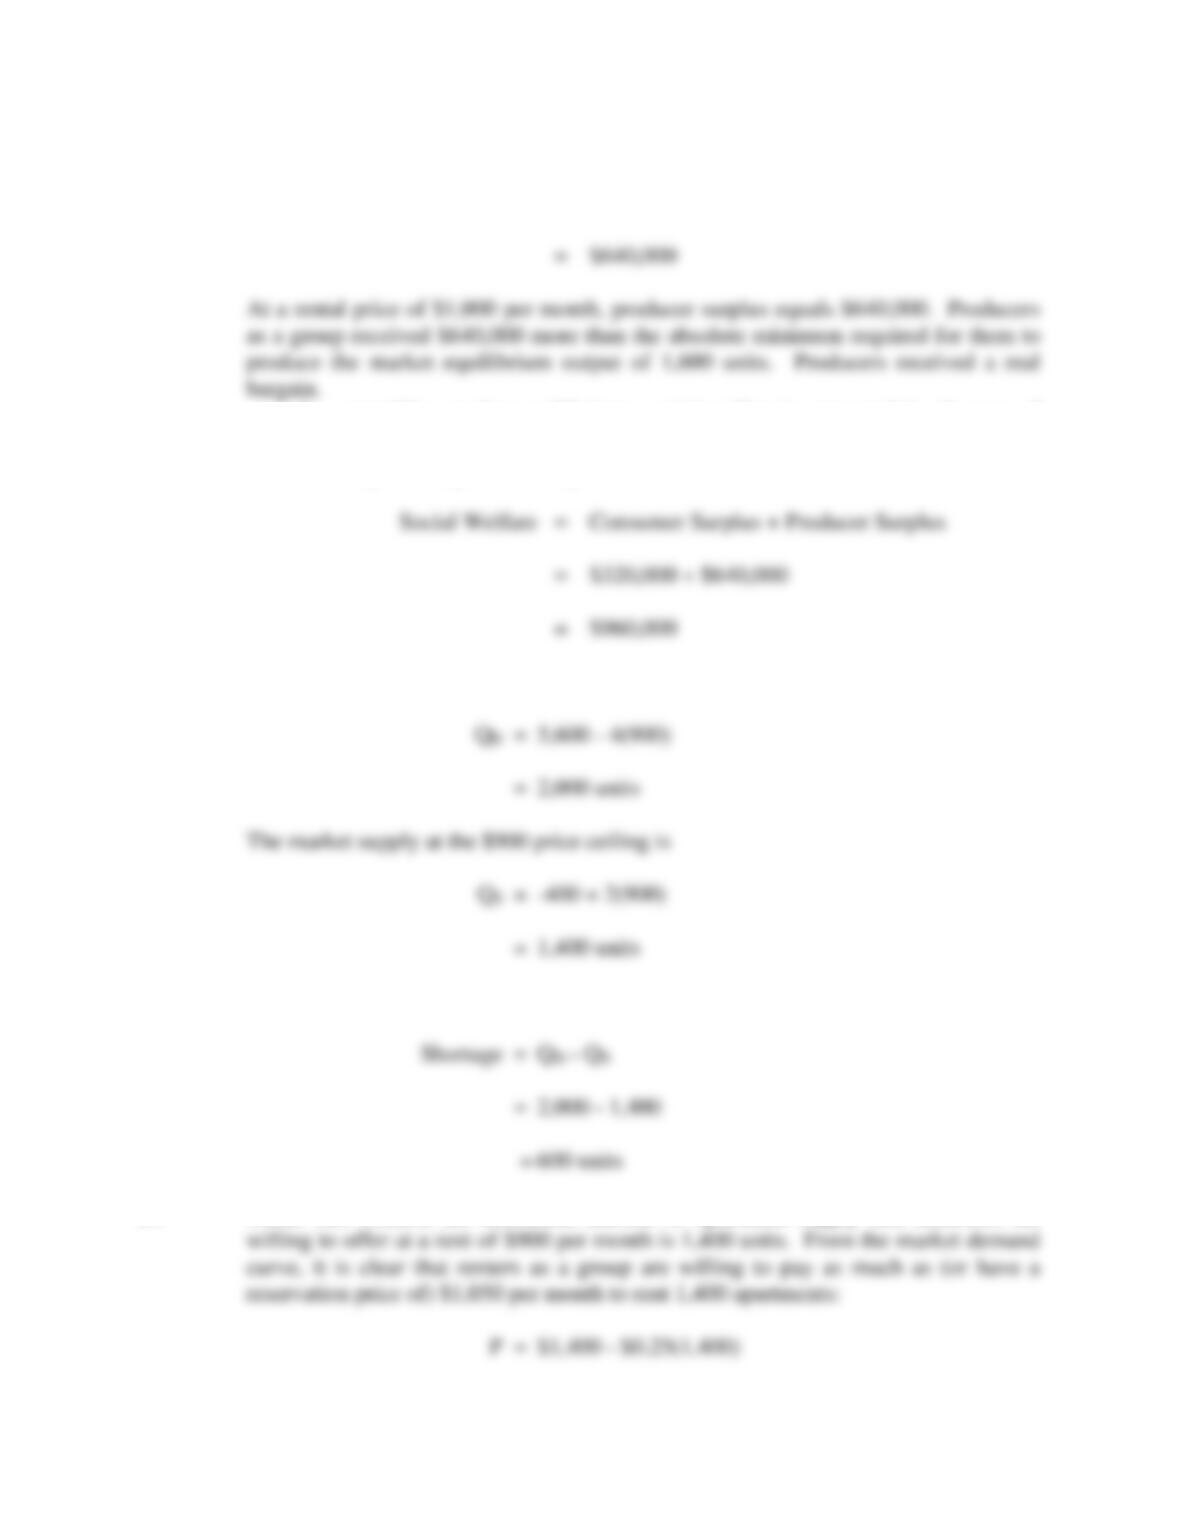
In competitive market equilibrium, social welfare is measured by the sum of
net benefits derived by consumers and producers. Social welfare is the sum of
consumer surplus and producer surplus:
B. The market demand at the $900 price ceiling is
The market shortage created by the $900 price ceiling is
C. Under rent control, the maximum amount of apartment supply that landlords are
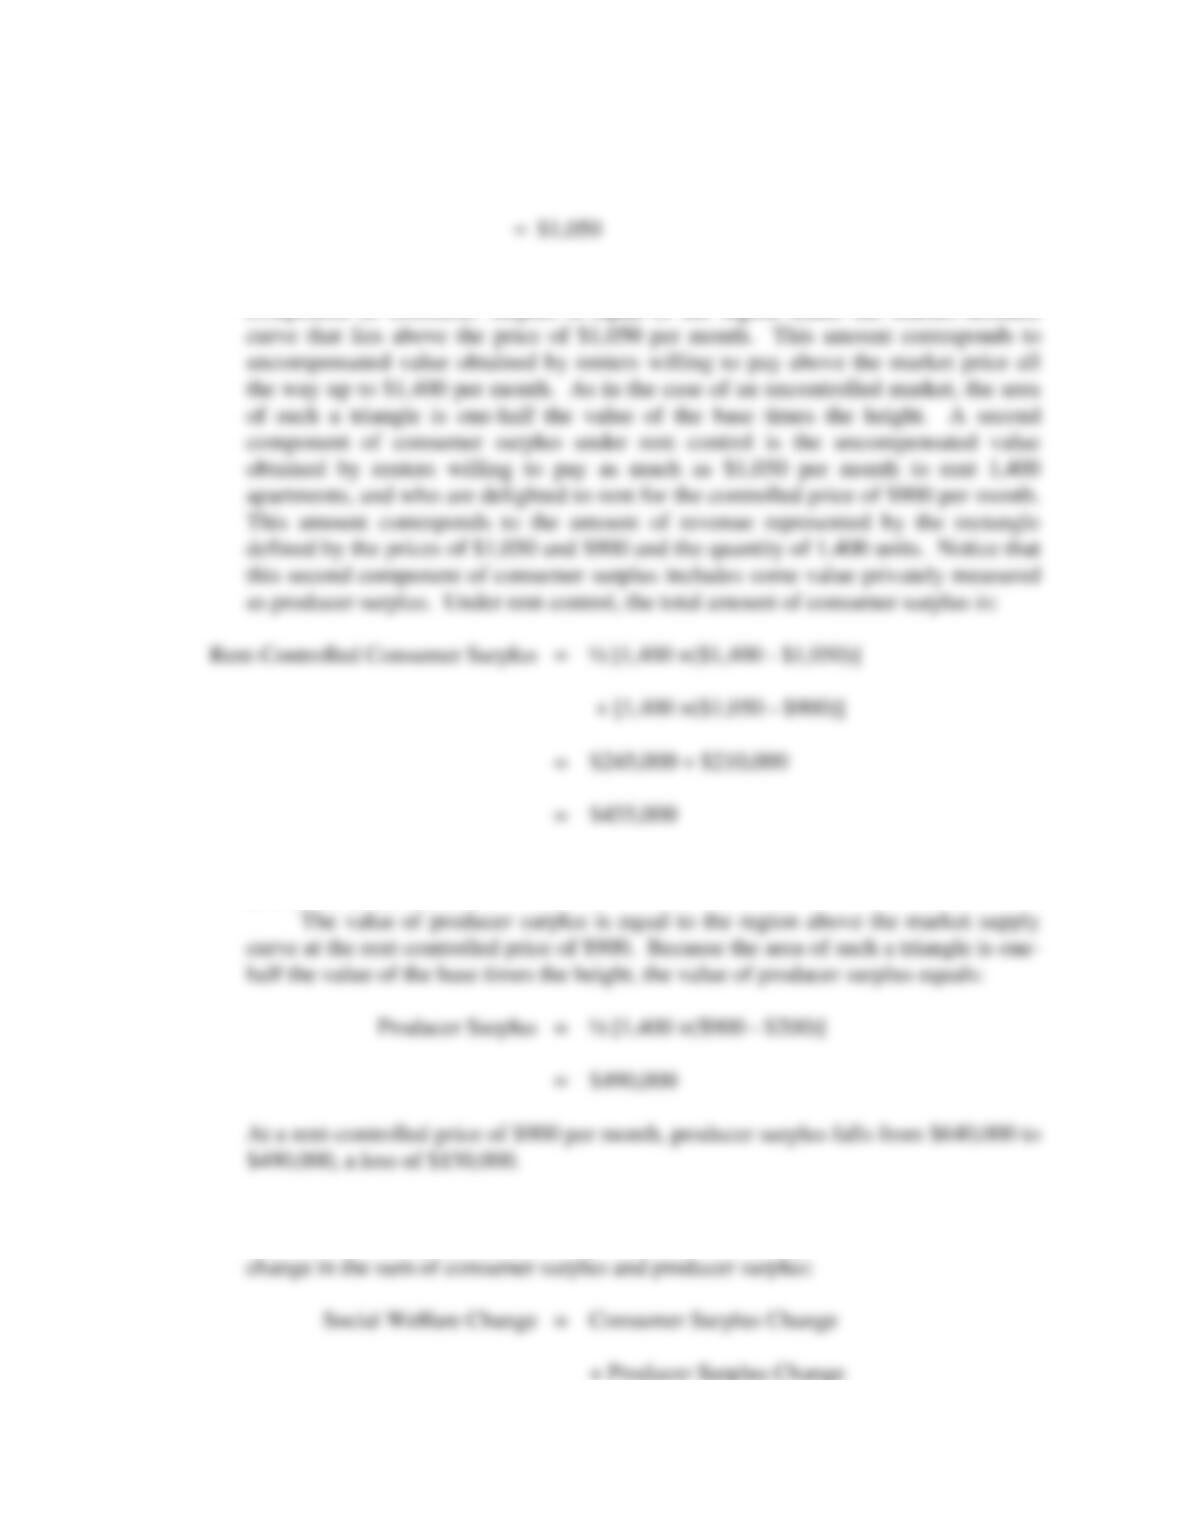
Performance and Strategy in Competitive Markets 333
Under rent control, the value of consumer surplus has two components. A first
component of consumer surplus is equal to the region under the market demand
In this case, consumer surplus rises from $320,000 to $455,000, a gain of $135,000
as a result of rent control.
D. The change in social welfare caused by rent control is measured by the change in net
benefits derived by consumers and producers. The change in social welfare is the
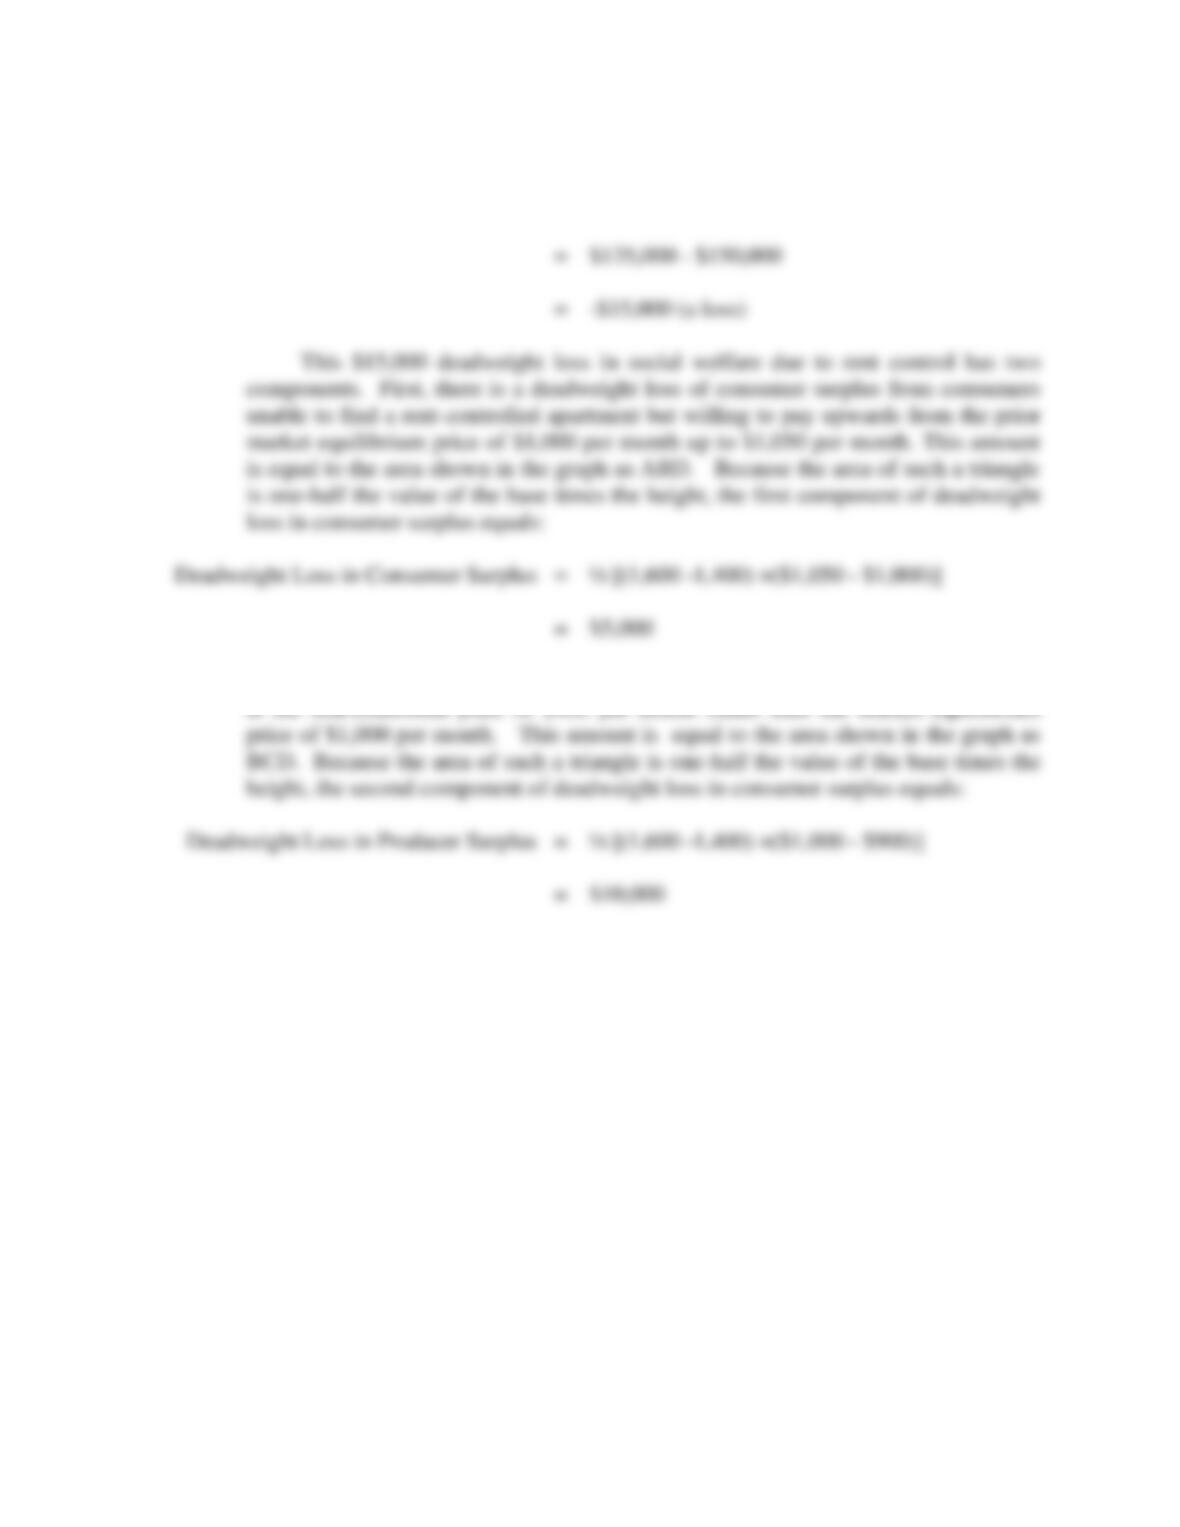
334 Chapter 11
Second, there is a deadweight loss of producer surplus from landlords forced to rent
PROBLEMS AND SOLUTIONS
P11.1 Social Welfare Concepts. Indicate whether each of the following statements is true
or false, and explain why.
A. In competitive market equilibrium, social welfare is measured by the net
benefits derived from consumption and production as measured by the
difference between consumer surplus and producer surplus.
B. The market supply curve indicates the minimum price required by sellers as a
group to bring forth production.
C. Consumer surplus is the amount that consumers are willing to pay for a given
good or service minus the amount that they are required to pay.
D. Whereas consumer surplus is closely related to the supply curve for a product,
producer surplus is closely related to the demand curve for a product.
Performance and Strategy in Competitive Markets 335
E. Producer surplus is the net benefit derived by producers from production.
P11.1 SOLUTION
good or service minus the amount that they are required to pay. Consumer surplus
represents value derived from consumption that consumers are able to enjoy at zero
cost. It also describes the net benefit derived by consumers from consumption,
where net benefit is measured in the eyes of the consumer. From the standpoint of
society as a whole, consumer surplus is an attractive measure of the economic well–
being of consumers.
P11.2 Labor Policy. People of many different age groups and circumstances take
advantage of part-time employment opportunities provided by the fast-food industry.
Given the wide variety of different fast-food vendors, the industry is fiercely
competitive, as is the unskilled labor market. In each of the following circumstances,
indicate whether the proposed changes in government policy are likely to have an
increasing, a decreasing, or an uncertain effect on employment in this industry.
A. Elimination of minimum wage law coverage for those working less than 20
hours per week.
B. An increase in spending for education that raises basic worker skills.
336 Chapter 11
C. An increase in the employer portion of federally-mandated FICA insurance
costs.
D. A requirement that employers install expensive new worker-safety equipment.
E. A state requirement that employers pay 8% of wages to fund a new national
health-care program.
P11.2 SOLUTION
A. Uncertain. Elimination of minimum wage coverage for those working less than 20
D. Uncertain. A requirement that employers install expensive new worker-safety
equipment has an uncertain effect on employment opportunities. Generally speaking,
P11.3 Social Welfare. Natural gas is in high demand as a clean-burning energy source for
home heating and air conditioning, especially in major metropolitan areas where air
quality is a prime concern. The domestic supply of natural gas is also plentiful.
Performance and Strategy in Competitive Markets 337
Government reports predict that gas recoverable with current technology from
domestic sources is sufficient to satisfy production needs for more than 50 years.
Plentiful imports from Canada are also readily available to supplement domestic
production. To illustrate the net amount of social welfare generated in this
vigorously competitive market, assume that market supply and demand conditions
are
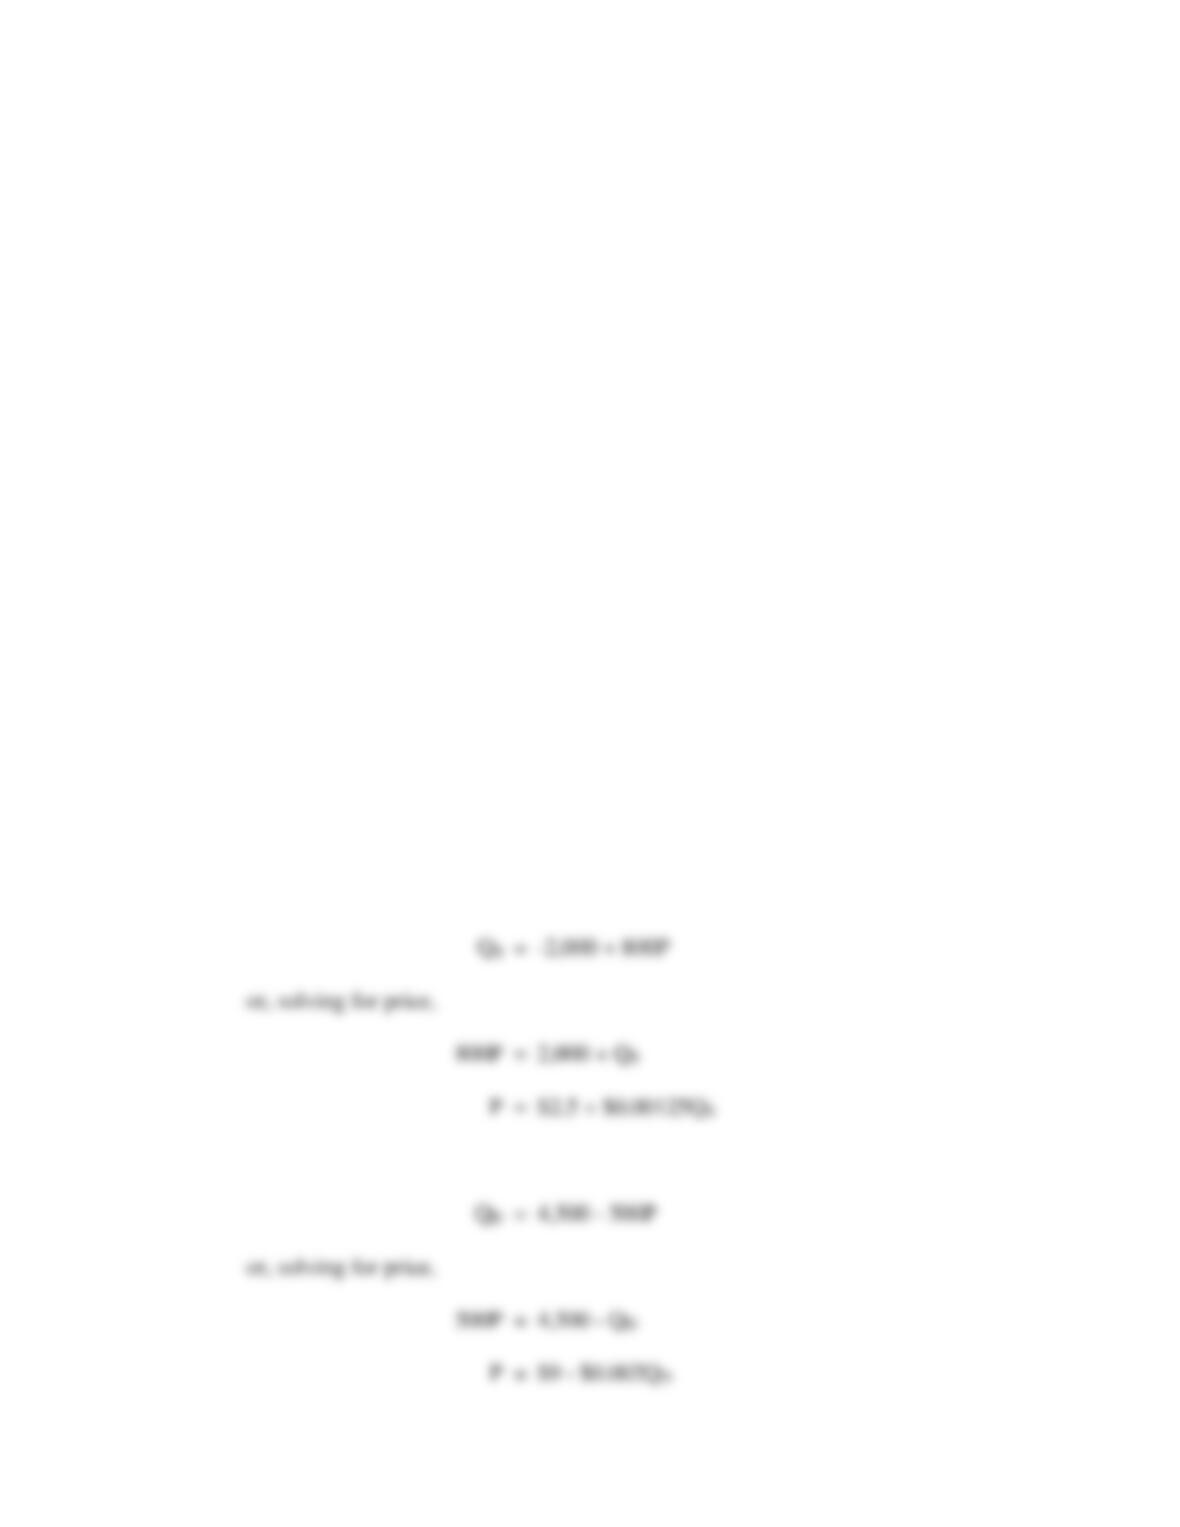
QS = -2,000 + 800P (Market Supply)
QD = 4,500 – 500P (Market Demand)
where Q is output in million Btus (in millions), and P is price per unit. A British
thermal unit (Btu) is an English standard unit of energy. One Btu is the amount of
thermal energy necessary to raise the temperature of one pound of pure liquid water
by one degree Fahrenheit at the temperature at which water has its greatest density
(39 degrees Fahrenheit).
A. Graph and calculate the equilibrium price/output solution.
B. Use this graph to help you algebraically determine the amount of
consumer surplus, producer surplus and net social welfare generated in
this market.
P11.3 SOLUTION
A. The market supply curve is given by the equation
The market demand curve is given by the equation
338 Chapter 11
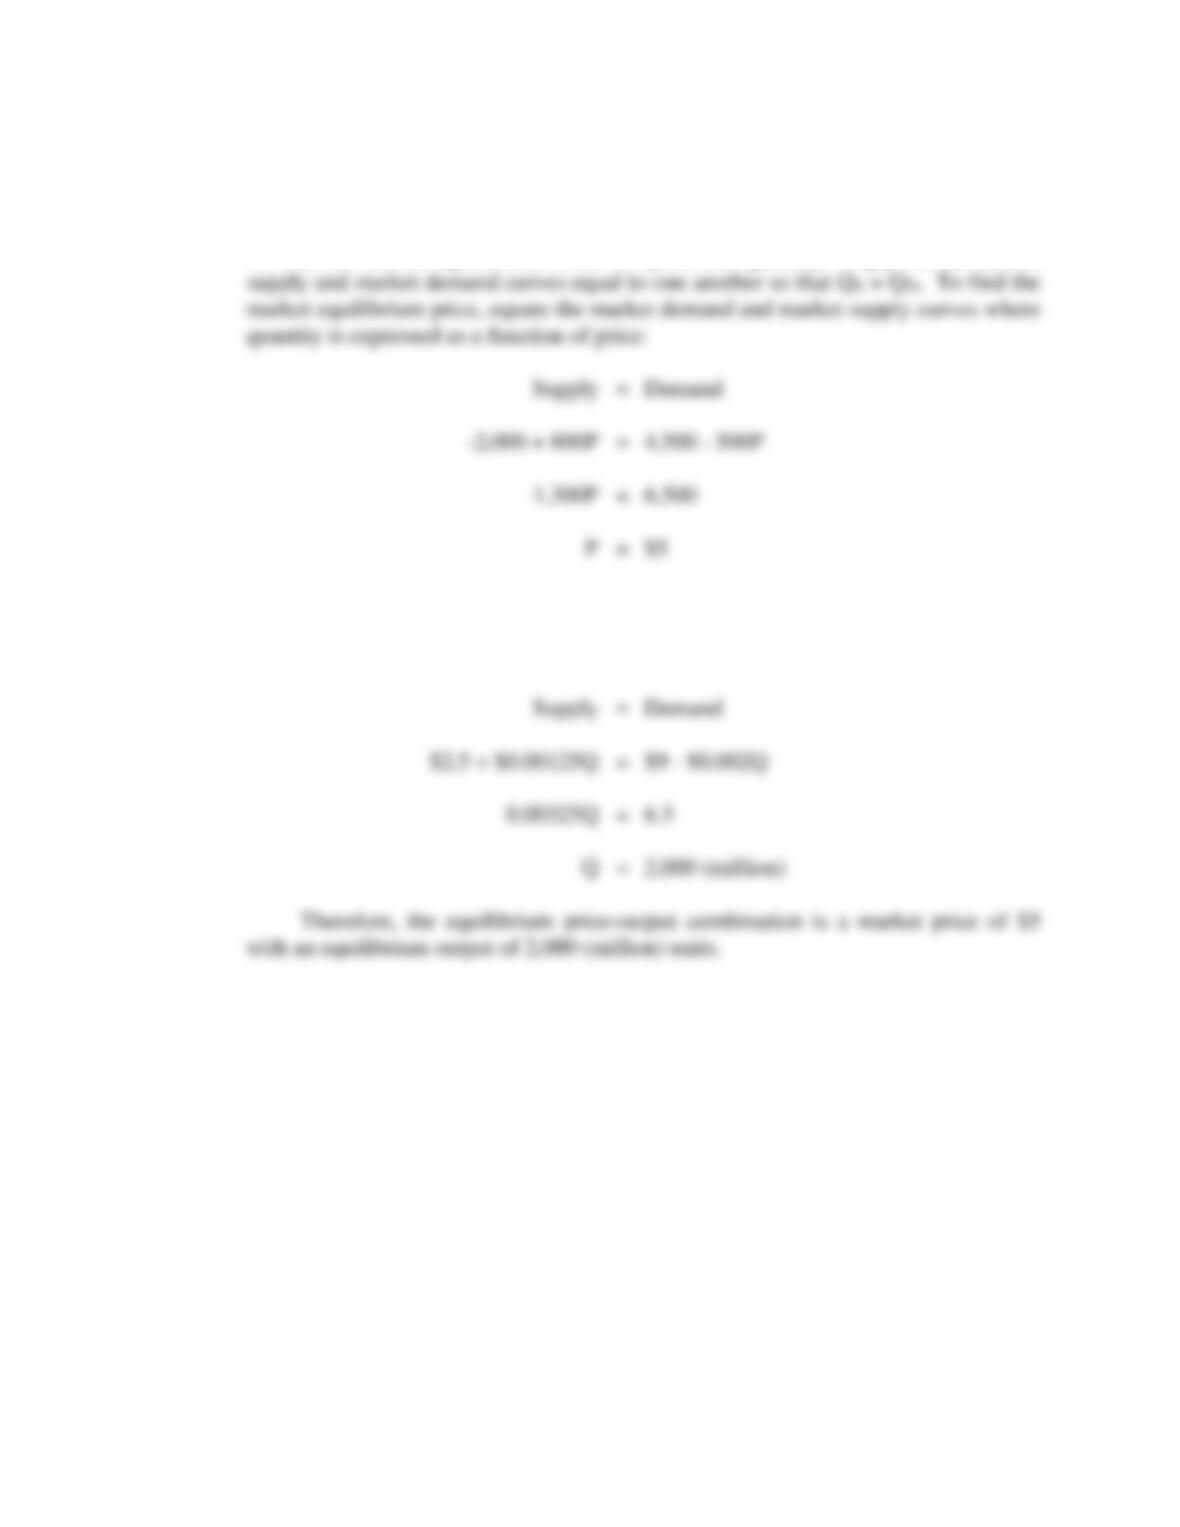
To find the market equilibrium levels for price and quantity, simply set the market
To find the market equilibrium quantity, set equal the market supply and
market demand curves where price is expressed as a function of quantity, and QS =
QD: