
260 CHAPTER 11 | Long-Run Economic Growth: Sources and Policies
record in protecting property rights is offered by X. Zhang, who argues that local Chinese governments
engage in vigorous competition for investment that benefits their own jurisdictions. The uncertainty of
doing business is very high and, as a result, the cost of completing contracts is high as well. To overcome
these obstacles, businesses often partner with local government officials who work hard to provide a
Extra Economics in Your Life:
Can Economic Growth in China Have an Impact on You?
Question: China has enjoyed higher economic growth for the last decade than has the United States. How
can China’s rapid economic growth affect your welfare (assuming you live in the United States)?
Answer: The fact that China is experiencing rapid economic growth allows firms located in China to
CHAPTER 11 | Long-Run Economic Growth: Sources and Policies 261
Solutions to End-of-Chapter Exercises
11.1
Economic Growth over Time and around the World
Learning Objective: Define economic growth, calculate economic growth rates, and
describe global trends in economic growth.
Review Questions
1.1 A country’s economic growth rate matters because living standards usually rise with economic
1.2 The total percentage increase is the percentage increase in real GDP from 2005 to 2015. It is not
Problems and Applications
1.3 Shiue and Keller’s finding of the importance of market efficiency in explaining long-run
1.4 The annual rate of economic growth is calculated as the percentage change in real GDP from the
previous year. For example, the rate of economic growth for Brazil in 2012 equals: [($1,213 –
1,192)/1,912] × 100 = 1.76%. The average annual growth rate between 2012 and 2014 is
calculated as the simple average of the growth rates for each year.
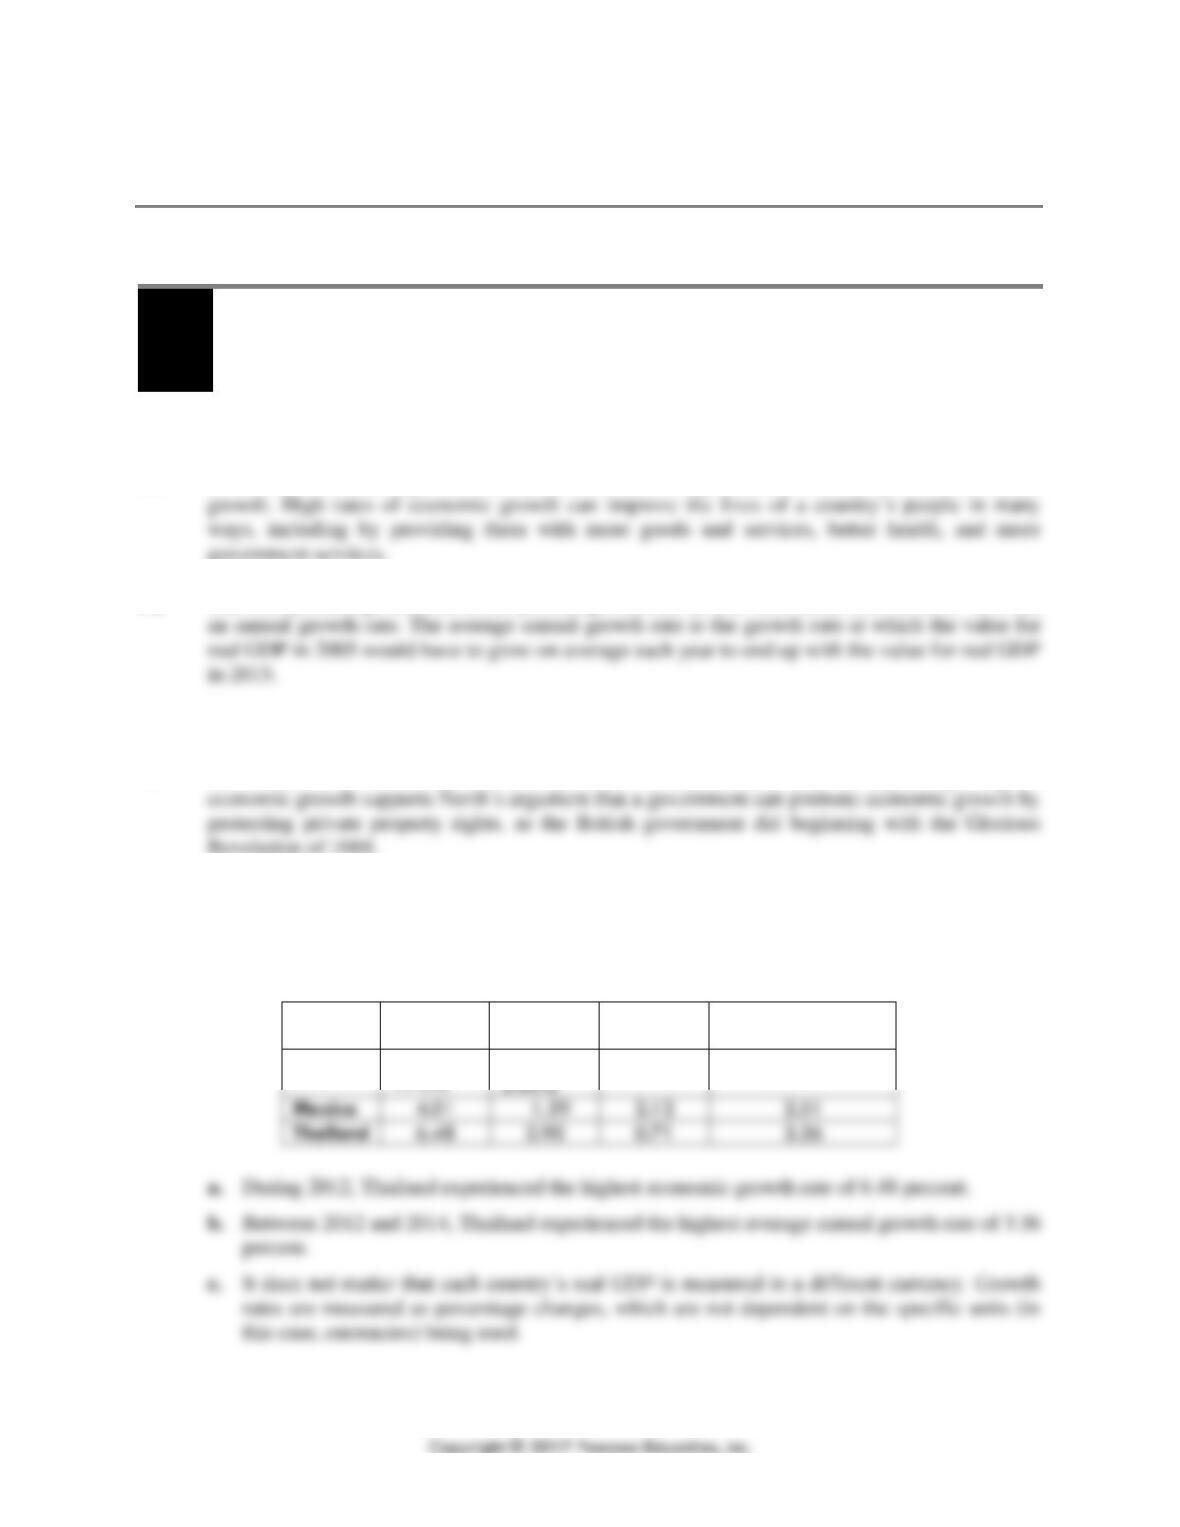
Country
2012
2013
2014
Average Annual
Growth Rate
Brazil
1.76%
Thailand
0.08%
1.55%
262 CHAPTER 11 | Long-Run Economic Growth: Sources and Policies
1.5 You will have earned more on your Andover Bank CDs due to the compounding in 2017 and
2018 on the extra $30 you earned on the Andover Bank CD in 2016.
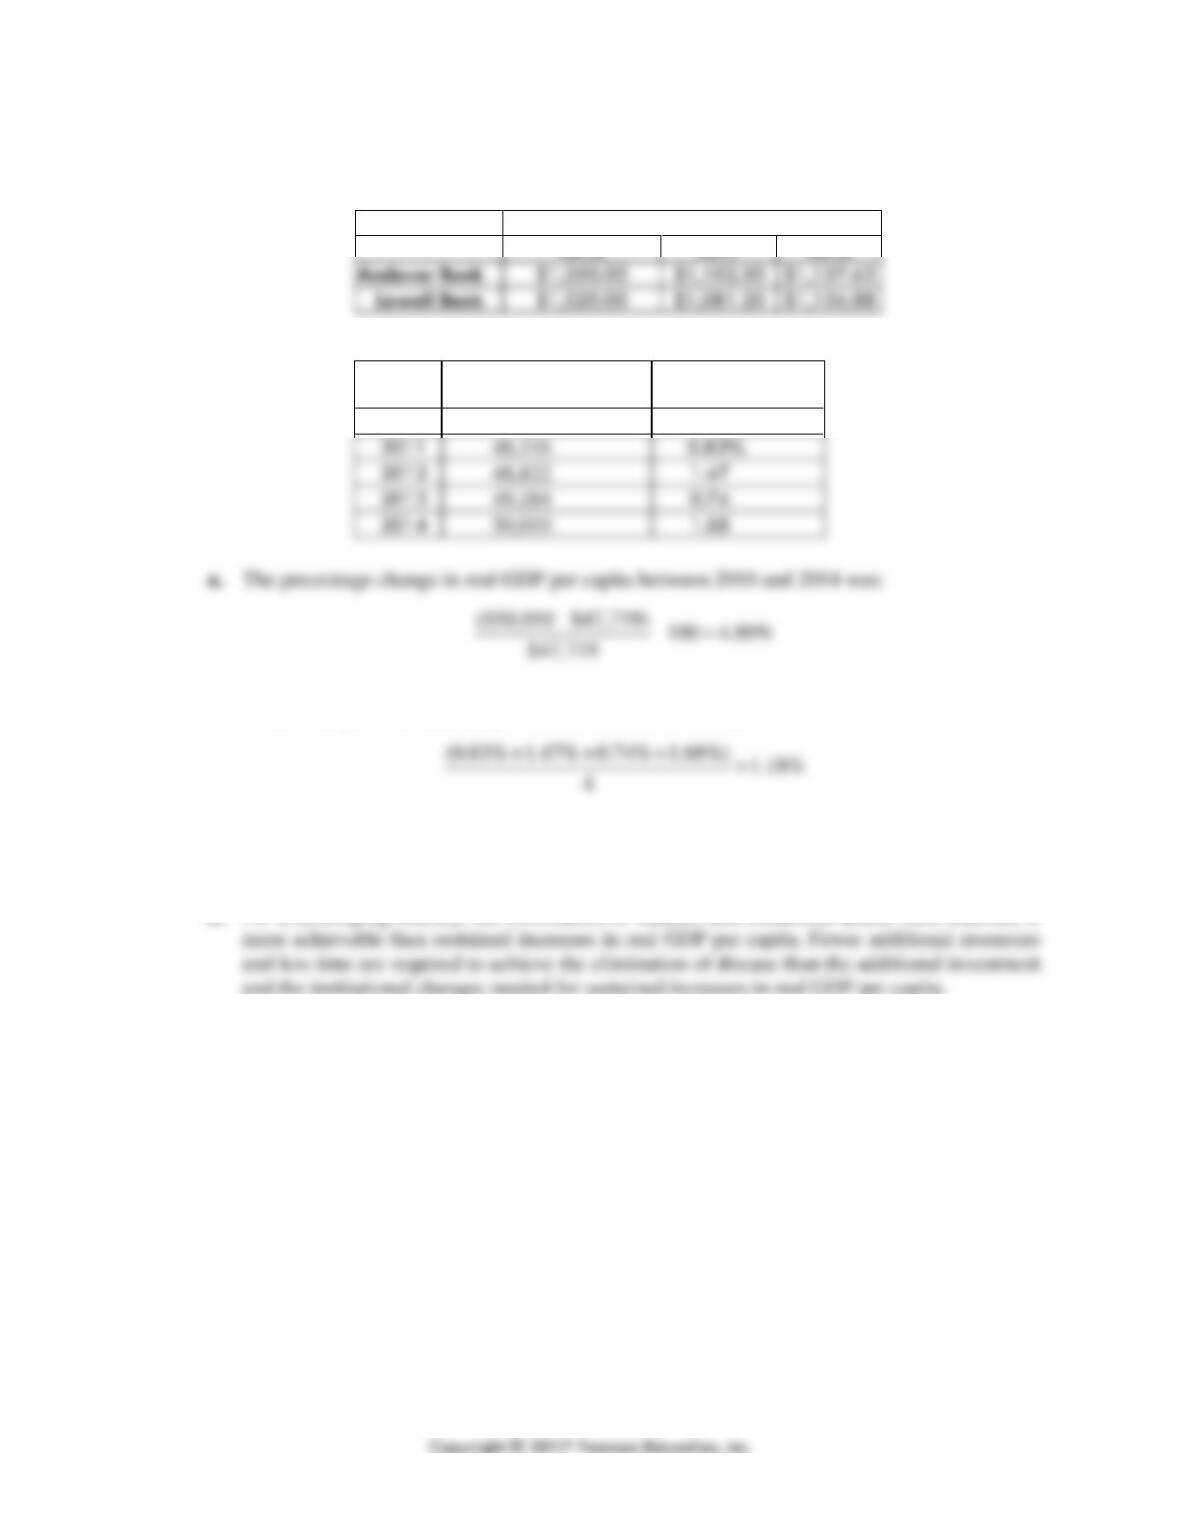
Bank
Value of CD at End of Year
2016
2017
2018
1.6
Year
Real GDP per Capita
(2009 prices)
Annual Growth
Rate
2010
$47,719
—–
2012
2013
b. The average annual growth rate in GDP per capita between 2010 and 2014 can be measured
as the average of the annual growth rates in the above table:
1.7 a. Real GDP per capita most likely did not increase significantly from the near elimination of
measles and the large decrease in childhood deaths, but because the health of many people
improved, the standard of living did increase significantly.
b. For a developing country, the elimination of measles and childhood deaths from diarrhea is
and the institutional changes needed for sustained increases in real GDP per capita.
1.8 If ideas and inventions, such as vaccines for DPT (diphtheria, pertussis, and tetanus), flow more
readily than process technologies, like laws and inventory management systems, then low-income
countries will be able to increase their standard of living as measured by better health and more
education faster than they will be able to increase real GDP per capita.
CHAPTER 11 | Long-Run Economic Growth: Sources and Policies 263
11.2
What Determines How Fast Economies Grow?
Learning Objective: Use the economic growth model to explain why growth rates differ
across countries.
Review Questions
2.1
2.2 Diminishing returns to capital imply that, holding technology constant, increases in capital per
hour worked result in smaller and smaller increases in real GDP per hour worked. Therefore,
2.3 New growth theory is a model of long-run economic growth that emphasizes the effect of
economic incentives on technological change, which is determined by the working of the market
2.4 Firms are likely to underinvest in research and development because other firms will gain much
of the additional returns from research and development. To increase the accumulation of

264 CHAPTER 11 | Long-Run Economic Growth: Sources and Policies
2.5 Knowledge capital experiences increasing returns at the economy level while physical capital
experiences decreasing returns because knowledge capital is nonrival and nonexcludable.
Problems and Applications
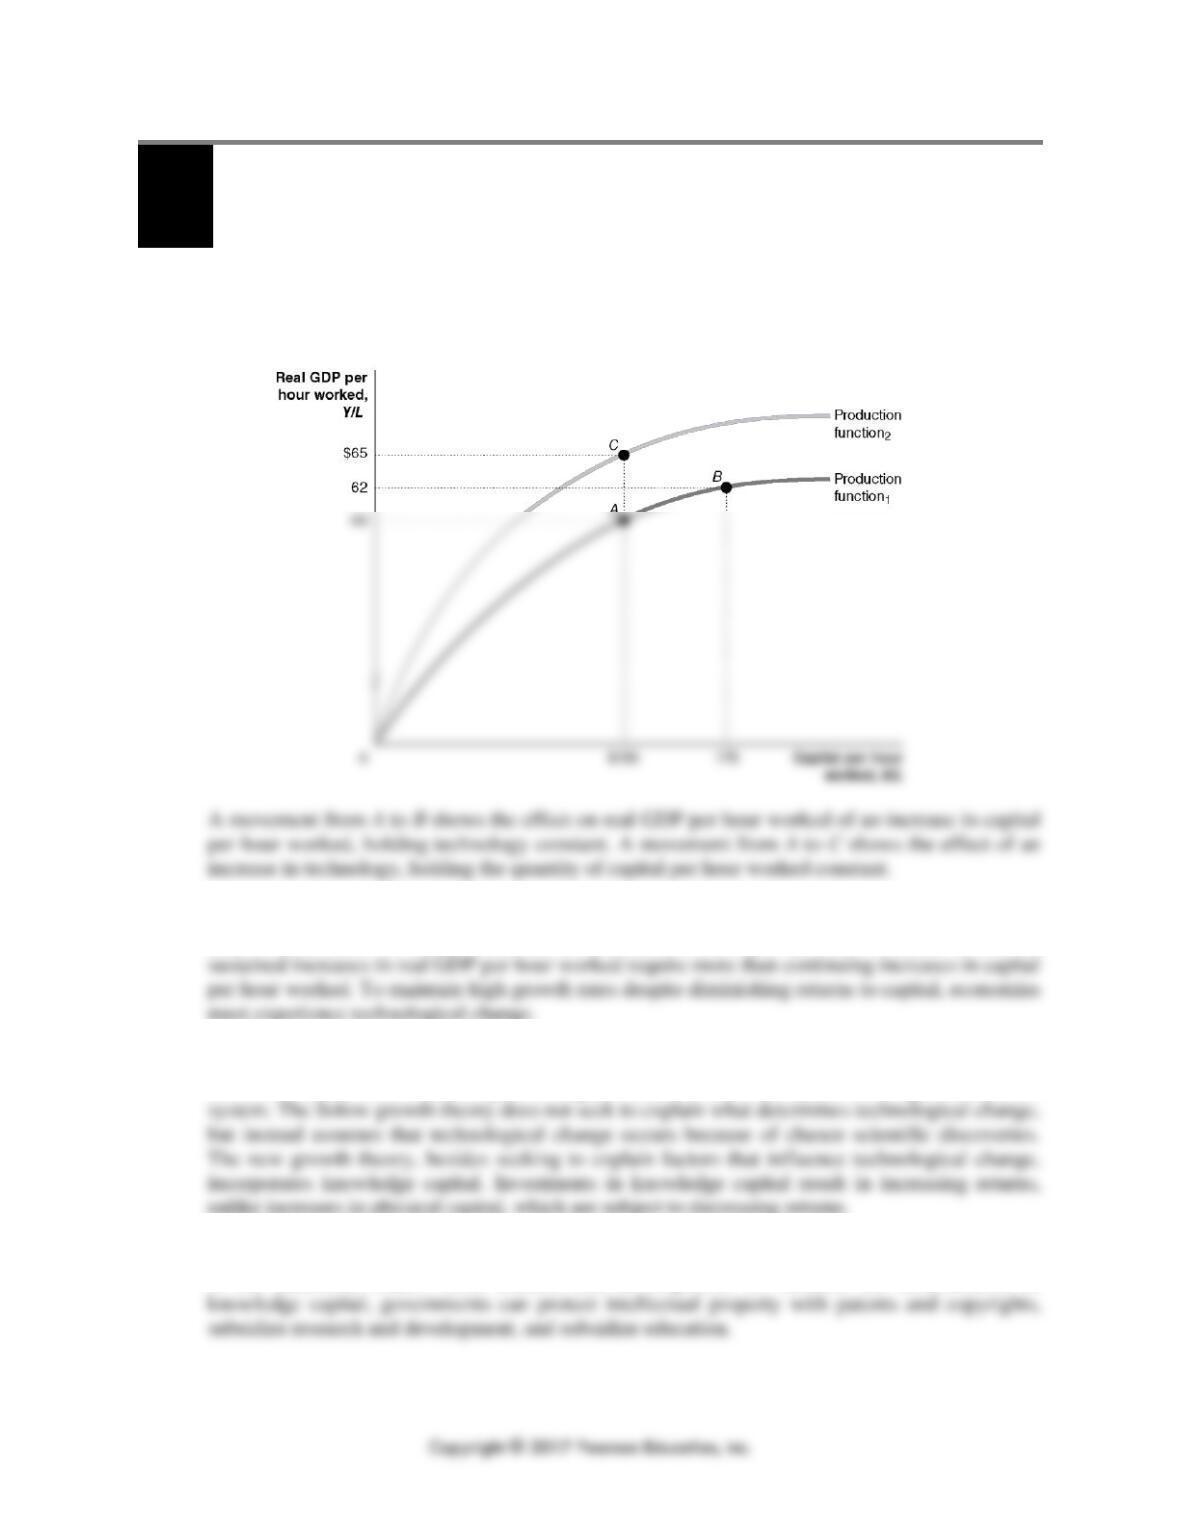
2.6 a. An increase in capital per hour worked results in a movement along the per-worker
production function.
2.7 Even though they are not spending their own money, salaried managers in the United States are
judged by the profitability of their companies, which often depends on the adoption of new
technologies.
2.8 a. False, because technology is assumed constant along a given per-worker production function.
The movement from point A to point B represents an increase in capital per hour worked.
2.9 If the per-worker production function turned upward, with the slope of the curve increasing as
2.10 This strategy ran into the problem of diminishing returns to capital. The policy of very high rates
of investment with little emphasis on technological change meant that the capital stock was
increasing much more rapidly than technology. Continuing rapid increases in capital per hour
worked led only to diminishing increases in output per hour worked. With these diminishing
returns, the growth rate of real GDP per capita stagnated.
2.11 a. Urbanization refers to the process of people moving from rural areas to cities.
b. If urbanization is an important explanation for China’s high rates of economic growth, then
2.12 In the traditional economic growth model, technological change is exogenous, which means that
it is not explained by the model. Technological change is endogenous (or determined by the
CHAPTER 11 | Long-Run Economic Growth: Sources and Policies 265
11.3
Economic Growth in the United States
Learning Objective: Discuss fluctuations in productivity growth in the United States.
Review Questions
3.1 The growth rate of productivity increased from 1800 through the mid-1970s, slowed for 20 years,
3.2 Some economists are optimistic that the increase in productivity that began in the mid-1990s from
advances in information and communication technology will continue. These economists believe
high rates of growth will come from higher productivity in the IT sector itself and in other sectors
Problems and Applications
3.3 The growth rates would be lower if they were calculated for real GDP per capita instead of per
3.4 In recent years, there has been evidence of technological progress—smartphones, 4K TVs, and
social media apps are examples—while measured productivity growth has slowed. Sluggish
productivity growth is consistent with a slow-growing economy, but economists have not reached
3.5 Future labor productivity growth rates in the United States will be low if Gordon’s observations
are correct. The higher labor productivity growth rates that lasted from 1996 to 2005 were due
3.6 a. There are benefits derived from Internet searches that affect GDP, but they are not likely to
be measured directly. Finding information more quickly and efficiently than was possible
prior to the existence of the Internet results in more time and other resources available to
produce new final goods and services. In other words, as the opportunity cost of finding
information has declined, more resources are available to produce additional output that is
included in GDP.

266 CHAPTER 11 | Long-Run Economic Growth: Sources and Policies
b. There are measurement problems that could explain why productivity growth has declined in
recent years, but some economists have pointed out that similar problems resulted in an
11.4
Why Isn’t the Whole World Rich?
Learning Objective: Explain economic catch-up and discuss why many poor countries
have not experienced rapid economic growth.
Review Questions
4.1 Increases in the quantity of capital per hour worked and the adoption of new technology should
4.2 The main reasons many poor countries have experienced slow growth are the failure to enforce
4.3 Globalization refers to the process of countries becoming more open to foreign trade and
investment. Globalization can help a developing country break out of the vicious cycle of low
Problems and Applications
4.4 The catch-up effect predicts that countries with a lower level of GDP per capita will grow faster
than countries with a higher level of GDP per capita. In the table, the data for China, Ireland, and
4.5 a. No, these data do not support the catch-up prediction. The countries with the highest initial
levels of real GDP per capita have growth rates of real GDP per capita similar to the countries
with average initial levels of real GDP per capita.
CHAPTER 11 | Long-Run Economic Growth: Sources and Policies 267
4.6 a. The horizontal line in Graph 1 matches the experience of all countries, indicating that most of
the world hasn’t been catching up.
4.7 A high unemployment rate means distress for the people who are currently out of work. The
economy minister, though, may be expecting Italy’s unemployment rate to fall over time. A low
4.8 Large, modern companies can better afford to invest in human and physical capital and
technology and use more efficient means of organizing their production processes than can small
4.9 a. Using the “rule of 70” it would take 77.8 years for the standard of living – as measured by
real GDP per capita – to double at a growth rate of 0.9 percent.
4.10 a. Critics of globalization include those from developed countries, such as the United States, who
believe that globalization leads to free-trade agreements that cause a movement of jobs
(“outsourcing”) from the United States to other nations, and argue that competition from lower–
wage countries produced by such agreements contributes to stagnant wages and higher income
inequality in the United States. Other critics believe that globalization, by promoting free trade
268 CHAPTER 11 | Long-Run Economic Growth: Sources and Policies
4.11 “Integration into the global economy” refers to India becoming more open to foreign trade and
investment. Foreign trade allows India to specialize in the production of goods and services in
4.12 For the most part, the Roman Empire lacked the secure private property rights required for a
11.5
Growth Policies
Learning Objective: Discuss government policies that foster economic growth.
Review Questions
5.1 Governments can aid economic growth through policies that enhance property rights and the rule
5.2 Economic growth is associated with higher living standards, improved health, improved working
conditions, and longer life expectancy. However, some critics argue that economic growth has
Problems and Applications
5.3 It would be good news for the Mexican economy only if the Mexican government were able
reduce corruption and lawlessness, some of which is related to the traffic of illegal drugs into the
5.4 A lower birthrate will lead to a lower proportion of workers in their 20s and 30s, and a higher
proportion of workers in their 60s and older. The older workers as a group will be less educated,
5.5 a. “Technological catch-up” refers to China narrowing the gap between the technologies used in
the West and those used in China. China has been catching up to the West in using the most
recent technological innovations.
CHAPTER 11 | Long-Run Economic Growth: Sources and Policies 269
5.6 a. The passage of an investment tax credit is likely to increase the rate of economic growth in
the United States because the credit will give firms incentives to purchase more capital,
thereby increasing the capital to labor ratio (K/L). In addition, if some of the new capital
5.7 A free press could serve as a watchdog against government violations of property rights and the
rule of law. When the government controls the press, there can be no good way for the citizens of
5.8 Concerns regarding some of the effects of rapid economic growth, such as possible damage to the
environment, might be considered a normal good whose demand increases as consumers’
incomes increase. From this perspective, more people in high-income countries than in low-
Real-Time Data Exercises
D11.1 a. Output per hour for all persons in the manufacturing sector in the U.S. was 47.2 in the first
quarter 1987 and 120.4 in the first quarter of 2015. Output per hour for all persons in the non–
farm business sector was 61.4 in the first quarter of 1987 and 105.0 in the first quarter of 2015.
270 CHAPTER 11 | Long-Run Economic Growth: Sources and Policies
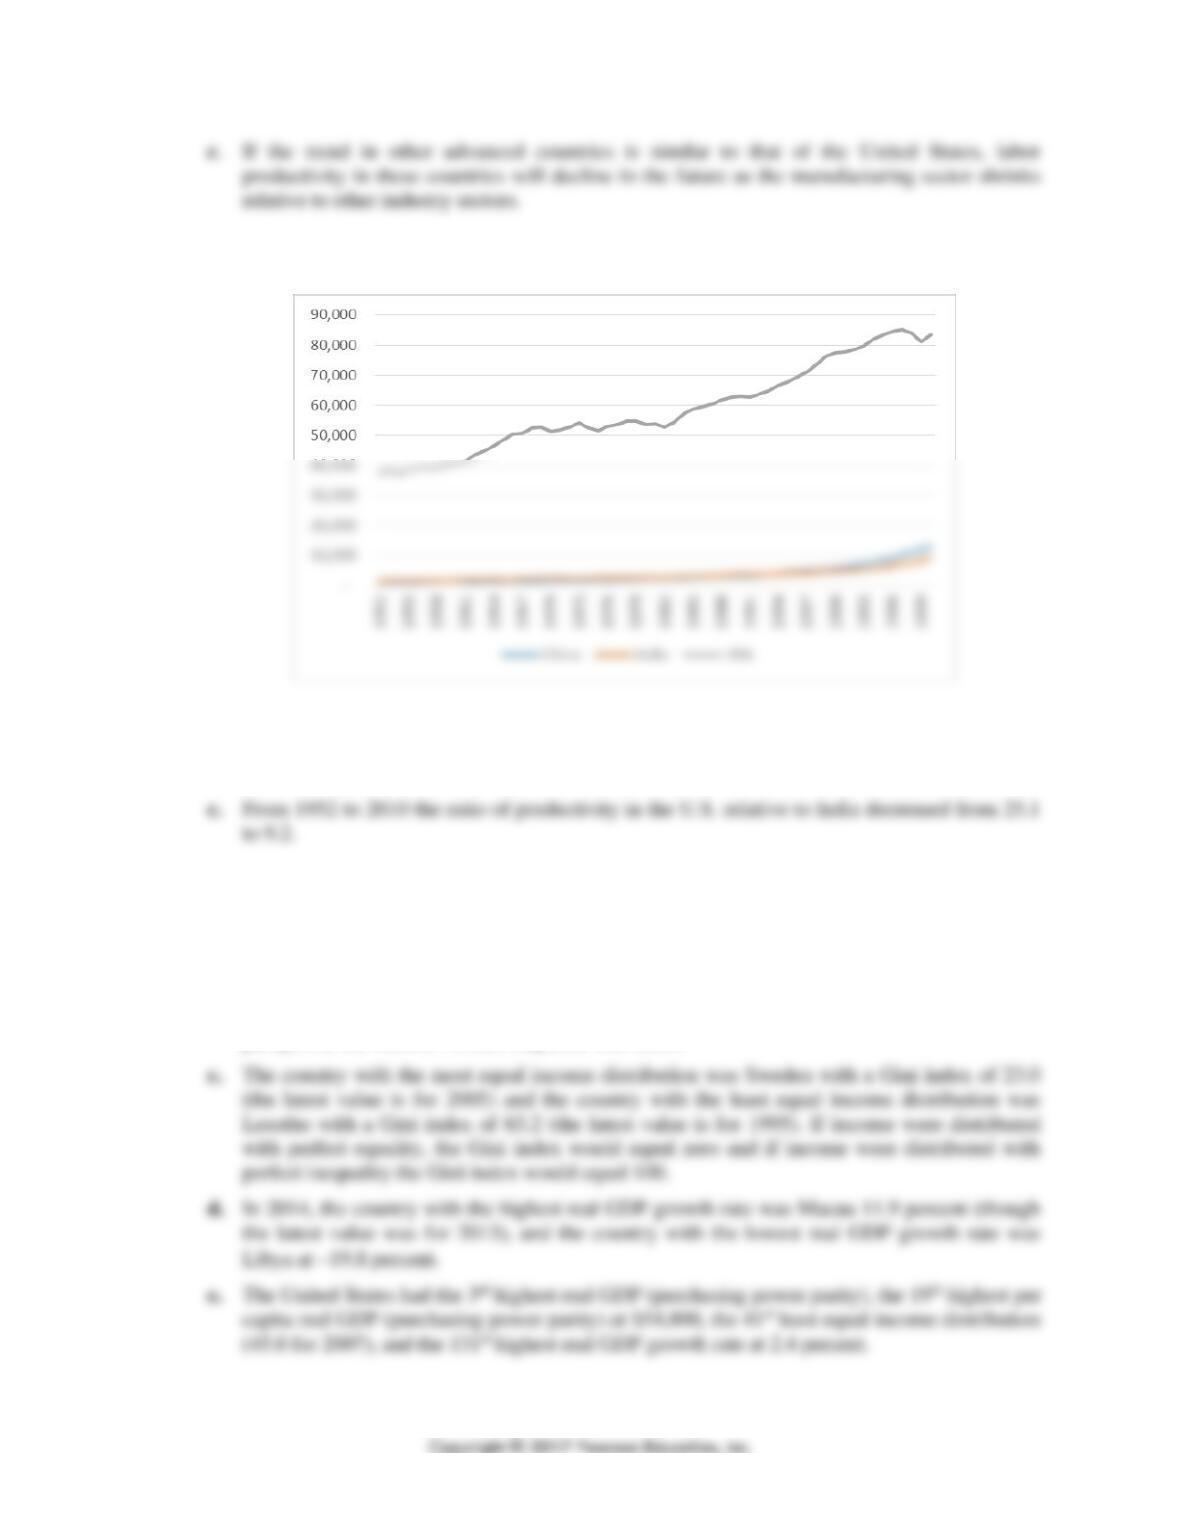
D11.2 a.
Labor Productivity in China, India and the U.S. from 1950
b. From 1952 to 2010 the ratio of productivity in the U.S. relative to China decreased from 34.6
to 6.4. Although labor productivity in the U.S. was still higher than in China, productivity
rose in China, especially since 1980 after China instituted economic reforms.
D11.3 a. In 2014, the country with the highest real GDP (purchasing power parity) was China with
$17.6 trillion, and the country with the lowest real GDP (purchasing power parity) was
Tuvalu with $35 million. The United States ranked 3rd (behind the European Union) with
$17.5 trillion.
b. In 2014, the country with the highest per capita real GDP (purchasing power parity) was
Qatar with $92,400, and the country with the lowest per capital real GDP (purchasing power
parity) was the Central African Republic with $600.