Performance and Strategy in Competitive Markets 339
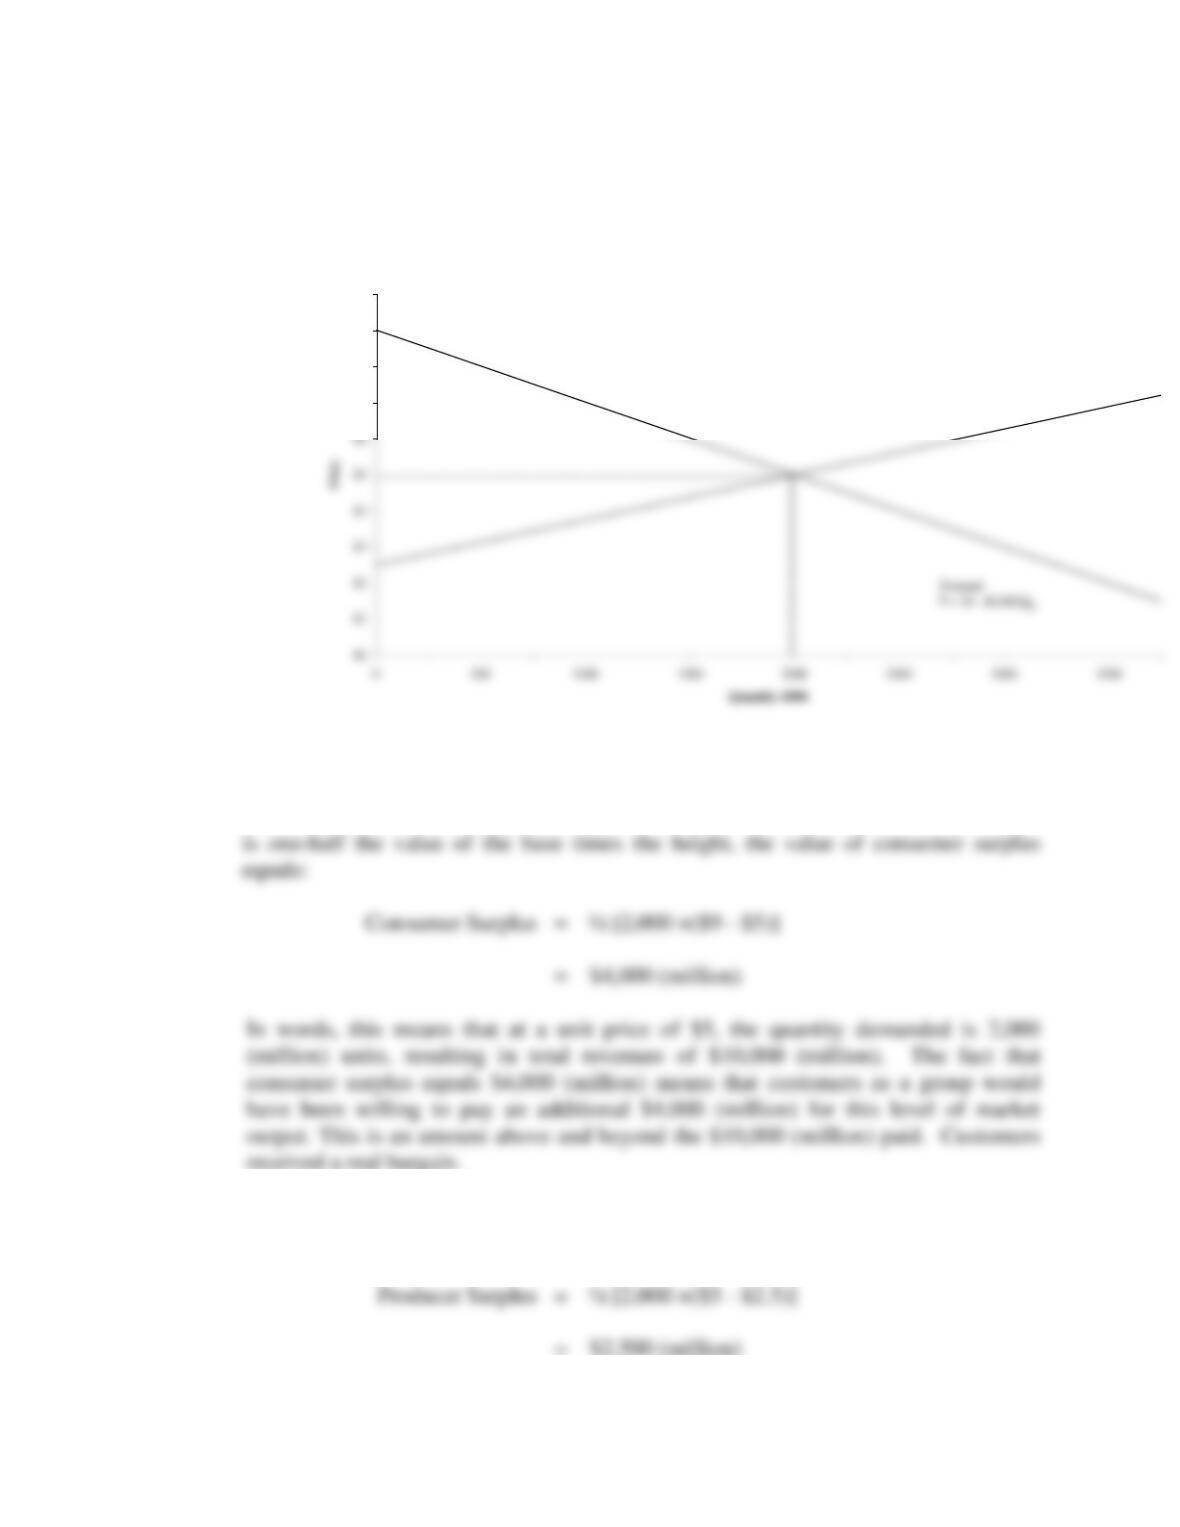
Natural Gas Equilibrium
$7
$8
$9
$10
Supply
P = $2.5 + $0.00125QS
B. The value of consumer surplus is equal to the region under the market demand curve
that lies above the market equilibrium price of $5. Because the area of such a triangle
received a real bargain.
The value of producer surplus is equal to the region above the market supply
curve at the market equilibrium price of $5. Because the area of such a triangle is
one-half the value of the base times the height, the value of producer surplus equals:
340 Chapter 11
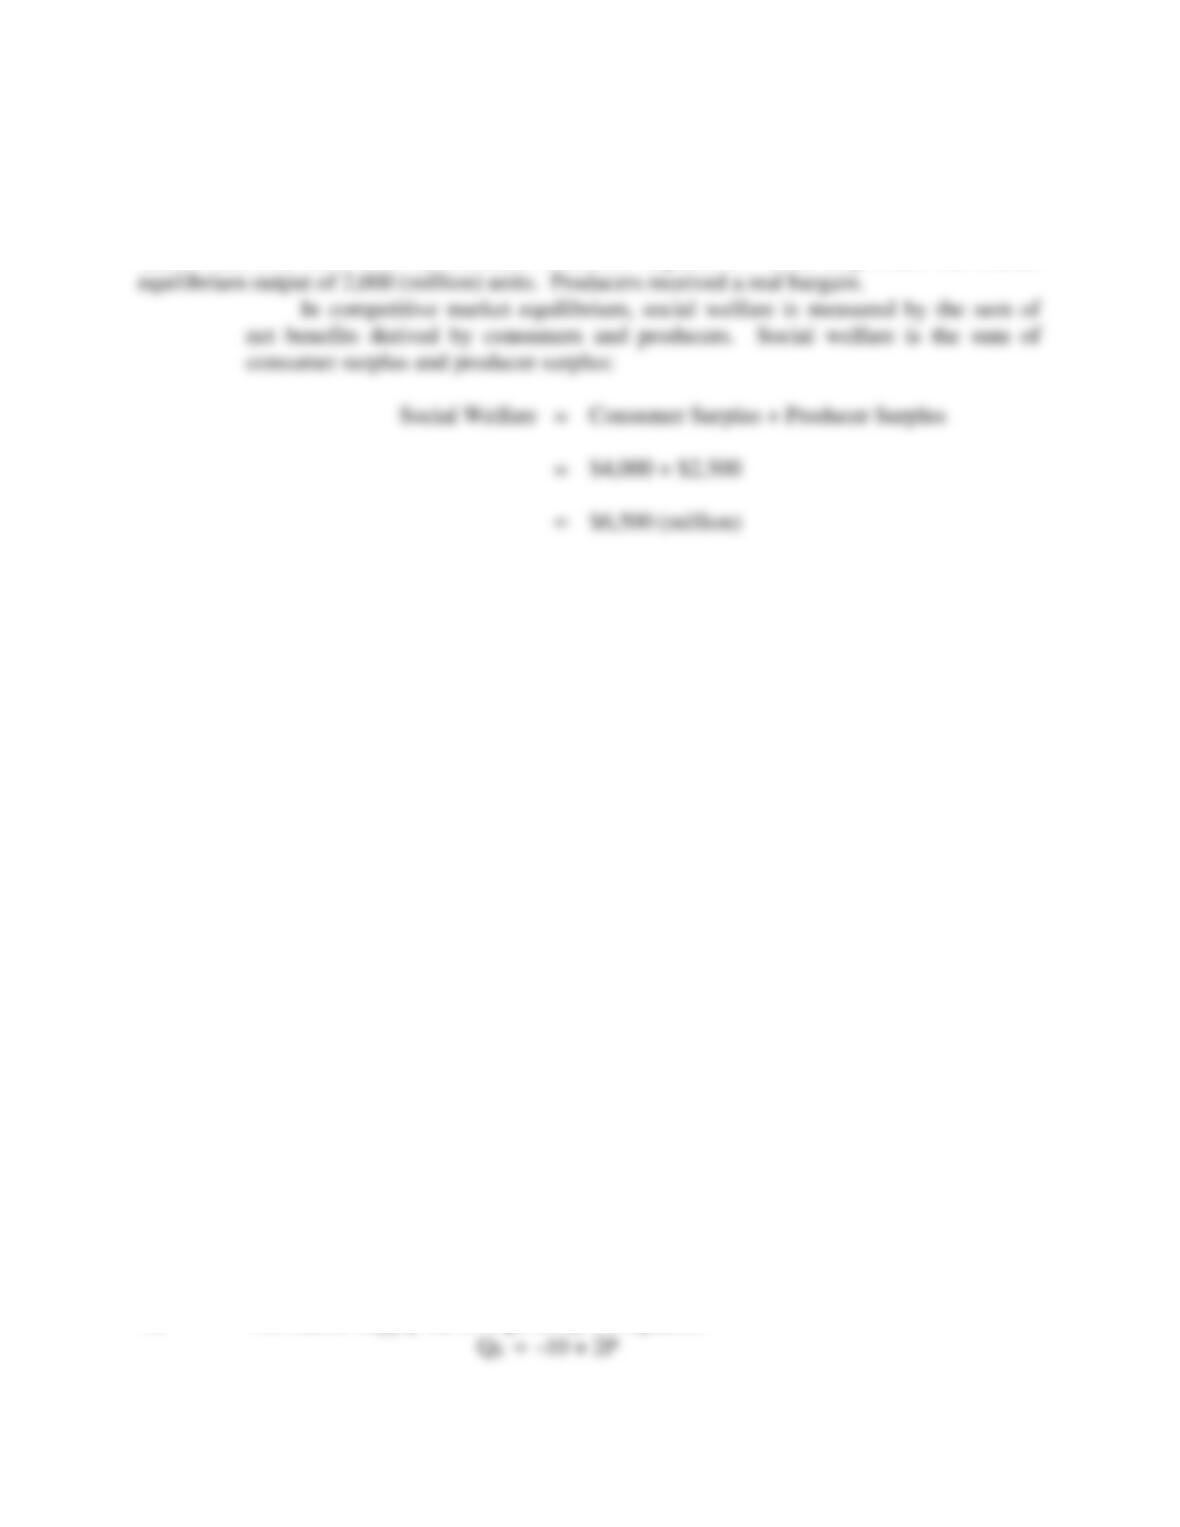
At a unit price of $5, producer surplus equals $2,500 (million). Producers as a group received
$2,500 (million) more than the absolute minimum required for them to produce the market
P11.4 Deadweight Loss of Taxation. To many upscale homeowners, no other flooring
offers the warmth, beauty, and value of wood. New technology in stains and finishes
call for regular cleaning that takes little more than sweeping and/or vacuuming, with
occasional use of a professional wood floor cleaning product. Wood floors are also
ecologically friendly because wood is both renewable and recyclable. Buyers
looking for traditional oak, rustic pine, trendy mahogany, or bamboo can choose
from a wide assortment.
At the wholesale level, wood flooring is a commodity-like product sold with
rigid product specifications. Price competition is ferocious among hundreds of
domestic manufacturers and importers. Assume that market supply and demand
conditions for mahogany wood flooring are:
QS = -10 + 2P (Market Supply)
QD = 320 – 4P (Market Demand)
where Q is output in square yards of floor covering (000), and P is the market price
per square yard.
A. Graph and calculate the equilibrium price/output solution before and after
imposition of a $9 per unit tax.
B. Calculate the deadweight loss to taxation caused by imposition of the $9 per
unit tax. How much of this deadweight loss was suffered by consumers versus
producers? Explain.
P11.4 SOLUTION
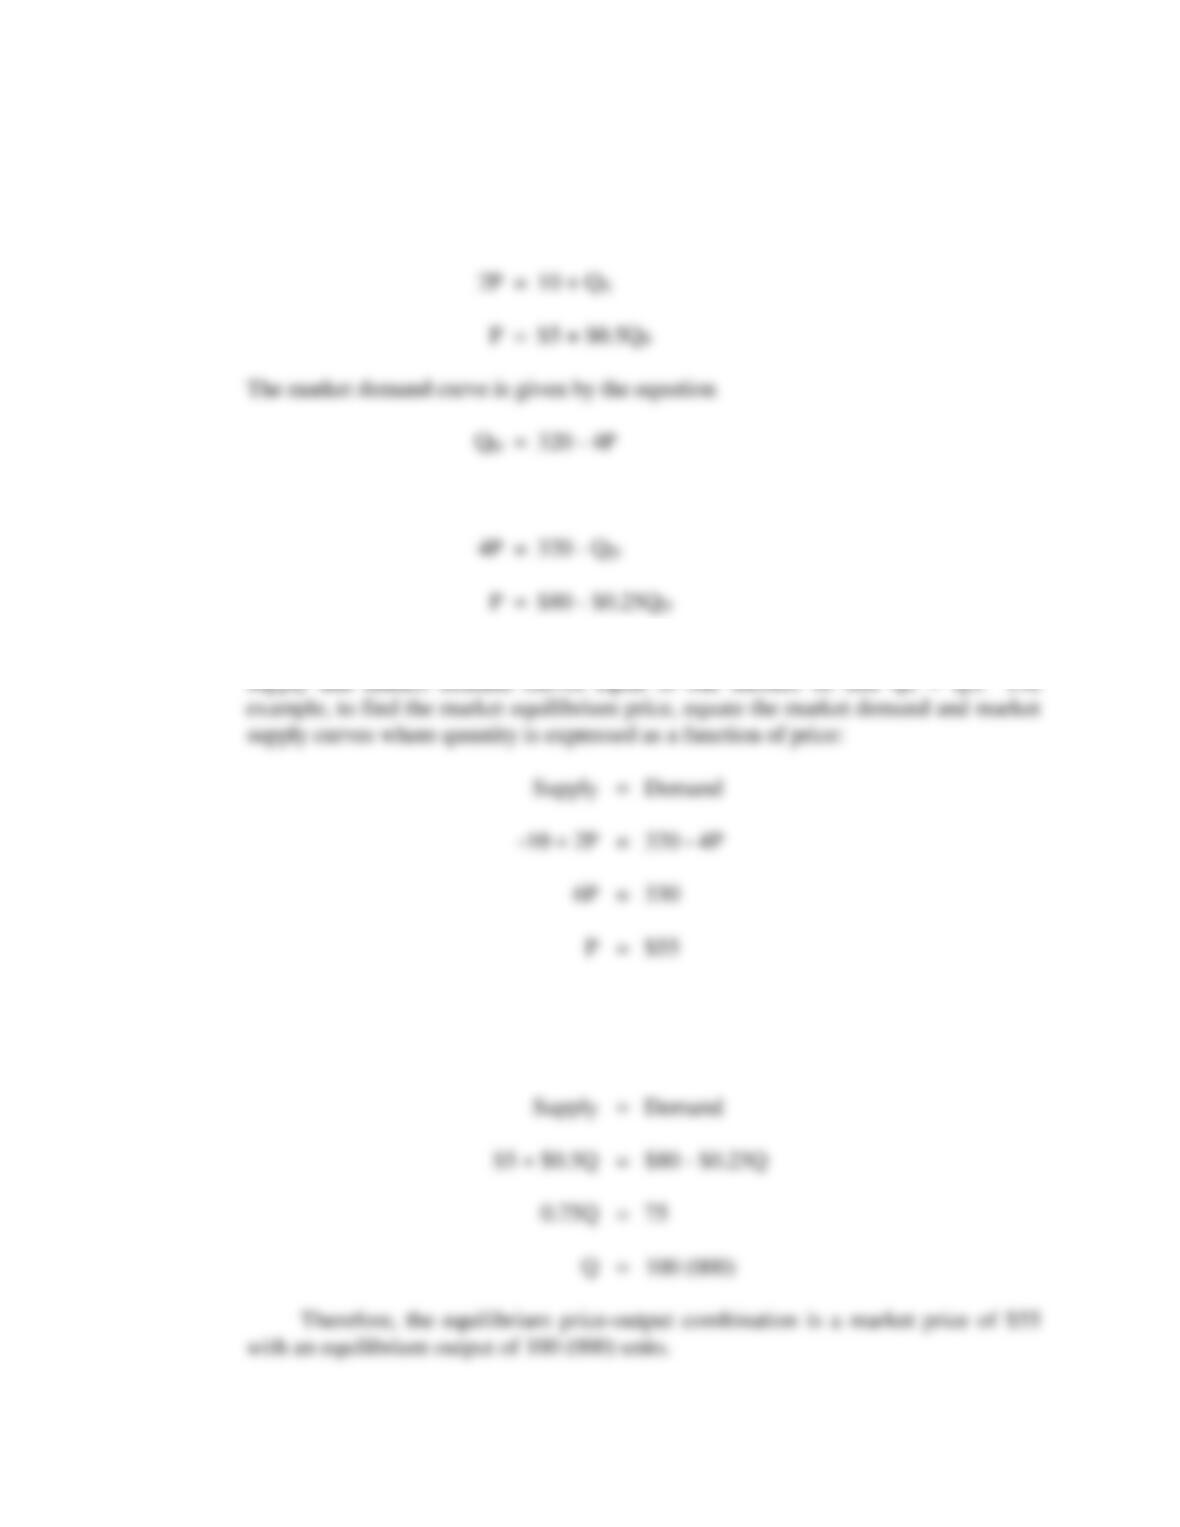
A. The market supply curve is given by the equation
Performance and Strategy in Competitive Markets 341
or, solving for price,
or, solving for price,
To find the market equilibrium levels for price and quantity, simply set the market
To find the market equilibrium quantity, set equal the market supply and
market demand curves where price is expressed as a function of quantity, and QS =
QD:
342 Chapter 11
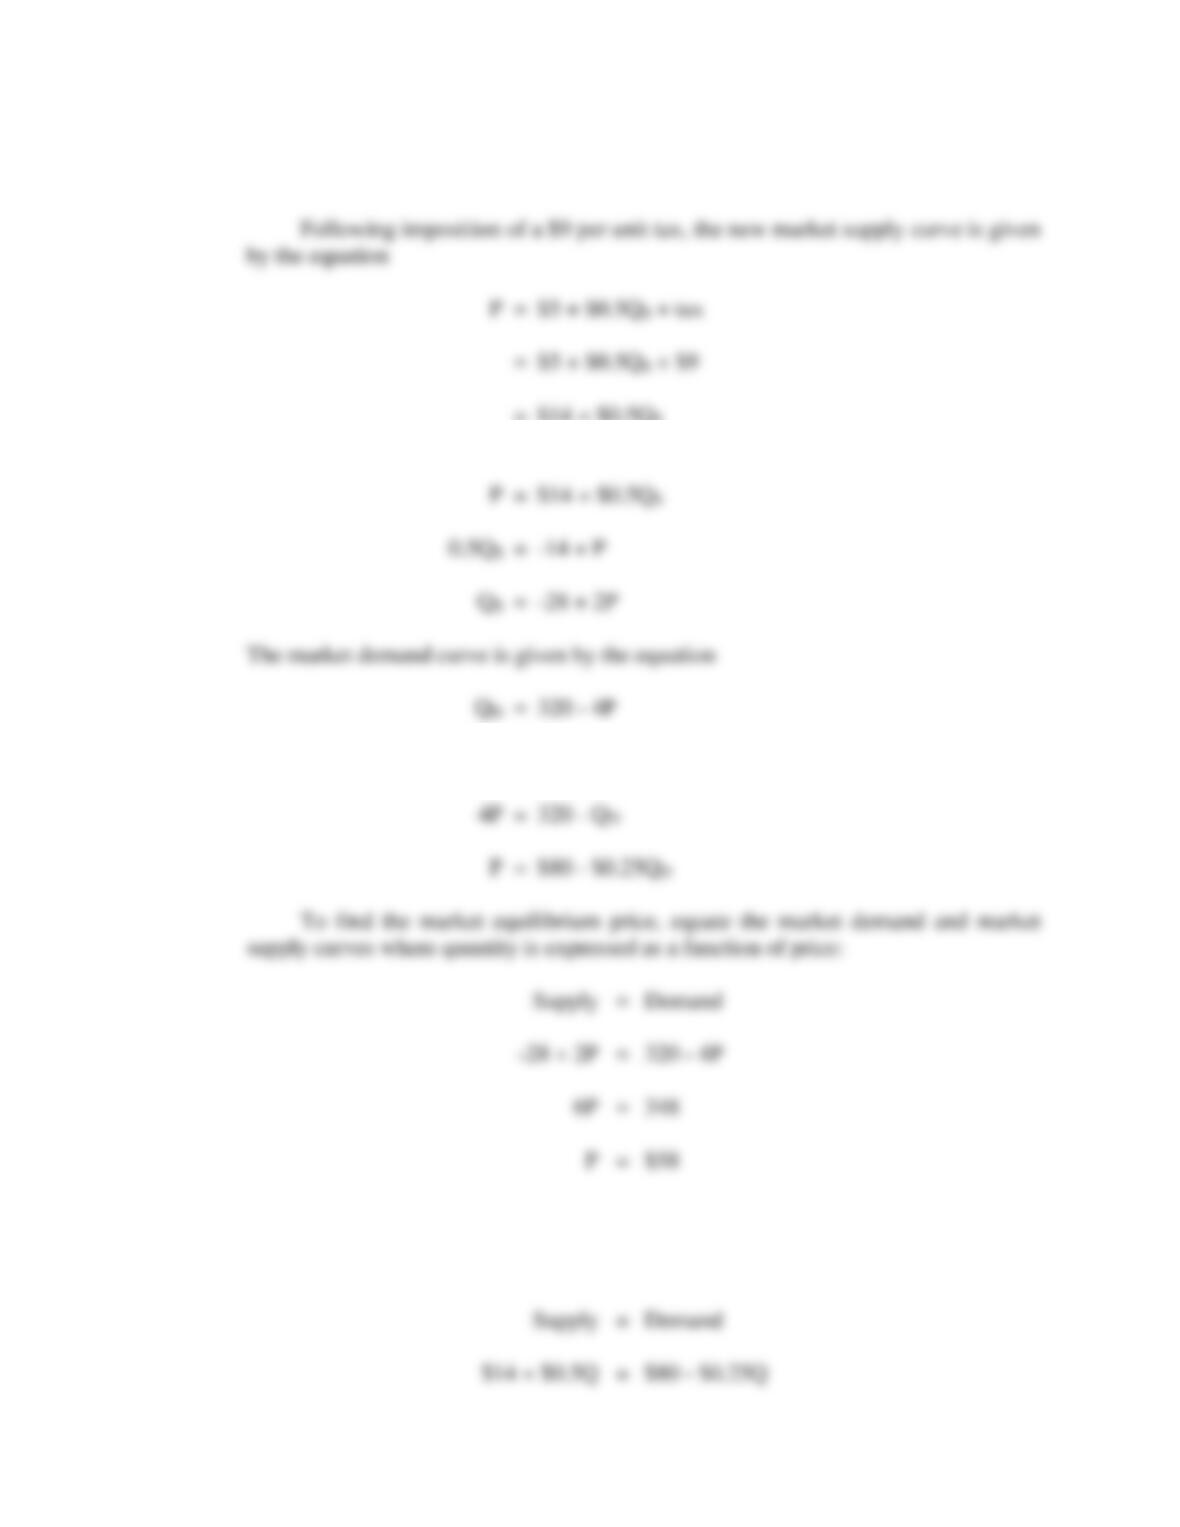
= $14 + $0.5QS
or, solving for quantity,
or, solving for price,
To find the market equilibrium quantity, set equal the market supply and
market demand curves where price is expressed as a function of quantity, and QS =
QD:
Performance and Strategy in Competitive Markets 343
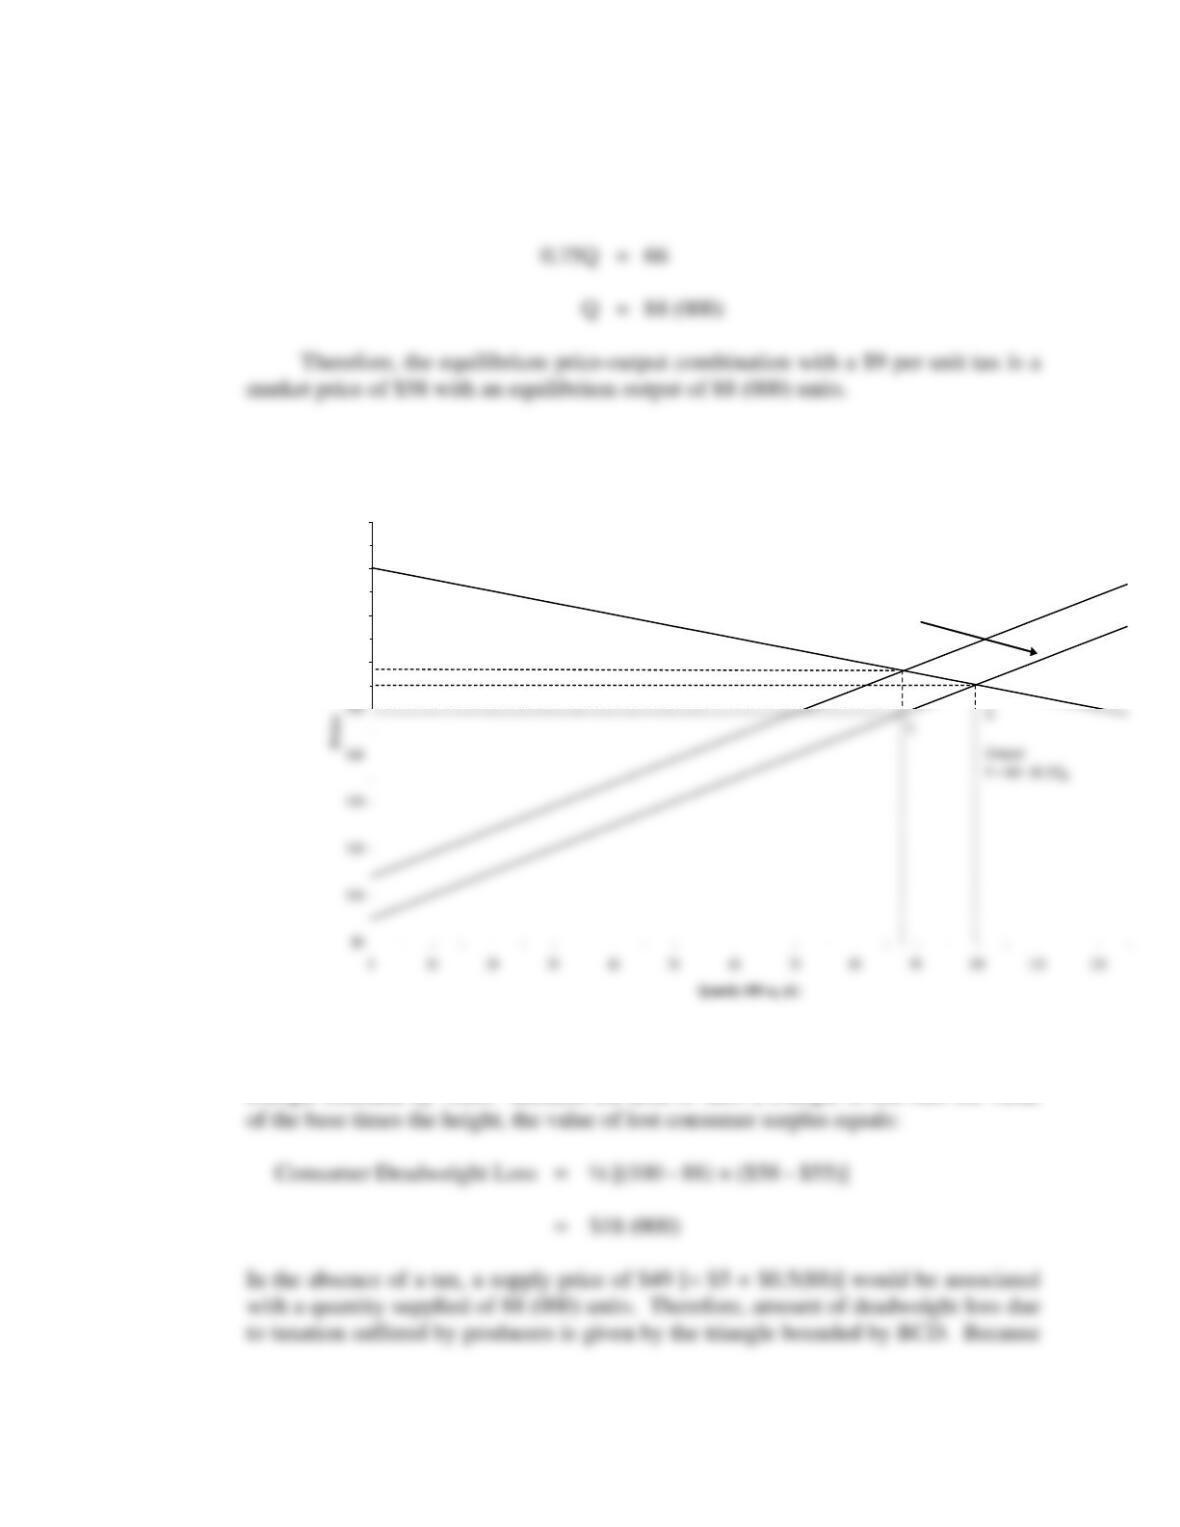
Wood Flooring Equilibrium
$60
$70
$80
$90
Supply + tax
P = $14 + $0.5QS
Supply
P = $5 + $0.5QS
A
B
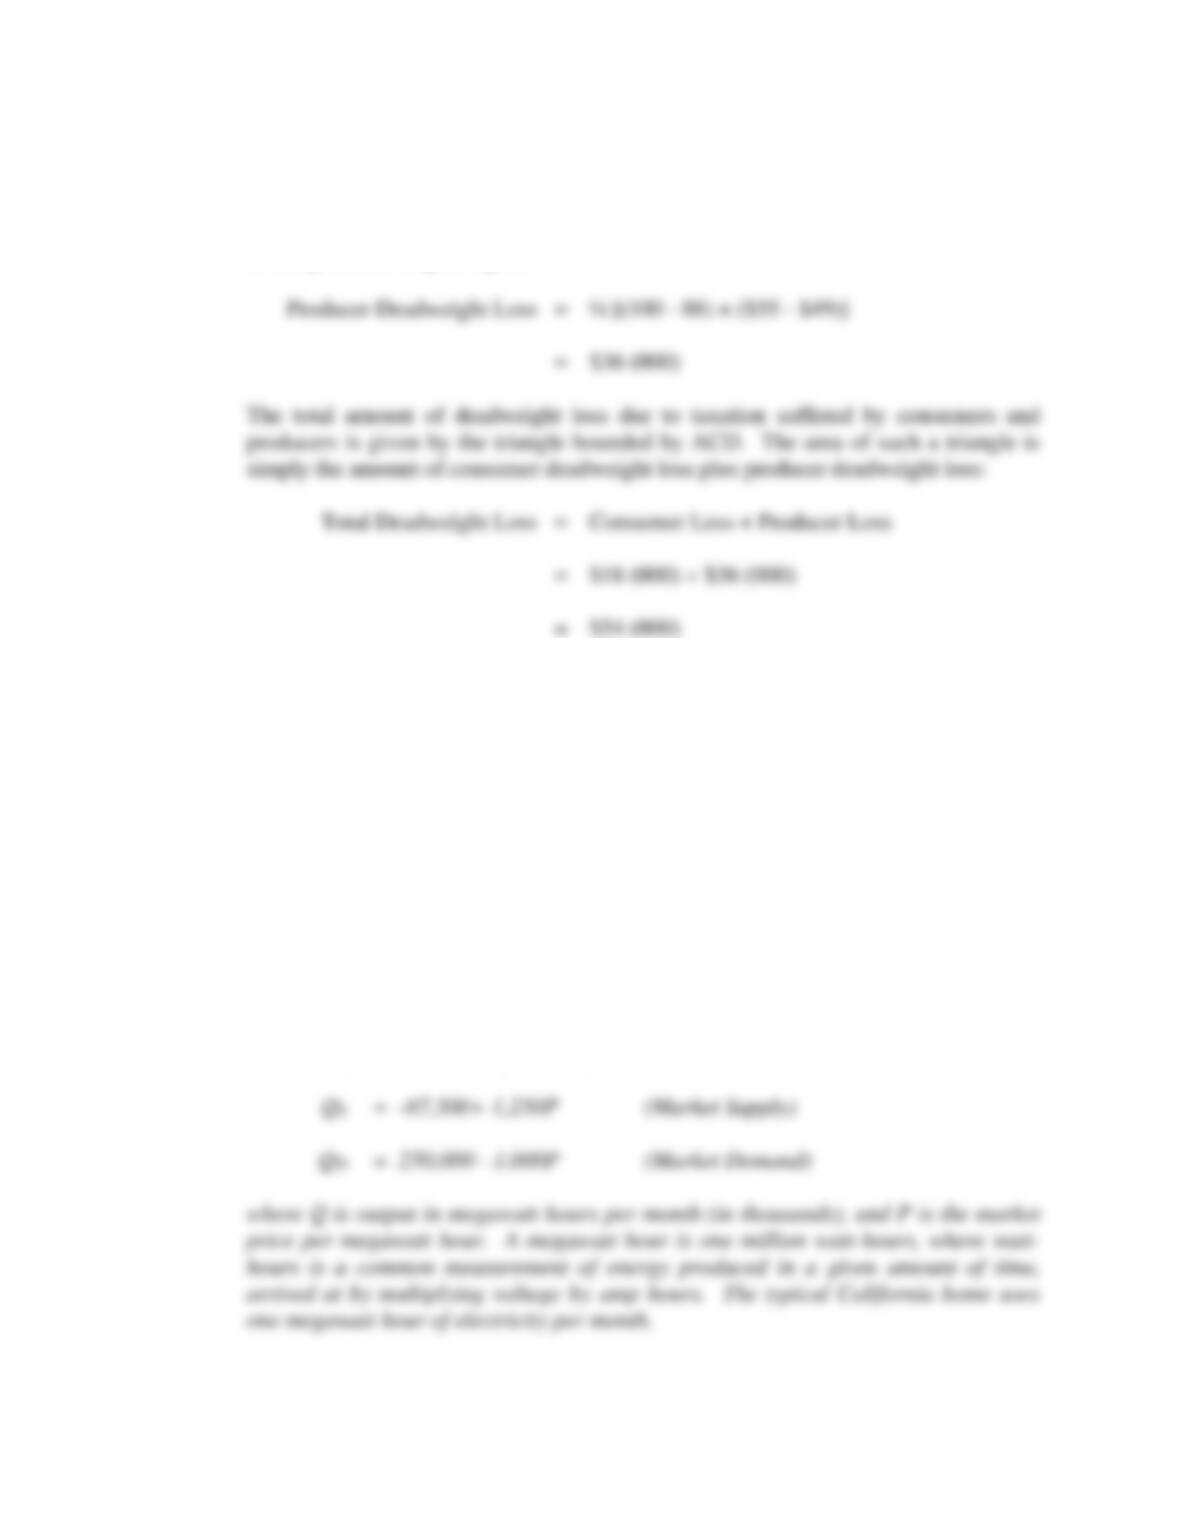
B. The amount of deadweight loss due to taxation suffered by consumers is given by the
triangle bounded by ABD. Because the area of such a triangle is one-half the value
344 Chapter 11
the area of such a triangle is one-half the value of the base times the height, the value
of lost producer surplus equals:
P11.5 Lump Sum Taxes. In 1998, California’s newly deregulated power market began
operation. The large power utilities in the state turned over control of their electric
transmission facilities to the new Independent System Operator (ISO) to assure fair
access to transmission by all generators. The new California Power Exchange
(CalPX) opened to provide a competitive marketplace for the purchase and sale of
electric generation. The deregulation required electric utilities to split their business
into generation, transmission, and distribution businesses. The utilities continue to
own all of the transmission and distribution facilities, but the ISO controls all of the
transmission facilities. Utilities provide all distribution services, but customers are
allowed to choose their energy supplier. The utilities were required to sell off 50%
of their generating facilities. In addition, utilities have to sell all their electric
generation to the Power Exchange and purchase all power for their customers
through the Power Exchange. To illustrate the net amount of social welfare
generated by a competitive power market, assume that market supply and demand
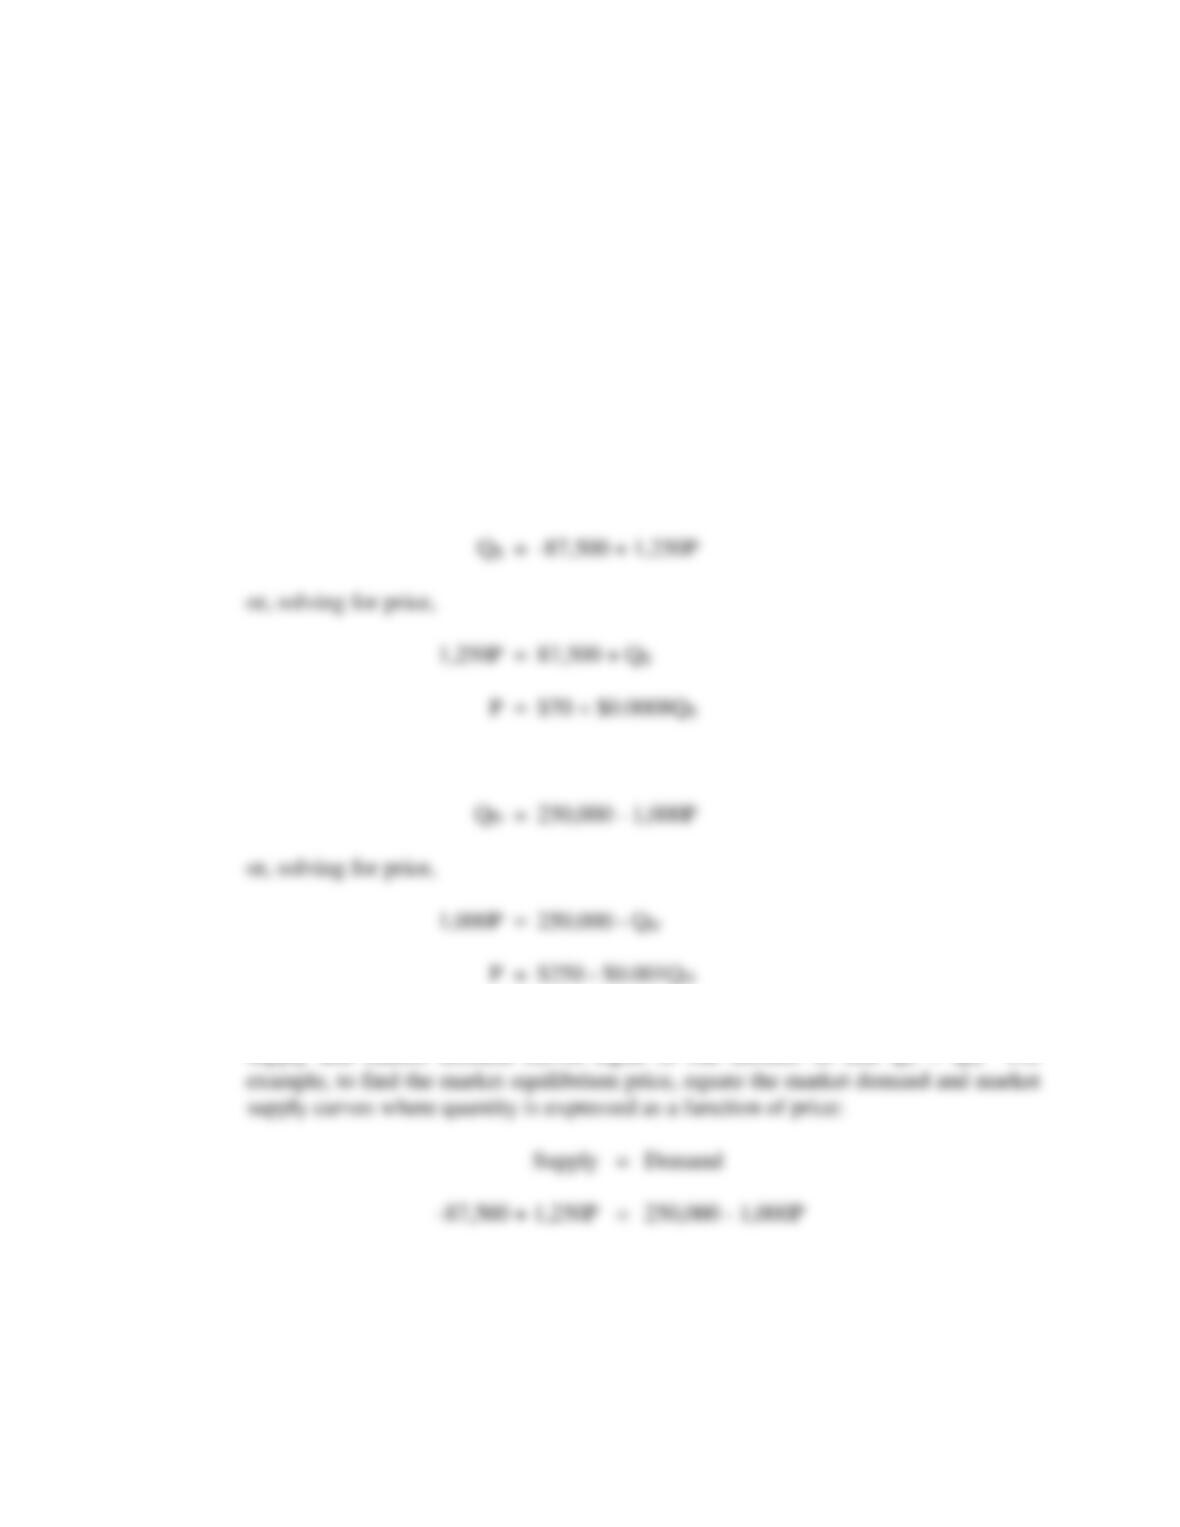
conditions for electric energy in California are:
Performance and Strategy in Competitive Markets 345
A. Graph and calculate the equilibrium price/output solution. Use this graph to
help you algebraically determine the amount of producer surplus generated in
this market.
B. Calculate the maximum lump-sum tax that could be imposed on producers
without affecting the short-run supply of electricity. Is such a tax apt to affect
the long-run supply of electricity? Explain.
P11.5 SOLUTION
A. The market supply curve is given by the equation
The market demand curve is given by the equation
To find the market equilibrium levels for price and quantity, simply set the market
supply and market demand curves equal to one another so that QS = QD. For
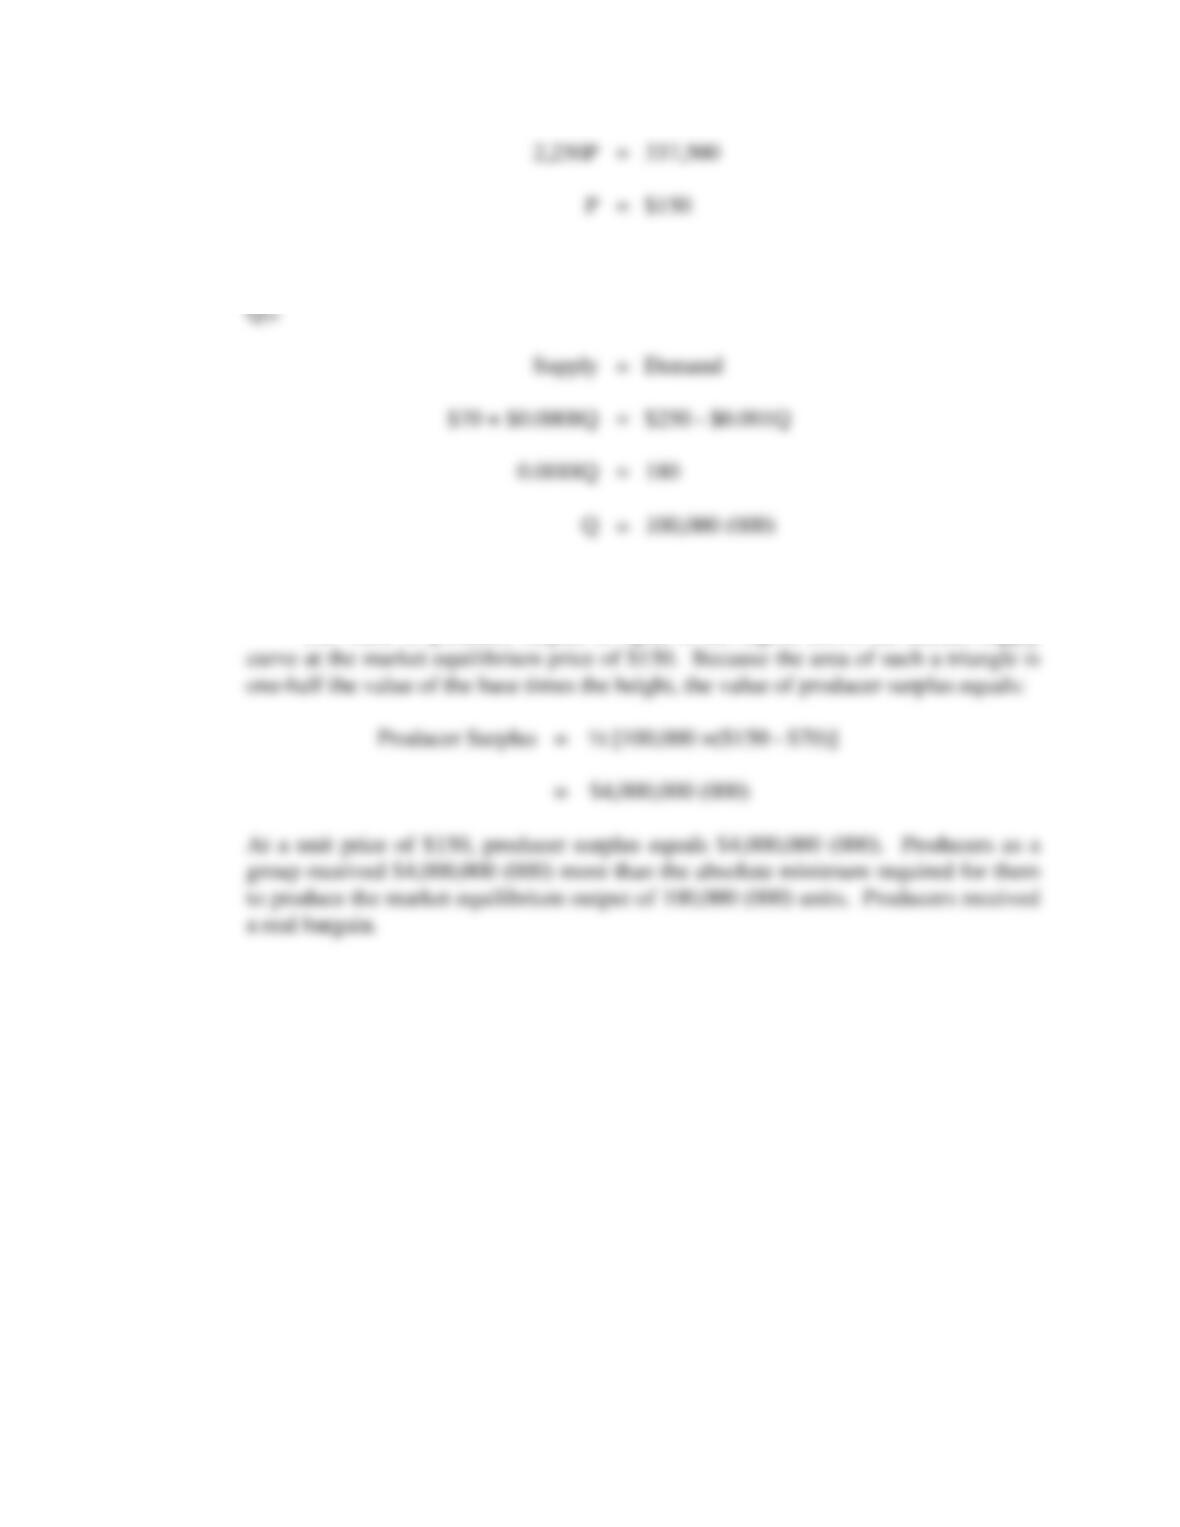
To find the market equilibrium quantity, set equal the market supply and
market demand curves where price is expressed as a function of quantity, and QS =
Therefore, the equilibrium price-output combination is a market price of $150
with an equilibrium output of 100,000 (000) units.
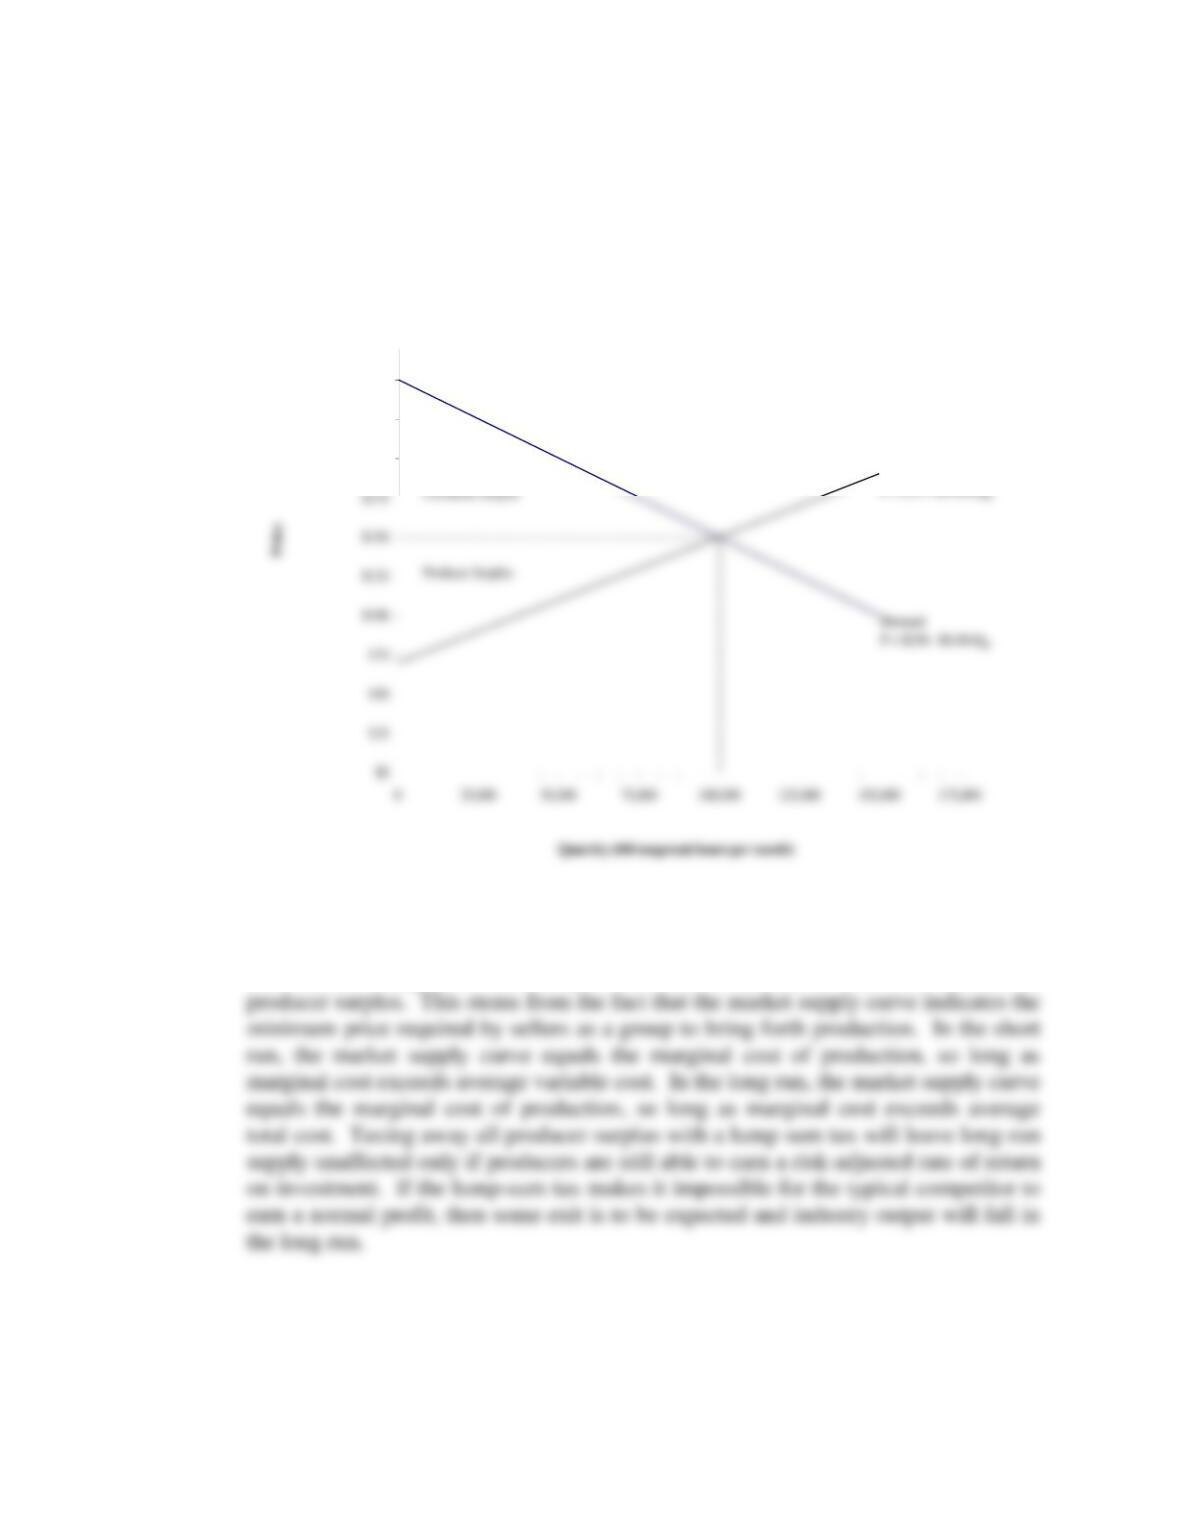
The value of producer surplus is equal to the region above the market supply
Performance and Strategy in Competitive Markets 347
Electricity Market Equilibrium
$200
$225
$250
Supply
B. The maximum lump-sum tax that could be imposed on producers without affecting
the short-run supply of electricity is $4,000,000 (000), or the total amount of
P11.6 Demand v. Supply Subsidy. In Africa, the continent where the polio epidemic has
been most difficult to control, international relief efforts aimed at disease eradication
often work against a backdrop of civil unrest and war. In some countries, temporary
cease-fire agreements must be negotiated to allow vaccination and prevent serious
348 Chapter 11
outbreaks from occurring. During peacetime and during war, low incomes make
paying for the vaccine a real problem among the poor. To make the oral polio
vaccine more affordable, either consumer purchases (demand) or production
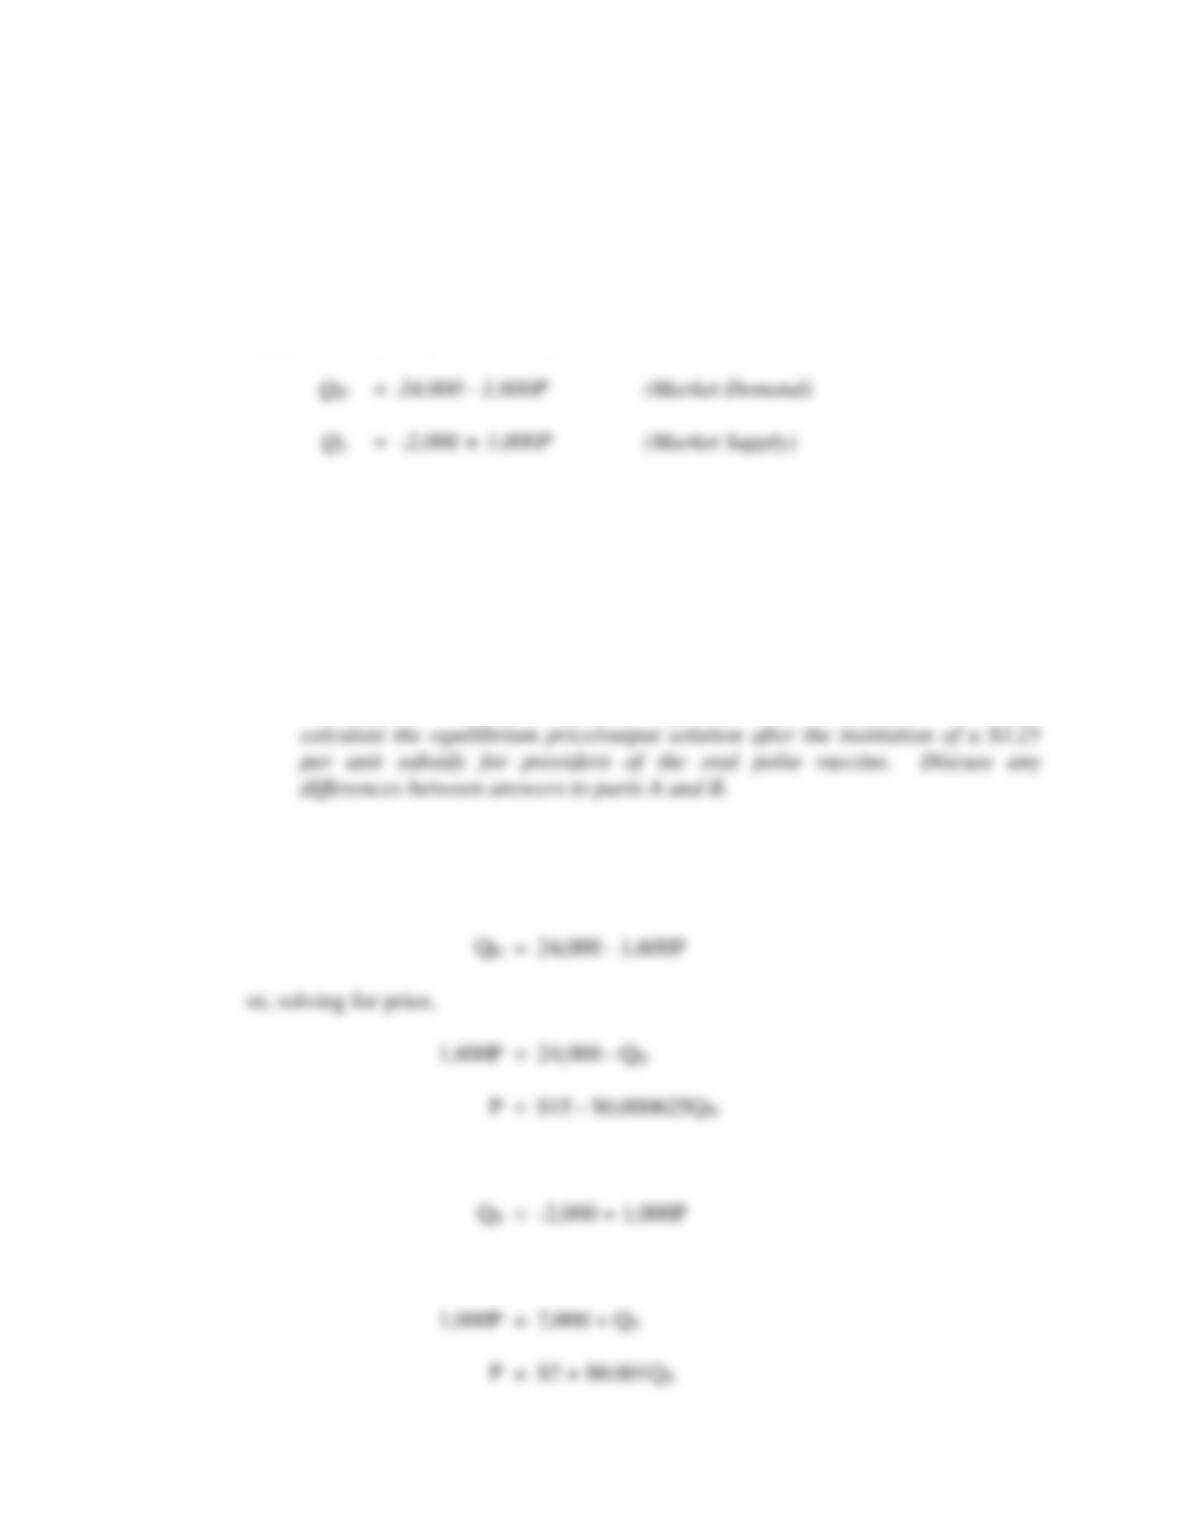
(supply) can be subsidized. Consider the following market demand and market
supply curves for a generic oral polio vaccine:
where Q is output measured in doses of oral vaccine (in thousands), and P is the
market price in dollars.
A. Vouchers have a demand-increasing effect. Graph and calculate the
equilibrium price/output solution before and after the institution of a voucher
system whereby consumers can use a $3.25 voucher to supplement cash
payments.
B. Per-unit producer subsidies have a marginal cost-decreasing effect. Show and
P11.6 SOLUTION
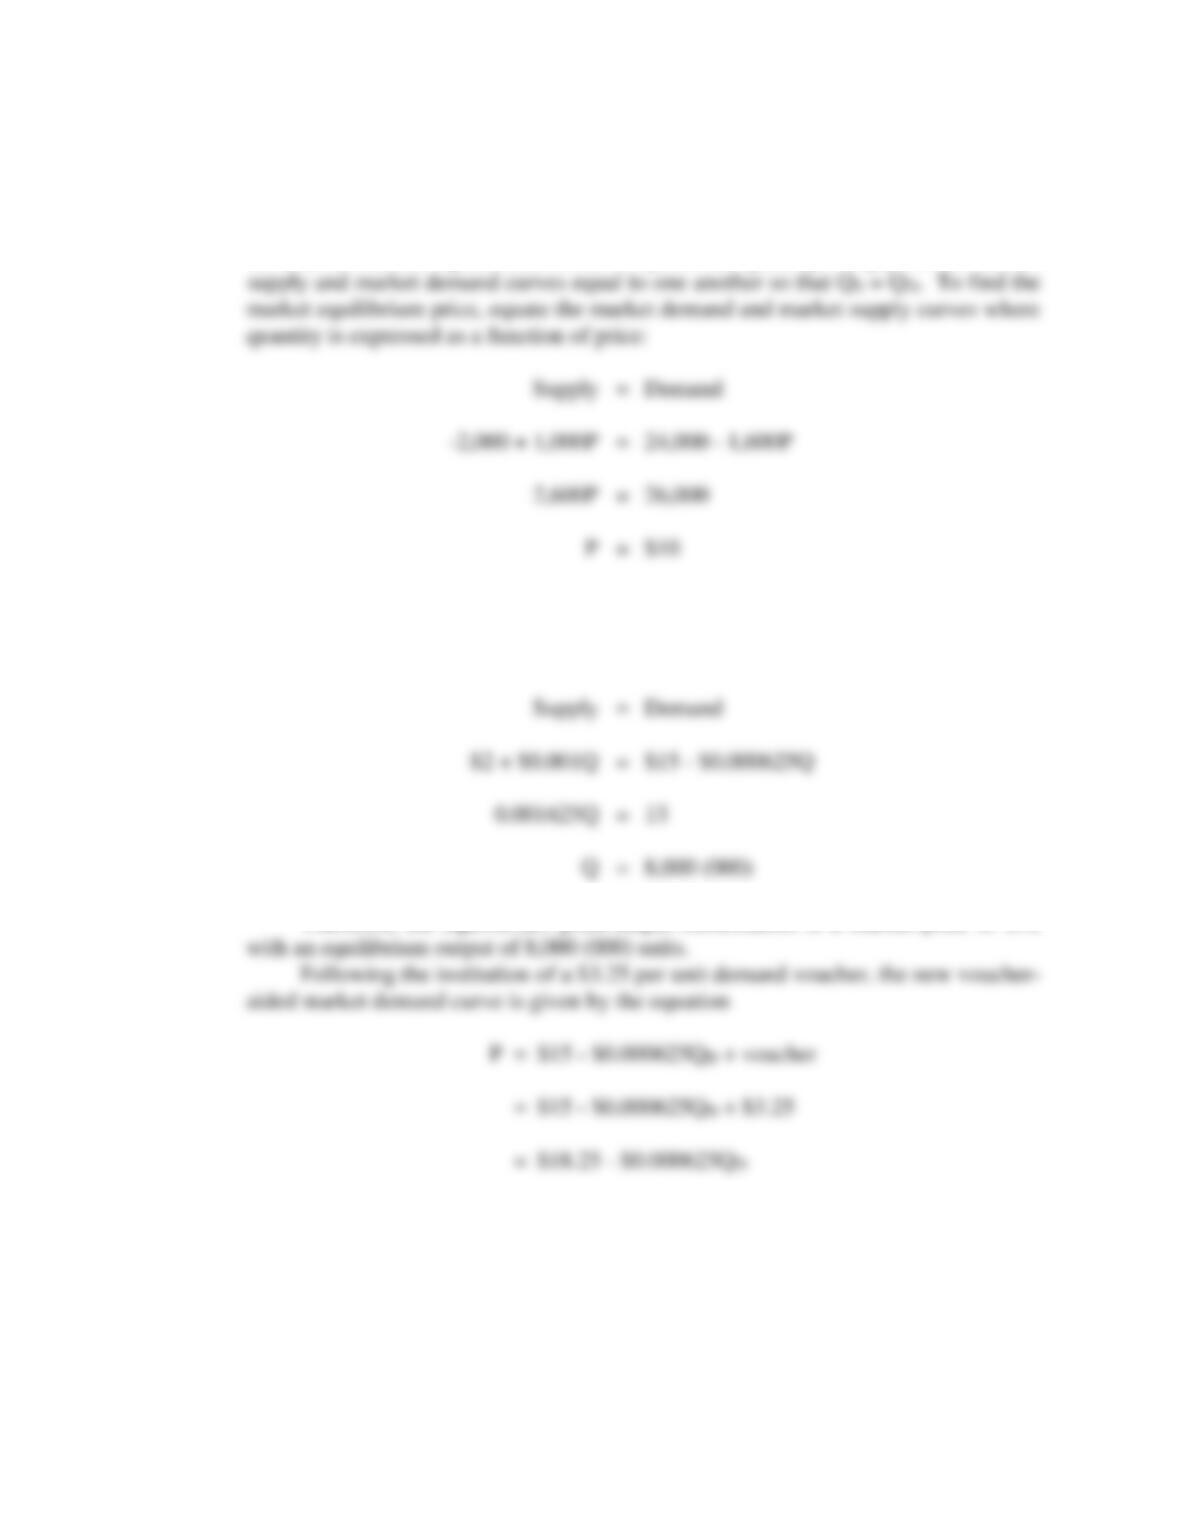
A. The market demand curve is given by the equation
The market supply curve is given by the equation
or, solving for price,
Performance and Strategy in Competitive Markets 349
To find the market equilibrium levels for price and quantity, simply set the market
To find the market equilibrium quantity, set equal the market supply and
market demand curves where price is expressed as a function of quantity, and QS =
QD:
Therefore, the equilibrium price-output combination is a market price of $10
or, solving for quantity,
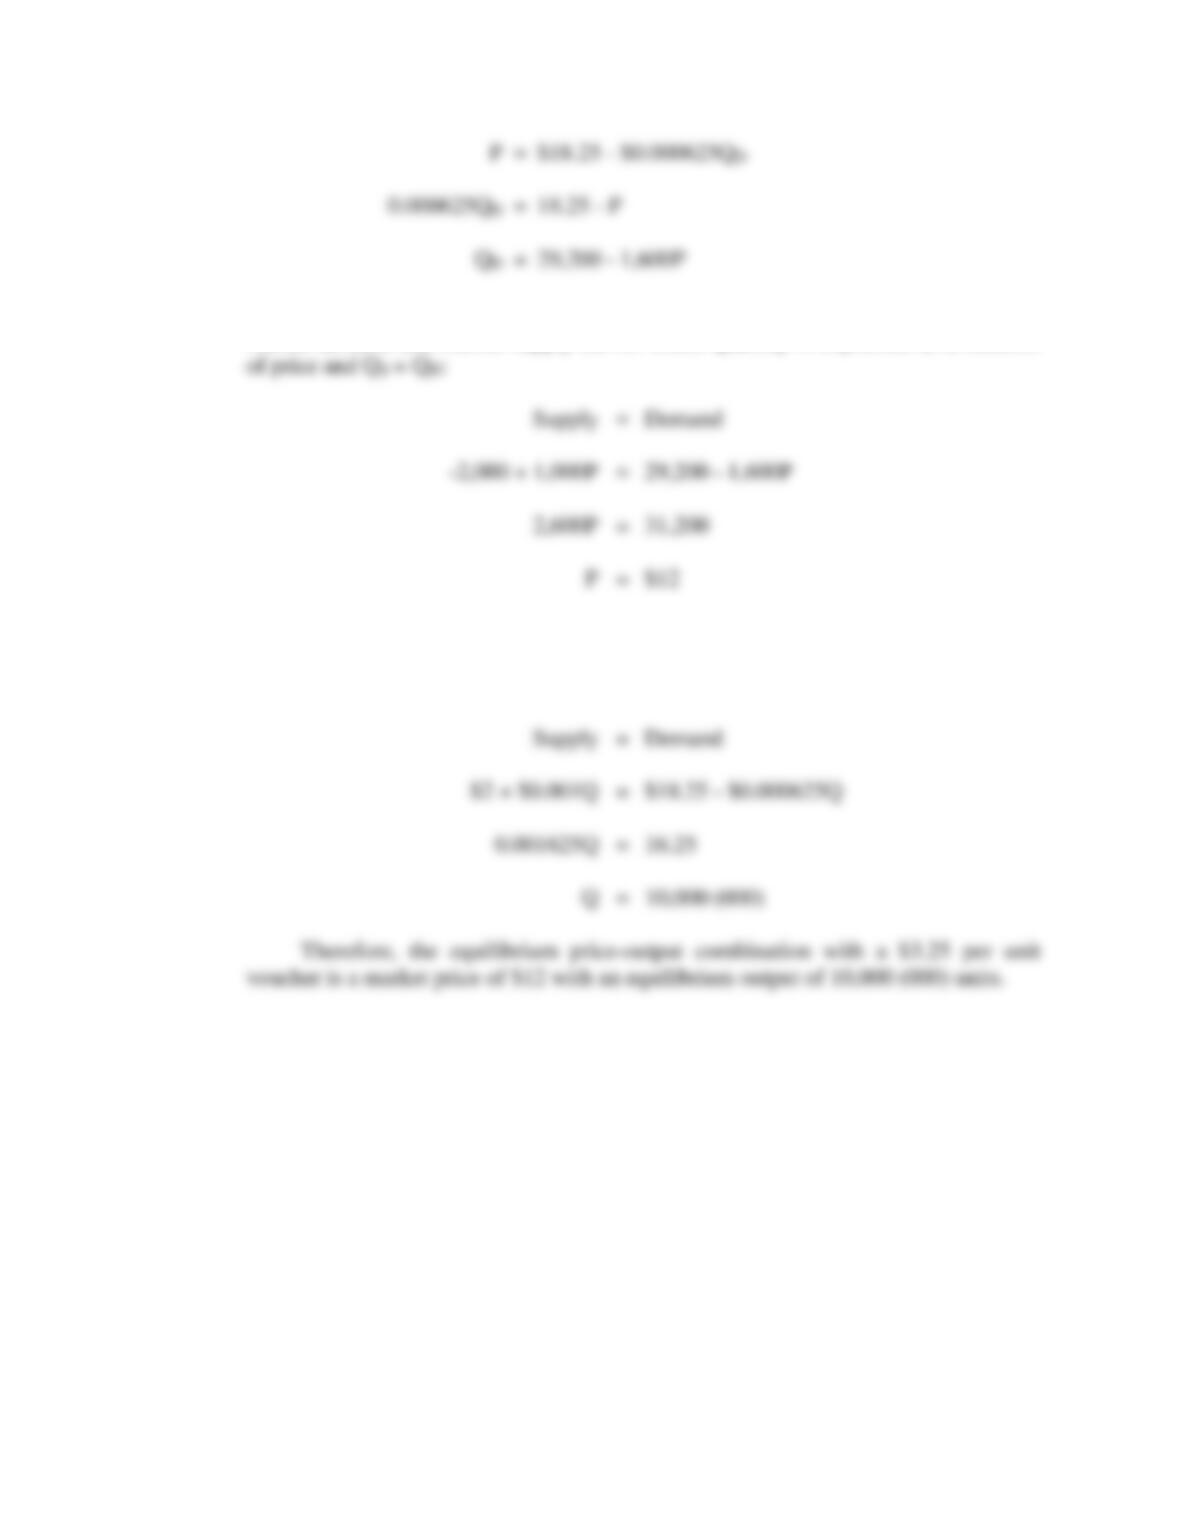
To find the new market equilibrium price, equate the new voucher-aided
market demand and market supply curves where quantity is expressed as a function
To find the market equilibrium quantity, set equal the market supply and
market demand curves where price is expressed as a function of quantity, and QS =
QD:
Performance and Strategy in Competitive Markets 351
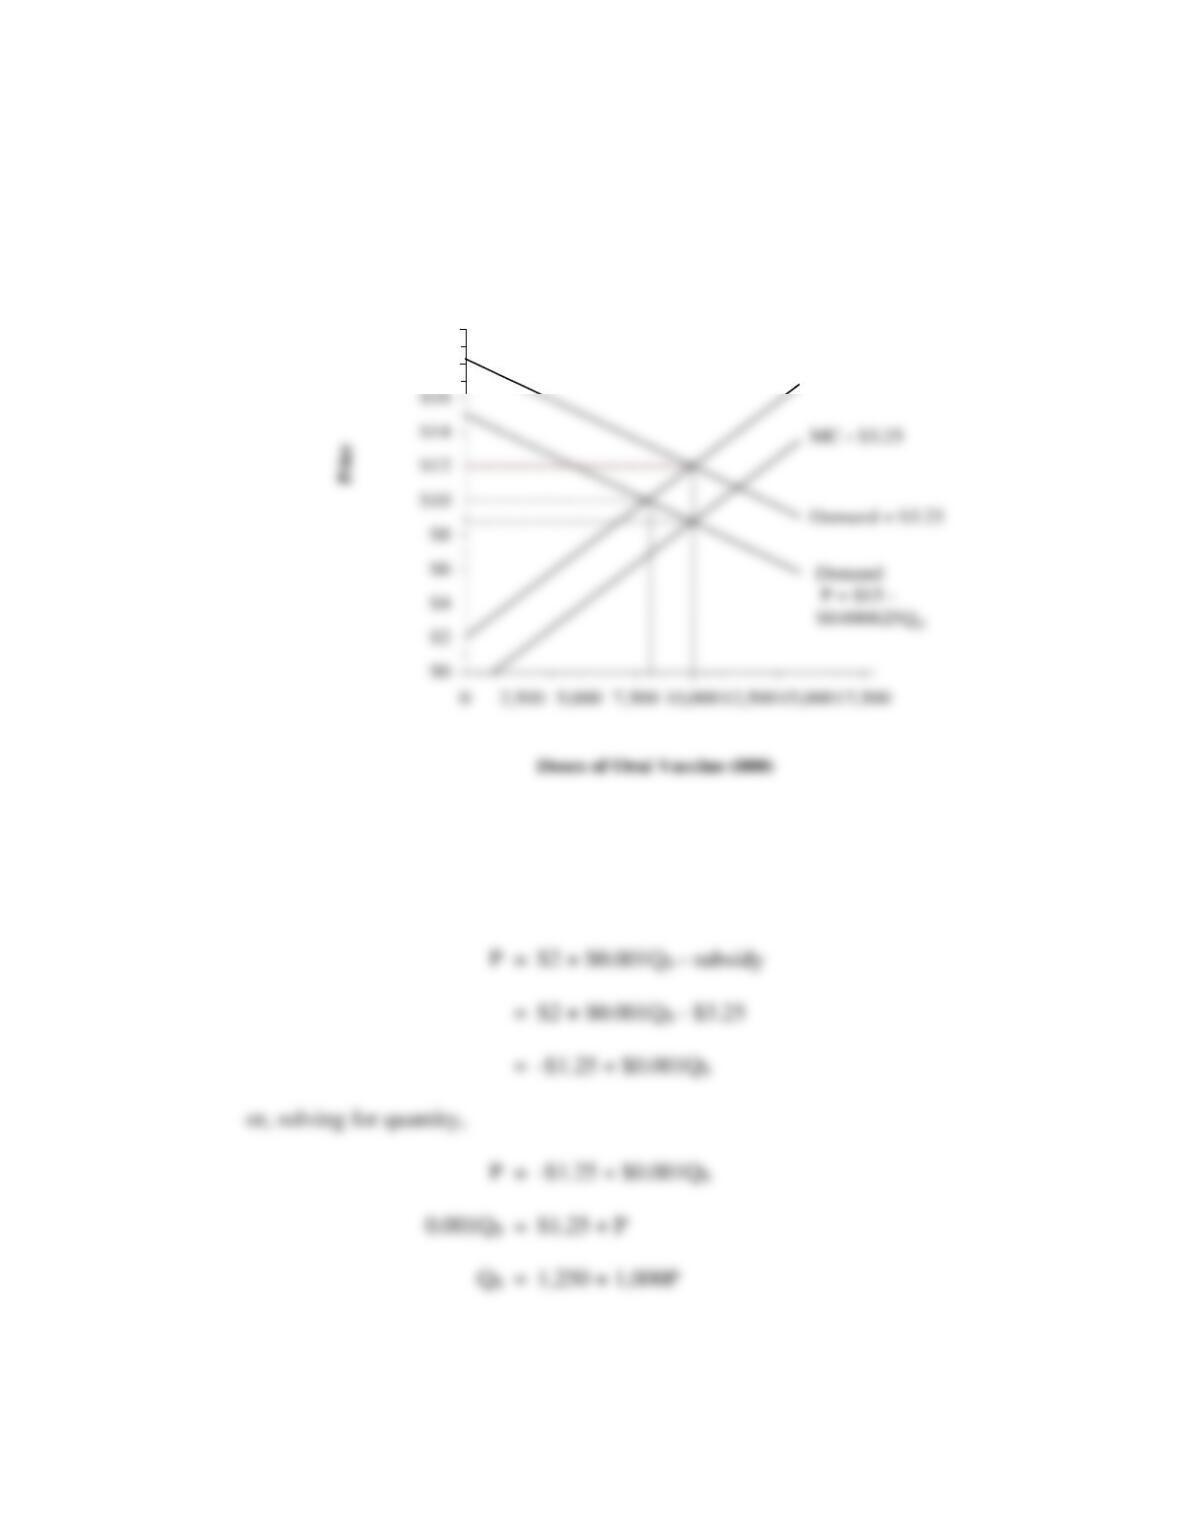
Polio Vaccine Equilibrium
$18
$20
Supply
P = $2 + $0.001QS
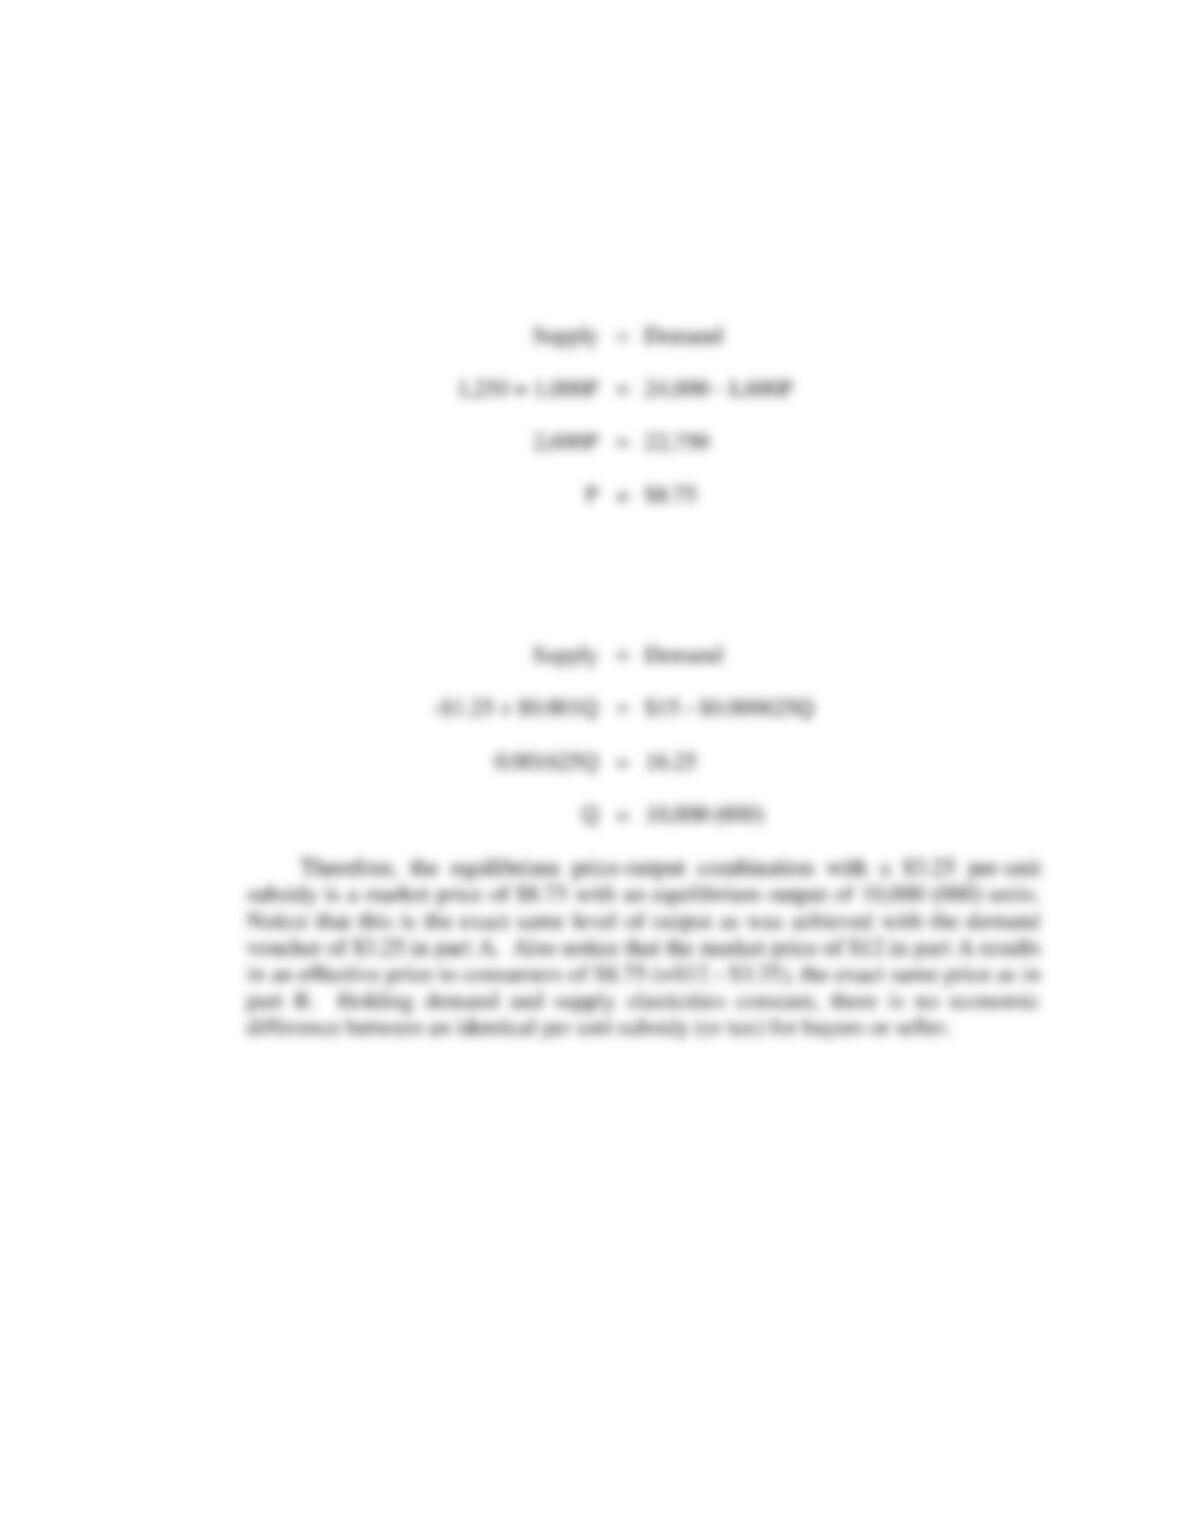
B. Following the institution of a $3.25 per unit producer subsidy, the new subsidy-aided
market supply curve is given by the equation
352 Chapter 11
To find the new market equilibrium price, equate the market demand and
subsidy-aided market supply curves where quantity is expressed as a function of
price and QS = QD:
To find the market equilibrium quantity, set equal the market supply and
market demand curves where price is expressed as a function of quantity, and QS =
QD:
P11.7 Price Floors. Each year, about 9 billion bushels of corn are harvested in the United
States. The average market price of corn is a little over $2 per bushel, but costs
farmers about $3 per bushel. Tax payers make up the difference. Under the 2002
$190 billion, 10-year farm bill, American taxpayers will pay farmers $4 billion a
year to grow even more corn, despite the fact that every year the United States is
faced with a corn surplus. Growing surplus corn also has unmeasured
environmental costs. The production of corn requires more nitrogen fertilizer and
pesticides than any other agricultural crop. Runoff from these chemicals seeps down
into the groundwater supply, and into rivers and streams. Ag chemicals have been
blamed for a 12,000-square-mile dead zone in the Gulf of Mexico. Overproduction
of corn also increases U.S. reliance on foreign oil.
Performance and Strategy in Competitive Markets 353
To illustrate some of the cost in social welfare from agricultural price supports,
assume the following market supply and demand conditions for corn:
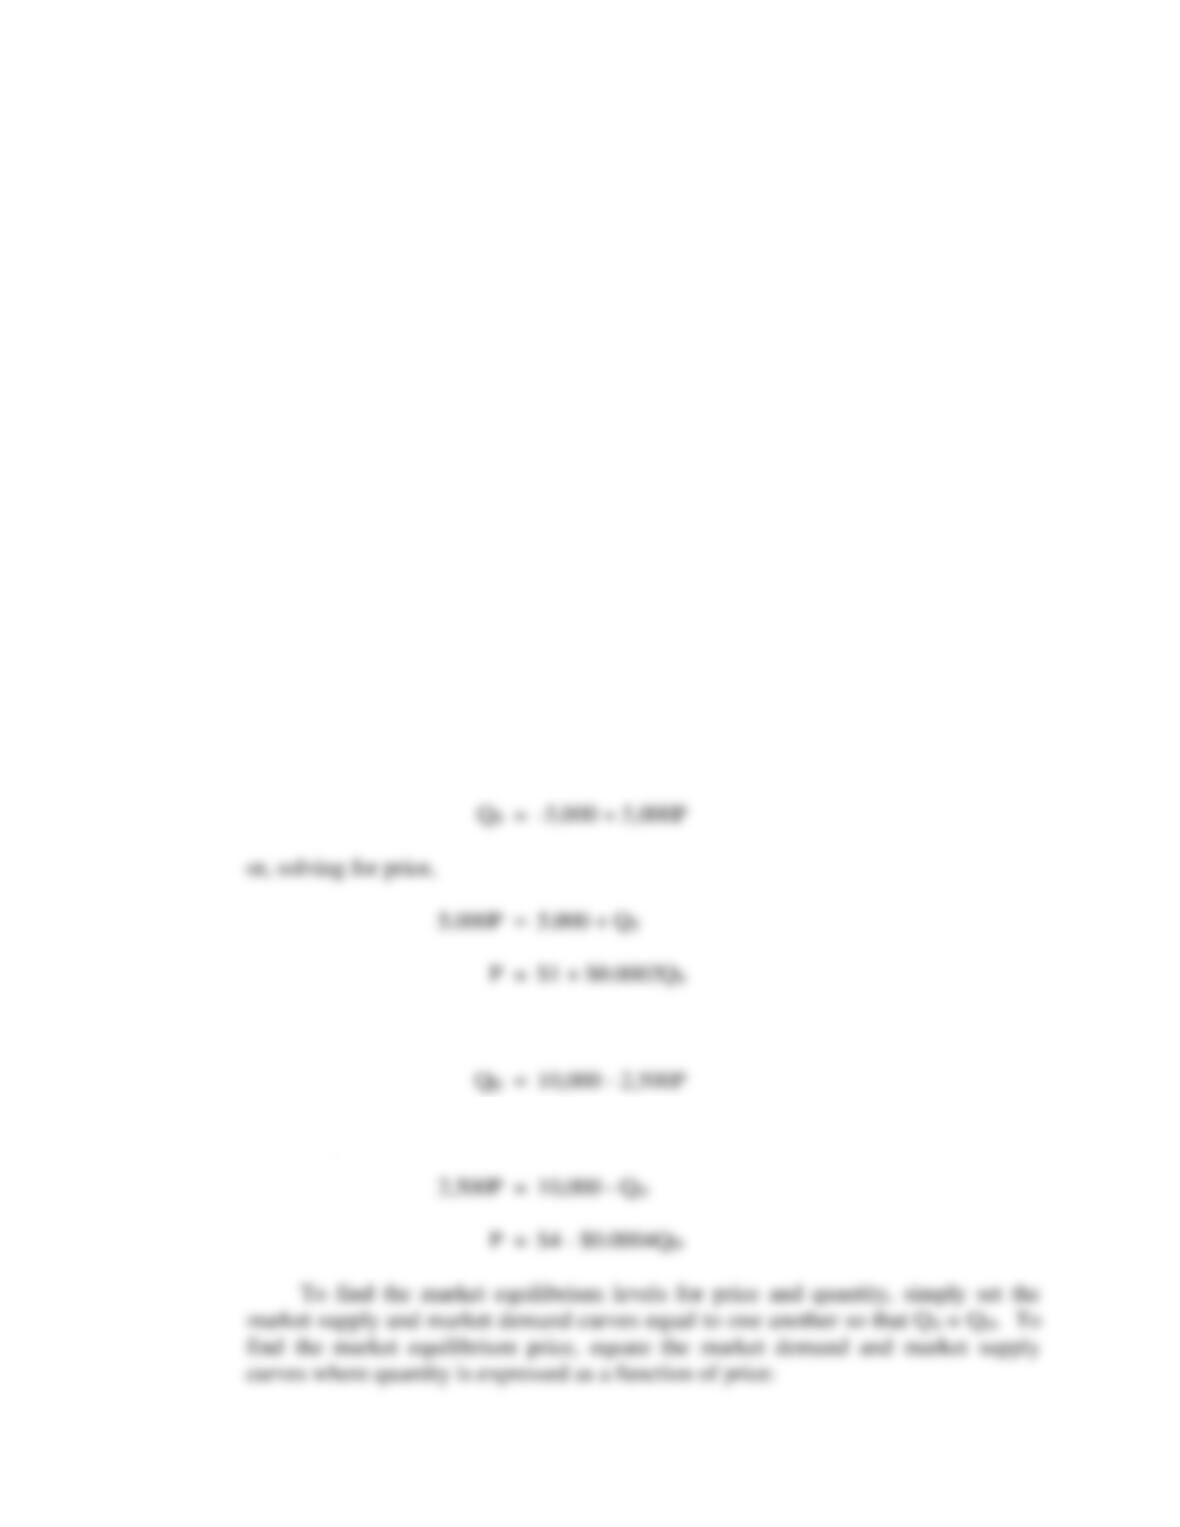
QS = -5,000+ 5,000P (Market Supply)
QD = 10,000 – 2,500P (Market Demand)
where Q is output in bushels of corn (in millions), and P is the market price per
bushel.
A. Graph and calculate the equilibrium price/output solution. Use this graph to
help you algebraically determine the amount of surplus production the
government will be forced to buy if it imposes a support price of $2.50 per
bushel.
B. Use this graph to help you algebraically determine the gain in producer
surplus due to the support price program. Explain.
P11.7 SOLUTION
A. The market supply curve is given by the equation
The market demand curve is given by the equation
or, solving for price,
354 Chapter 11
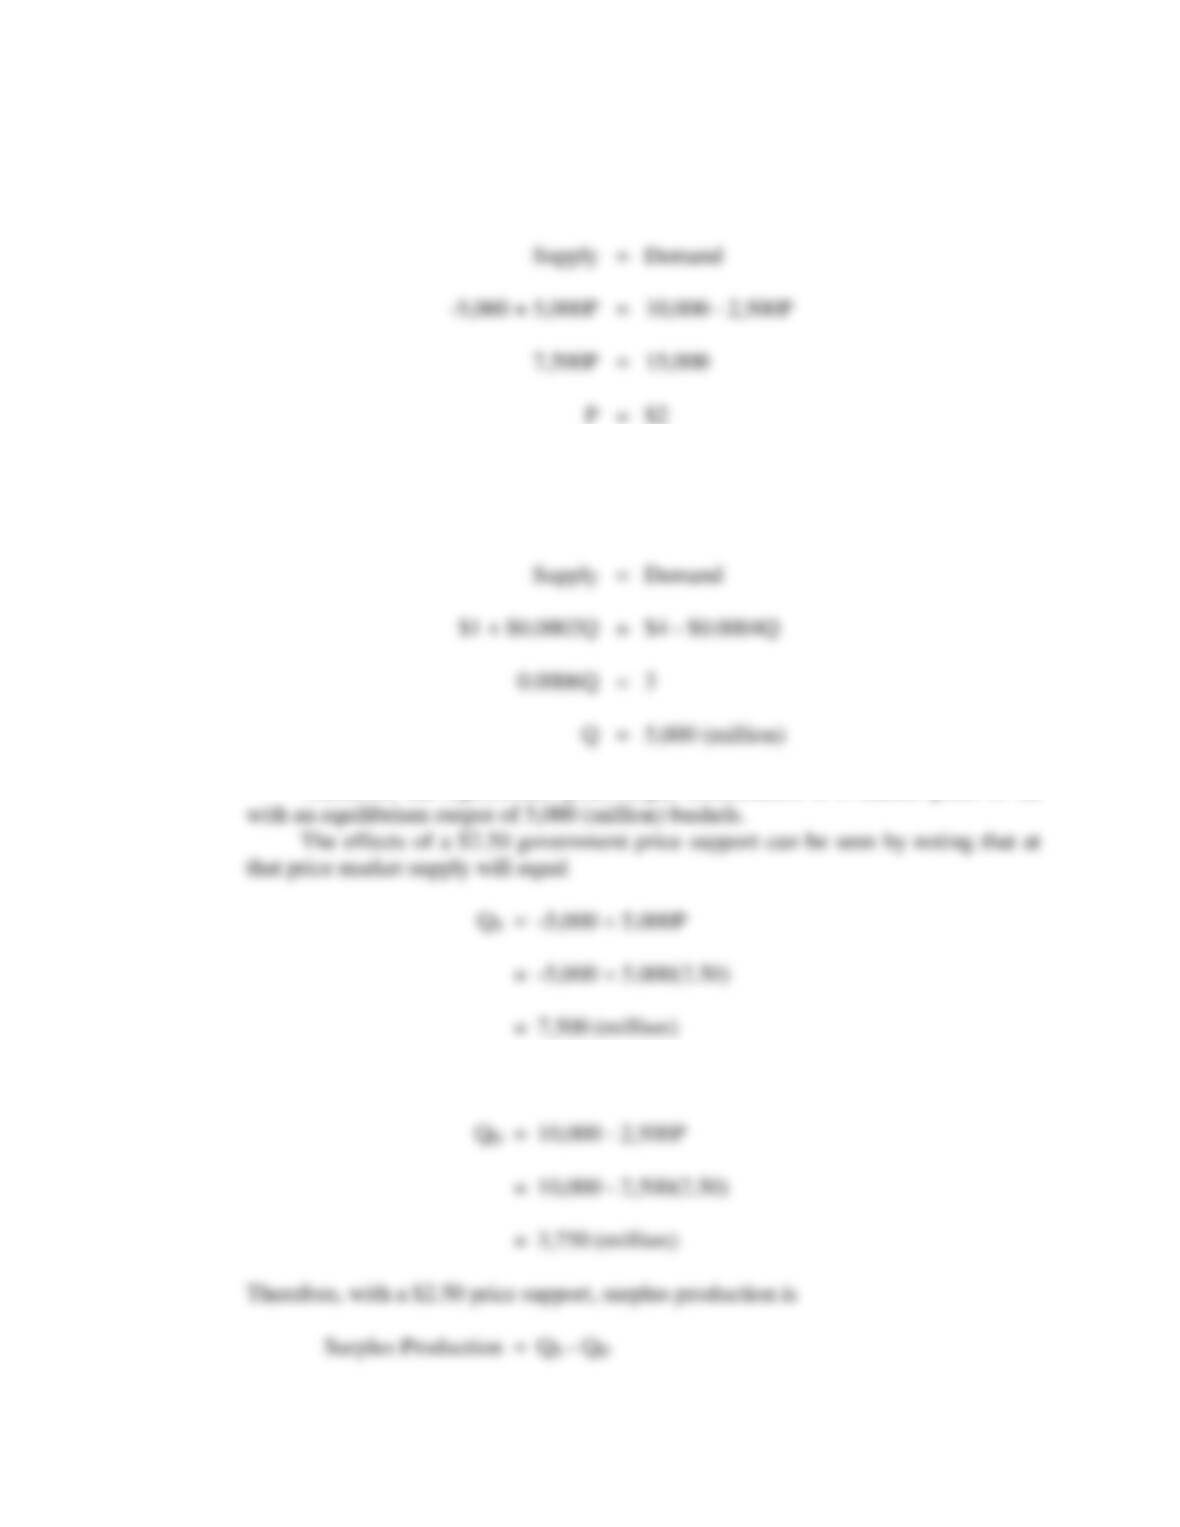
To find the market equilibrium quantity, set equal the market supply and
market demand curves where price is expressed as a function of quantity, and QS =
QD:
Therefore, the equilibrium price-output combination is a market price of $2
At the $2.50 price support, market demand will equal