S-159
interactive activity
Appendix
10
Consumer Preferences
and Consumer Choice
1. For each of the following situations, draw a diagram containing three of
Isabella’s indifference curves.
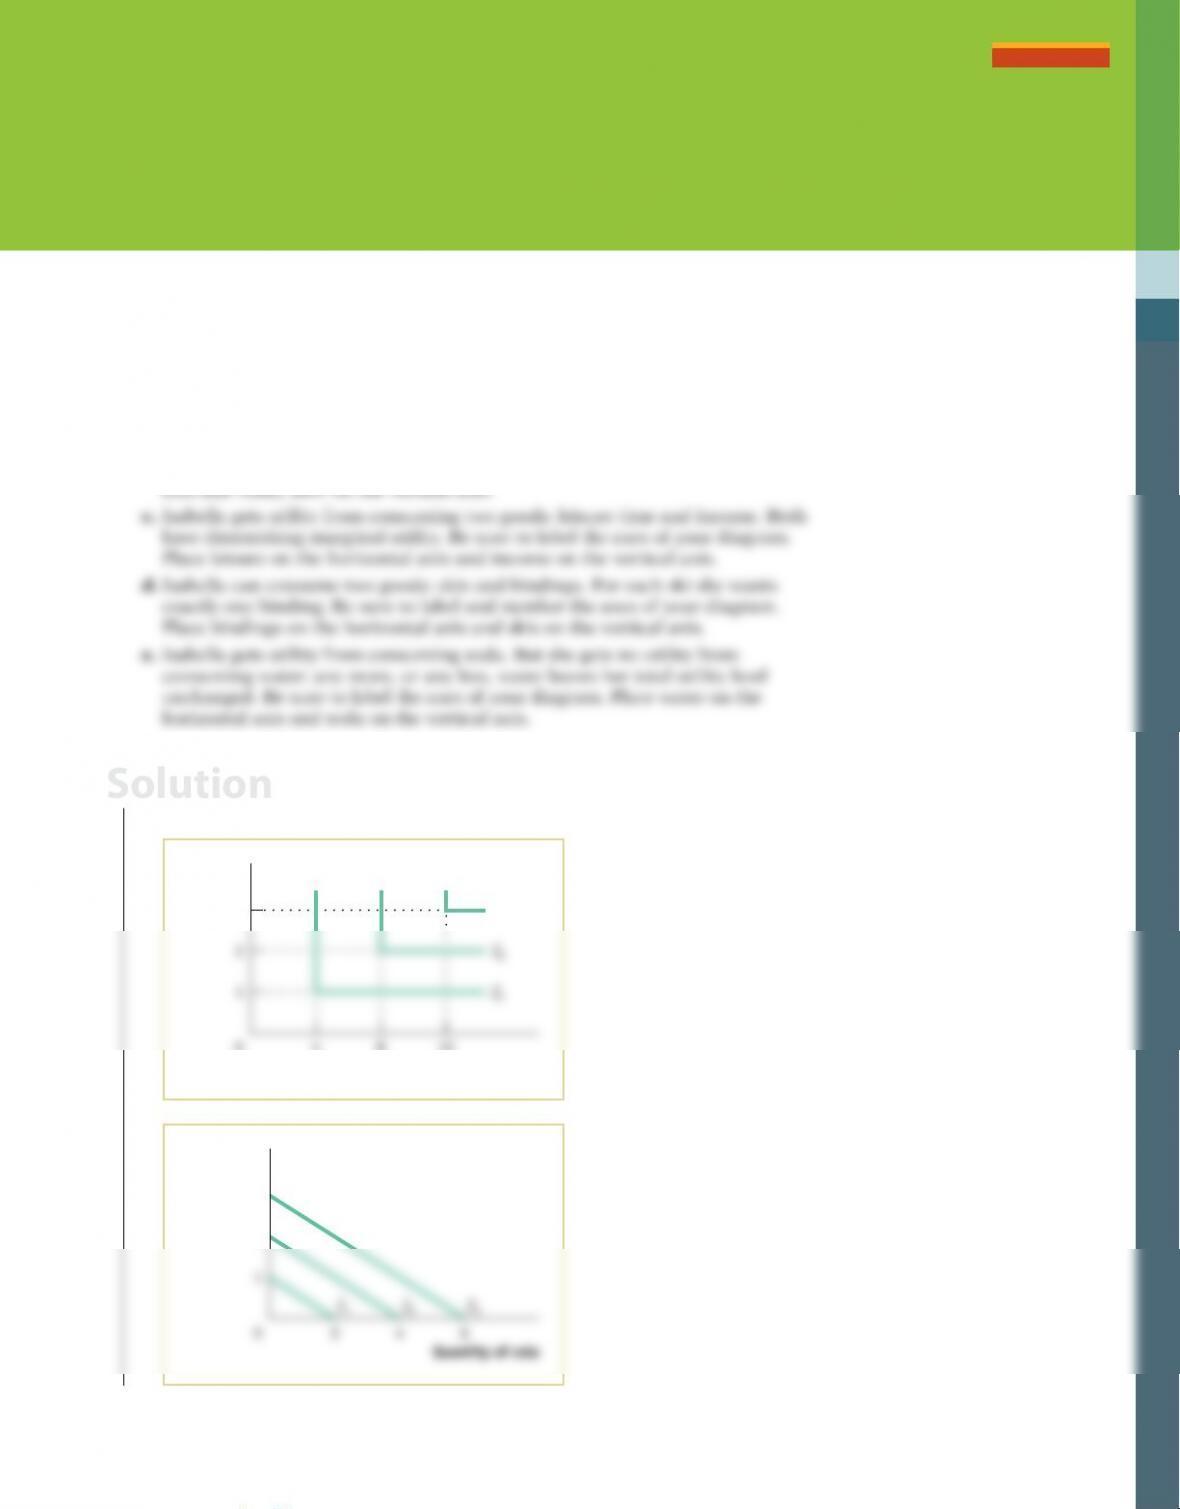
a. For Isabella, cars and tires are perfect complements, but in a ratio of 1:4; that
is, for each car, Isabella wants exactly four tires. Be sure to label and number
the axes of your diagram. Place tires on the horizontal axis and cars on the
vertical axis.
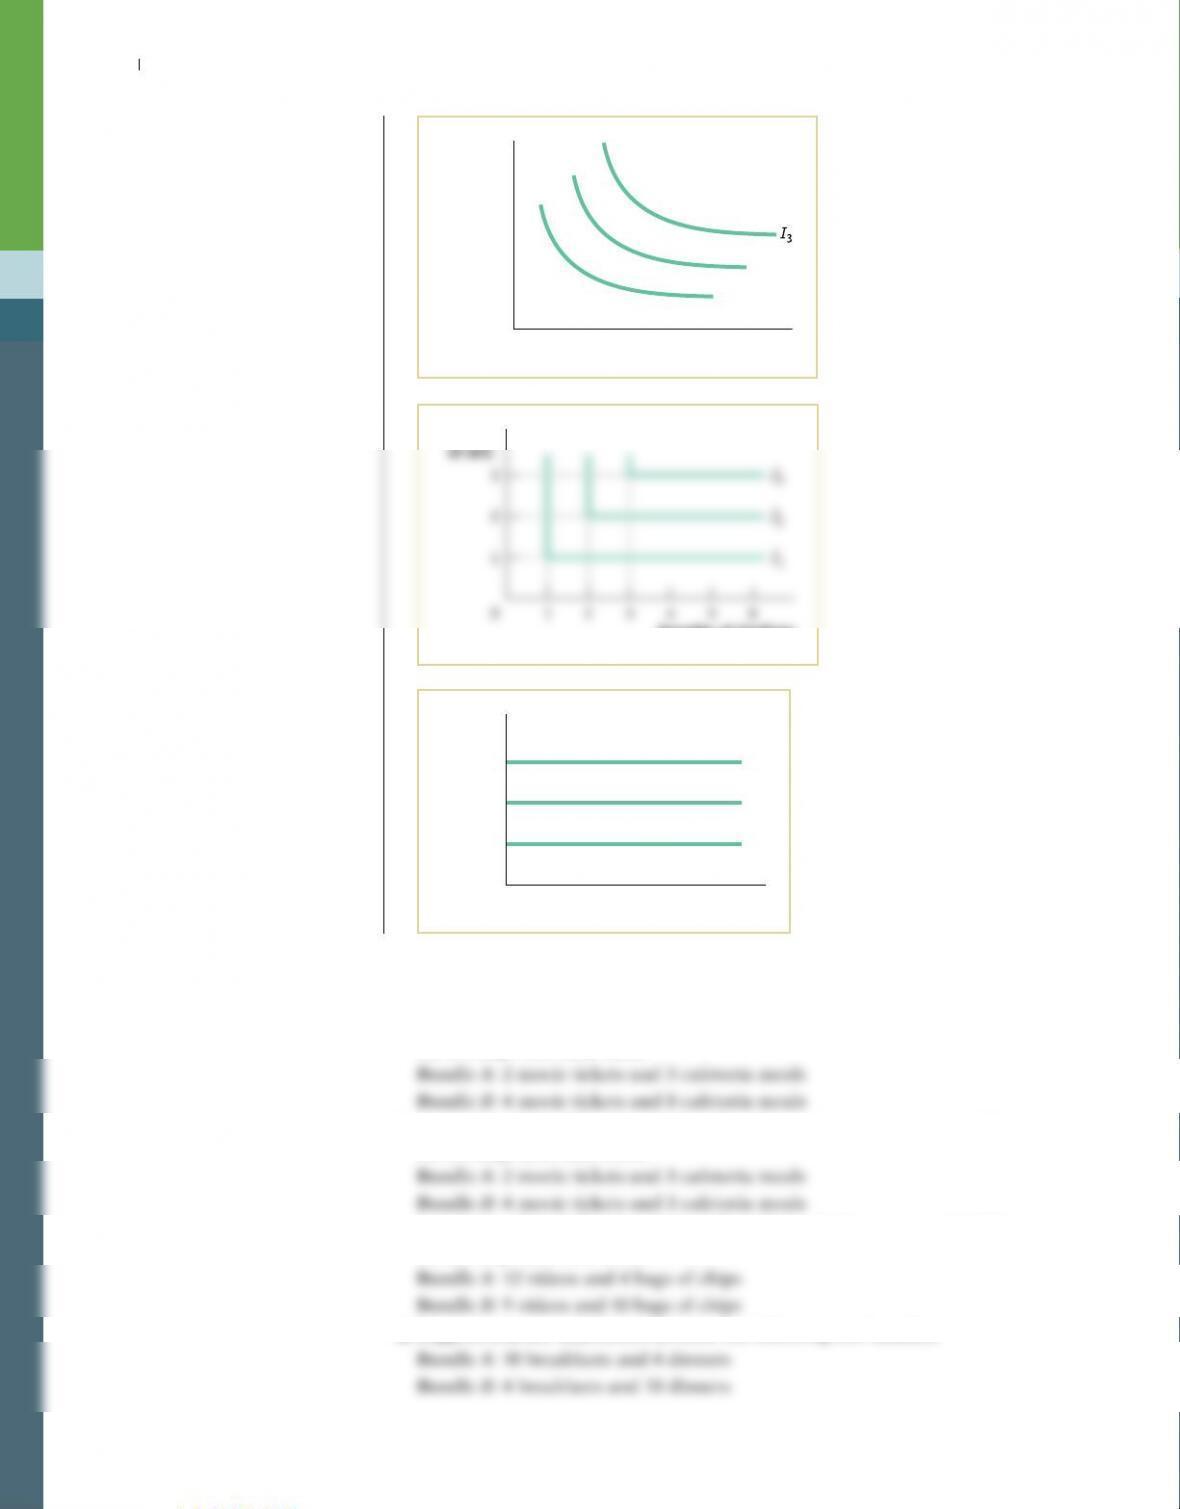
b. Isabella gets utility only from her caffeine intake. She can consume Valley
Dew or cola, and Valley Dew contains twice as much caffeine as cola. Be sure
to label and number the axes of your diagram. Place cola on the horizontal
axis and Valley Dew on the vertical axis.
1. Following are Isabella’s indifference curve maps for each of the situations
described.
a.
48120
3
Quantity
of cars
Quantity of tires
I3
b.
3
2
Quantity of
Valley Dew
Quantity of cola
I1I2I3
Solution
S-160 10 APPENDIX CONSUMER PREFERENCES AND CONSUMER CHOICE
c.
Quantity
of
income
Quantity of leisure
I1
I2
d.
1234560
3
2
1
Quantity
Quantity of bindings
I1
I2
I3
e.
Quantity
of soda
Quantity of water
I2
I1
I3
2. Use the four properties of indifference curves for ordinary goods illustrated in
Figure 10–4 to answer the following questions.
a. Can you rank the following two bundles? If so, which property of indifference
curves helps you rank them?
b. Can you rank the following two bundles? If so, which property of indifference
curves helps you rank them?
c. Can you rank the following two bundles? If so, which property of indifference
curves helps you rank them?
d. Suppose you are indifferent between the following two bundles:
10 APPENDIX CONSUMER PREFERENCES AND CONSUMER CHOICE S-161
Now compare bundle A and the following bundle:
Bundle C: 7 breakfasts and 7 dinners
Can you rank bundle A and bundle C? If so, which property of indifference
curves helps you rank them? (Hint: It may help if you draw this, placing din-
2. a. Because bundle B has more movie tickets and more cafeteria meals than bun-
dle A, it is preferred. The reason is that more is better.
b. Compared to bundle A, bundle B has the same number of cafeteria meals but
more movie tickets. Again, because more is better, bundle B is preferred.
c. Bundle A has more videos than bundle B, but bundle B has more bags of chips
than bundle A. The “more is better” principle does not help us rank these two
bundles. Without more information, they cannot be ranked.
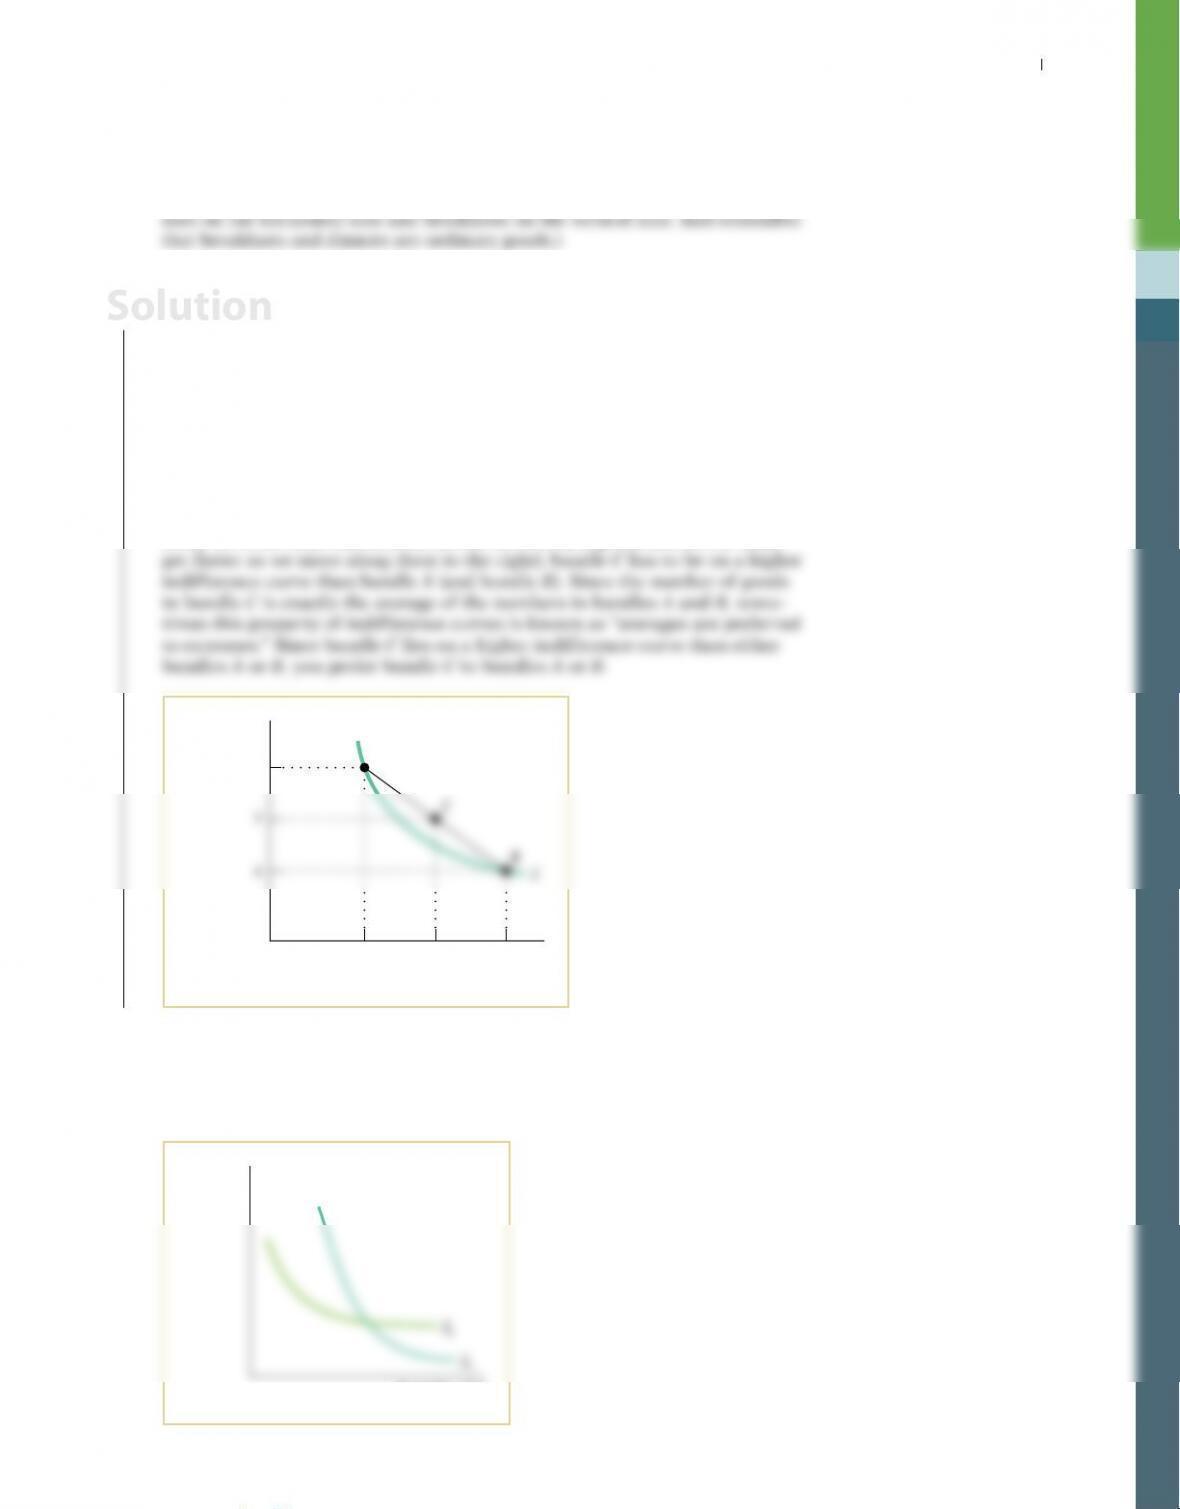
d. Since we know that you are indifferent between bundle A and bundle B, we
know that they lie on the same indifference curve. Note in the accompany-
ing diagram that bundle C lies on a straight line between bundles A and B.
Since we know that indifference curves for ordinary goods are convex (they
71
040
10
Quantity of
breakfasts
Quantity of dinners
A
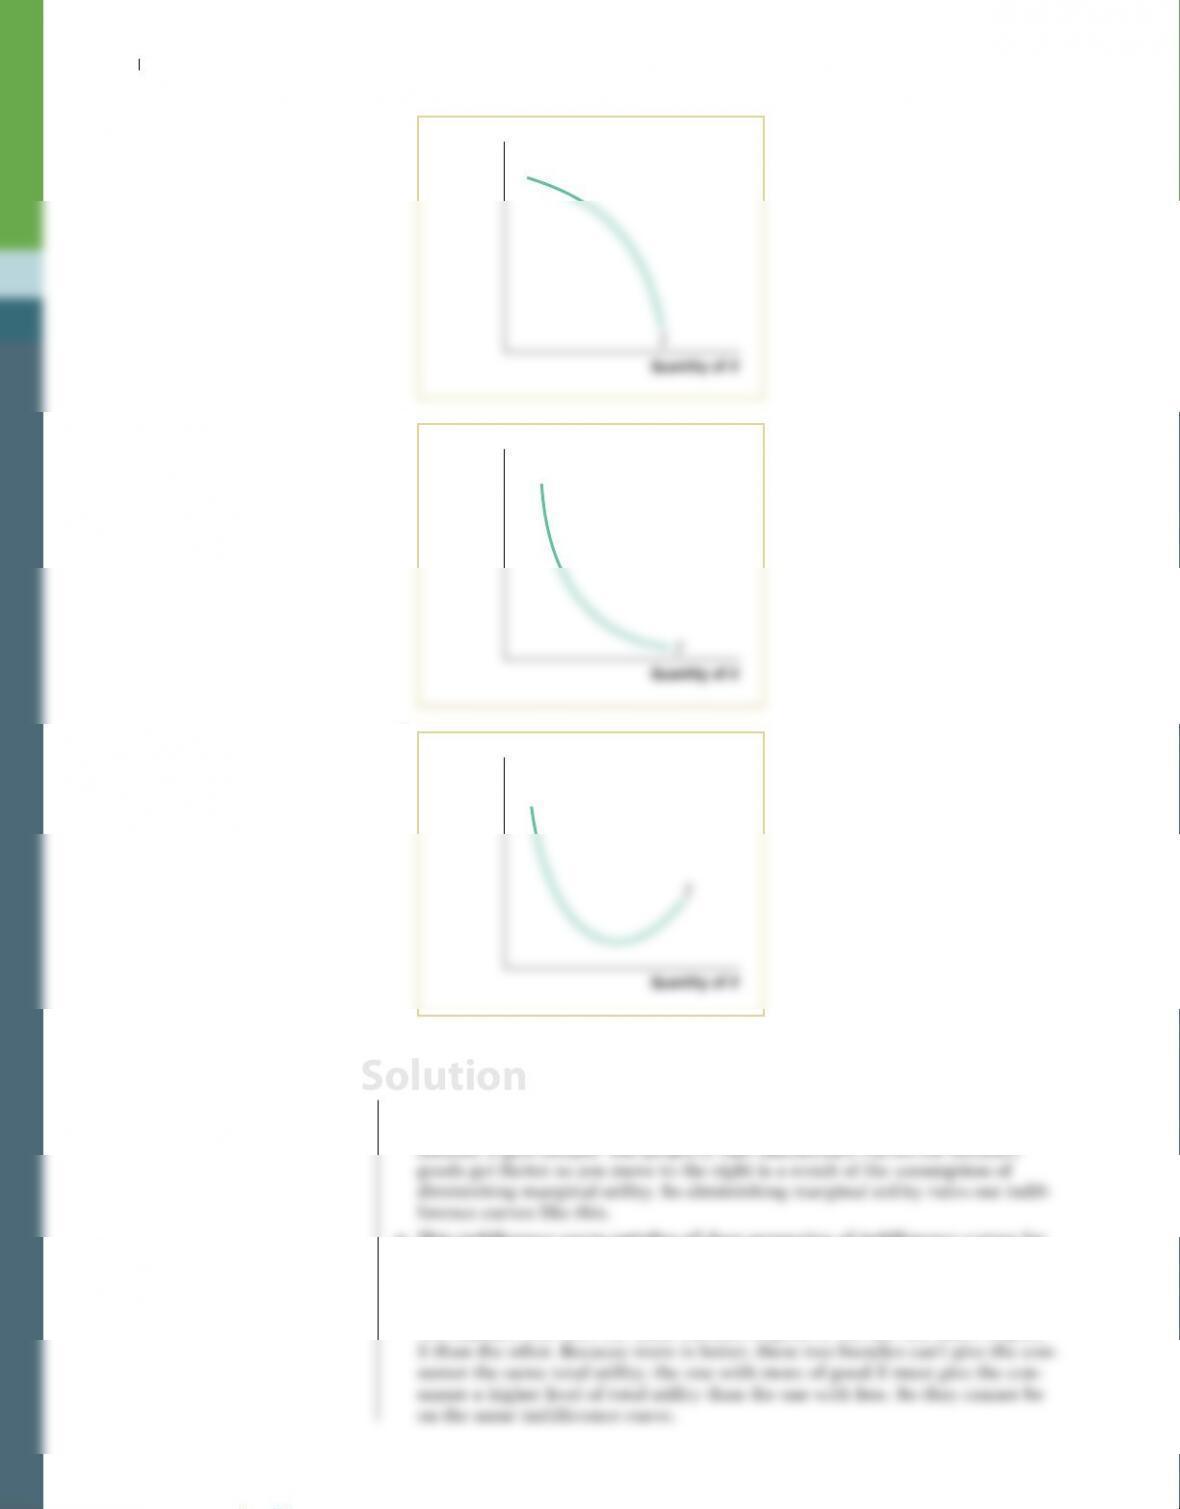
3. The four properties of indifference curves for ordinary goods illustrated in
Figure 10–4 rule out certain indifference curves. Determine whether those
general properties allow each of the following indifference curves. If not, state
which of the general principles rules out the curves.
a.
Quantity
of Y
Quantity of X
I1
I2
Solution
S-162 10 APPENDIX CONSUMER PREFERENCES AND CONSUMER CHOICE
b.
Quantity
of Y
Quantity of X
I
c.
Quantity
of Y
Quantity of X
I
d.
Quantity
of Y
Quantity of X
I
3. a. These indifference curves cross. One of the properties of indifference curves is
that they never cross. This rules out indifference curves like these.
b. This indifference curve does not get flatter as you move along it to the right;
instead, it gets steeper. The property that indifference curves for ordinary
c. This indifference curve satisfies all four properties of indifference curves for
ordinary goods.
d. This curve has an upward-sloping segment. But such a curve is ruled out by
the principle that more is better. On this indifference curve, there are at least
two bundles that have the same amount of good Y, but one has more of good
Solution
4. Restaurant meals and housing (measured by the number of rooms) are the only
two goods that Neha can buy. She has income of $1,000, and the price of each
room is $100. The relative price of 1 room in terms of restaurant meals is 5.
How many restaurant meals can she buy if she spends all her money on them?
4. The relative price of one room in terms of restaurant meals is the number of
restaurant meals that must be forgone to obtain 1 room. Since 5 restaurant
meals must be forgone to obtain 1 room, the price of a restaurant meal has to be
$100/5 = $20. If Neha spends all of her income on restaurant meals, she can buy
$1,000/$20 = 50 restaurant meals.
(1) Inflation increases the prices of all goods by 20%.
(2) Ina’s income increases from $50,000 to $55,000.
a. Has Ina’s budget line become steeper, less steep, or equally as steep?
b. Has Ina’s budget line shifted outward, inward, or not at all?
5. a. Ina’s budget line is equally as steep. The slope of the budget line is minus the
relative price of one good in terms of another. The relative prices of goods have
not changed: all goods just cost 20% more.
6. Kory has an income of $50, which she can spend on two goods: music albums
and cups of hot chocolate. Both are normal goods for her. Each album costs
$10, and each cup of hot chocolate costs $2. For each of the following situations,
decide whether this is Kory’s optimal consumption bundle. If not, what should
Kory do to achieve her optimal consumption bundle?
a. Kory is considering buying 4 albums and 5 cups of hot chocolate. At that
bundle, her marginal rate of substitution of albums in place of hot chocolate
is 1; that is, she would be willing to forgo only 1 cup of hot chocolate to
acquire 1 album.
6. The relative price of albums in terms of cups of hot chocolate is Palbum/Phot chocolate =
$10/$2 = 5. That is, to get 1 more album, Kory has to give up 5 cups of hot chocolate.
a. This bundle lies on Kory’s budget line: it is a bundle at which she spends all
her income. Kory’s marginal rate of substitution is less than the relative price
of albums. She is willing to exchange only 1 cup of hot chocolate for 1 album.
b. This bundle lies on Kory’s budget line: it is a bundle at which she spends all her
income. Kory’s marginal rate of substitution is MUalbum/MUhot chocolate = 25/5 = 5.
That is, she is willing to exchange 5 cups of hot chocolate for 1 album. Because
the relative price of 1 album is 5 cups of hot chocolate, Kory values albums
equally as much as they cost her. So this is her optimal consumption bundle.
Solution
Solution
Solution
S-164 10 APPENDIX CONSUMER PREFERENCES AND CONSUMER CHOICE
c. At this bundle, the marginal rate of substitution is equal to the relative price,
7. Raul has 4 Cal Ripken and 2 Nolan Ryan baseball cards. The prices of these
baseball cards are $24 for Cal and $12 for Nolan. Raul, however, would be will-
ing to exchange 1 Cal card for 1 Nolan card.
a. What is Raul’s marginal rate of substitution of Cal Ripken in place of Nolan
Ryan baseball cards?
b. Can Raul buy and sell baseball cards to make himself better off? How?
7. a. Raul’s marginal rate of substitution is 1: he is willing to trade only 1 Nolan
Ryan for 1 more Cal Ripken card.
b. Raul’s marginal rate of substitution is MUCal/MUNolan = 1. However, the relative
price of a Cal Ripken card is PCal/PNolan = $24/$12 = 2. Since the marginal rate
of substitution is less than the relative price, Raul can make himself better off
8. Ralph and Lauren are talking about how much they like going to the gym and
how much they like eating out at their favorite restaurant and they regularly do
some of each. A session at the gym costs the same as a meal at the restaurant.
Ralph says that, for his current consumption of gym sessions and restaurant
meals, he values 1 more meal twice as much as he values 1 more session at the
gym. Lauren is studying economics, and she tells him that his current consump–
tion bundle cannot be optimal.
a. Is Lauren right? Why or why not? Draw a diagram of Ralph’s budget line
and the indifference curve that he is on by making his current consumption
choice. Place restaurant meals on the horizontal axis and gym sessions on the
vertical axis.
Solution
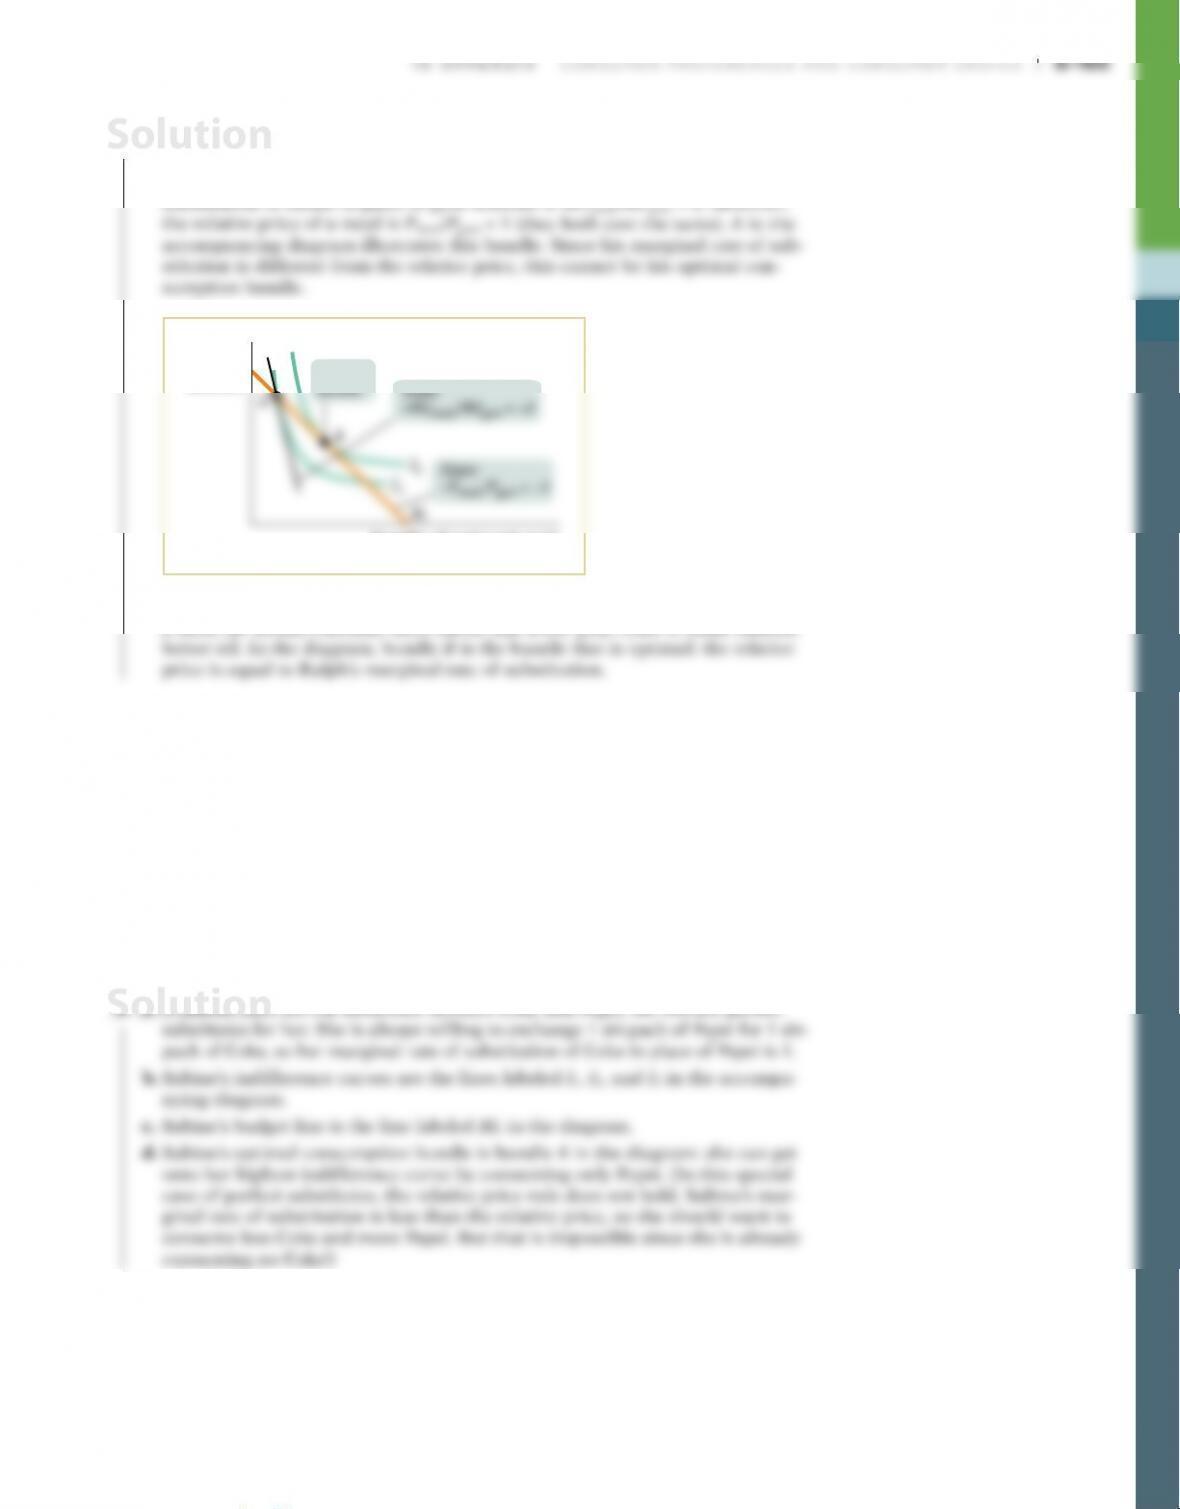
8. a. Lauren is right. Since Ralph values one more meal twice as much as he val–
ues one more session at the gym, his marginal utility for meals is twice as
much as his marginal utility for gym sessions. That is, his marginal rate of
substitution of meals in place of gym sessions is MUmeal/MUgym = 2. However,
Quantity
of gym
sessions
Quantity of restaurant meals
I1
I2
BL
B
Optimal
Slope:
–Pmeal/Pgym = –1
b. Since Ralph’s marginal rate of substitution is greater than the relative price of
a meal, he should consume more meals and fewer gym visits to make himself
9. Sabine can’t tell the difference between Coke and Pepsi—the two taste exactly
the same to her.
a. What is Sabine’s marginal rate of substitution of Coke in place of Pepsi?
b. Draw a few of Sabine’s indifference curves for Coke and Pepsi. Place Coke on
the horizontal axis and Pepsi on the vertical axis.
c. Sabine has $6 to spend on cola this week. Coke costs $1.50 per bottle and Pepsi
costs $1.00. Draw Sabine’s budget line for Coke and Pepsi on the same diagram.
d. What is Sabine’s optimal consumption bundle? Show this on your diagram.
e. If the price of Coke and Pepsi is the same, what combination of Coke and
Pepsi will Sabine buy?
Solution
S-166 10 APPENDIX CONSUMER PREFERENCES AND CONSUMER CHOICE
e. If the price of Pepsi and Coke is the same, then the budget line has the same
slope as Sabine’s indifference curves. That is, at any bundle on the budget line,
the relative price rule is true! In that case, we cannot predict what Sabine will
do: any bundle on her budget line would be an optimal choice.
6
Quantity
of Pepsi
Quantity of Coke
I1I2
BL I3
A
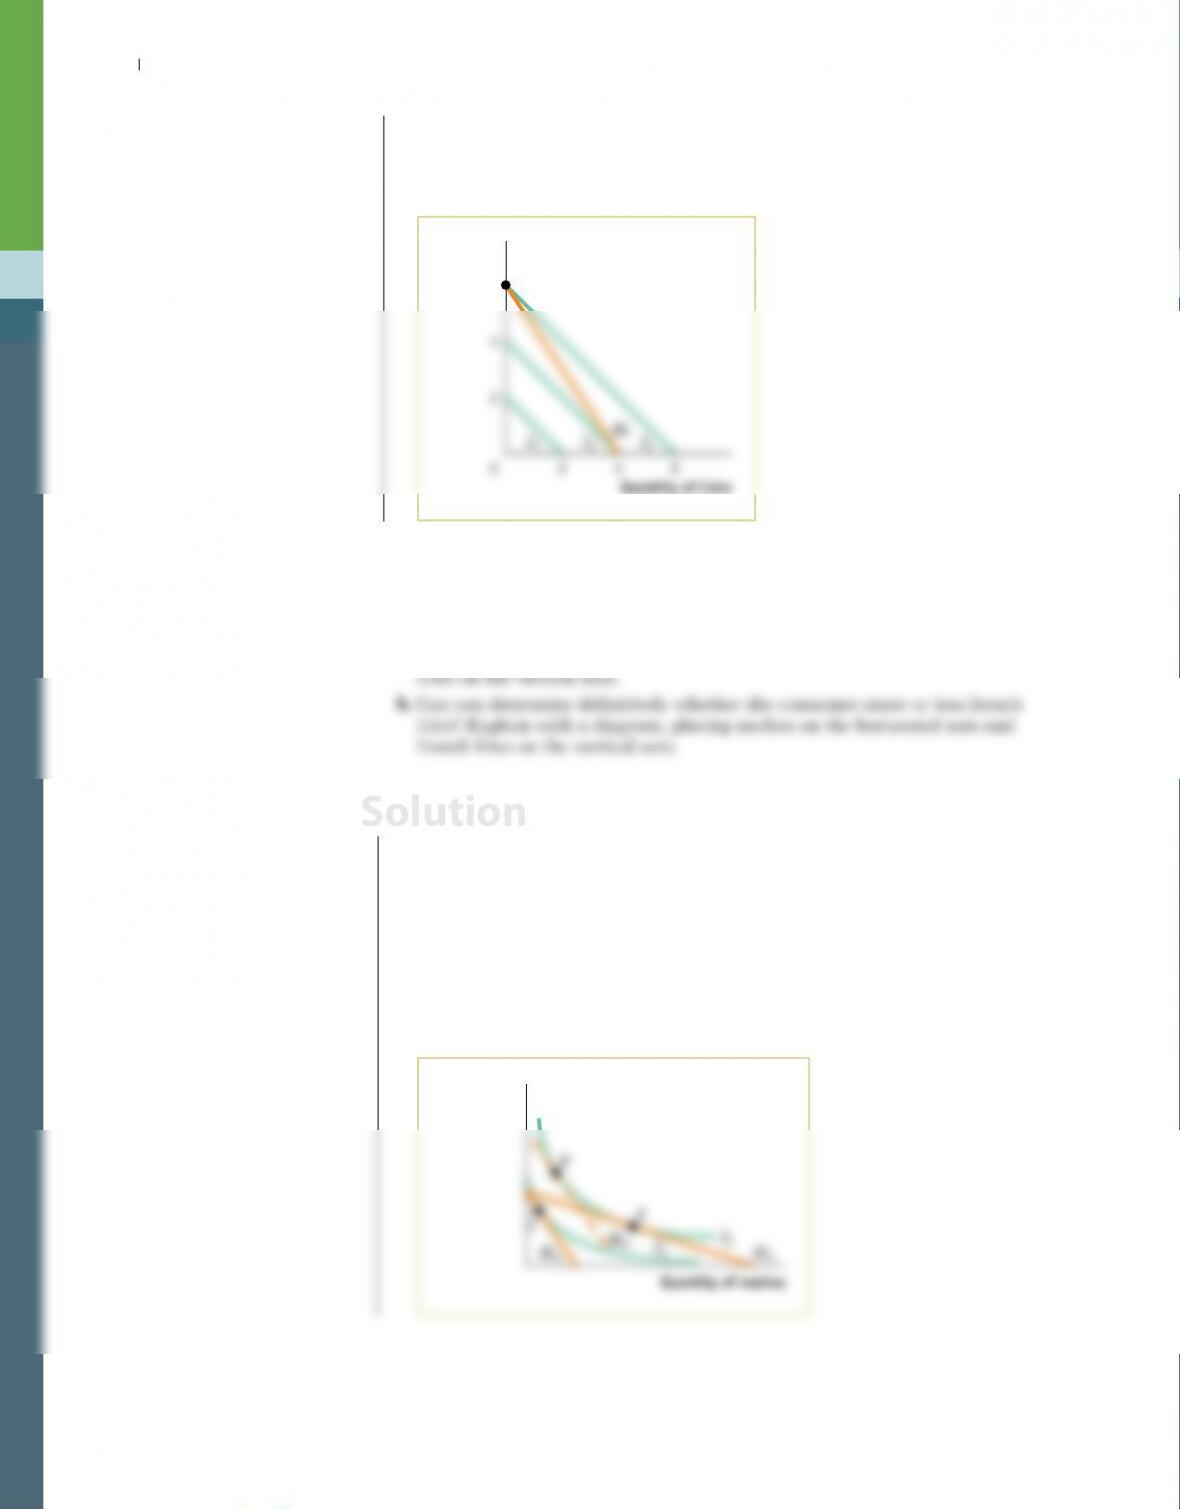
10. For Norma, both nachos and french fries are normal goods. They are also ordinary
goods for Norma. The price of nachos rises, but the price of french fries remains
unchanged.
a. Can you determine definitively whether she consumes more or fewer nachos?
Explain with a diagram, placing nachos on the horizontal axis and french
10. a. In the accompanying diagram, BL1 is Norma’s original budget line and A is her
optimal consumption bundle. After the increase in the price of nachos, BL2
is her new budget line and C is her new consumption bundle. The movement
from A to B isolates the pure substitution effect of the rise in the relative price
of nachos: at B she consumes fewer nachos and more french fries. The move–
ment from B to C isolates the income effect: she has been made poorer by the
rise in the price of nachos, so she consumes fewer nachos at C than at B. Since
nachos are a normal good, and the income and substitution effect run in the
same direction when the price changes for a normal good, we can say defini-
tively that her consumption of nachos falls in response to the increase in the
price of nachos.
I1
I2
BL2
BLSBL1
Quantity of
fr
ench fries
Quantity of nachos
A
B
C
Solution
10 APPENDIX CONSUMER PREFERENCES AND CONSUMER CHOICE S-167
b. We cannot say definitively whether Norma’s consumption of salsa rises or
falls. In the diagram from part a, Norma’s consumption of salsa rises in
response to the increase in the price of nachos: she consumes more salsa at
bundle C than she did at bundle A. Depending on her preferences, however,
it is possible that her consumption of salsa falls as well. This will occur if
I1
BL2BL1
Quantity
of salsa
Quantity of nachos
11. Gus spends his income on gas for his car and food. The government raises the
tax on gas, thereby raising the price of gas. But the government also lowers the
income tax, thereby increasing Gus’s income. And this rise in income is just
enough to place Gus on the same indifference curve as the one he was on before
the price of gas rose. Will Gus buy more, less, or the same amount of gas as
before these changes? Illustrate your answer with a diagram, placing gas on the
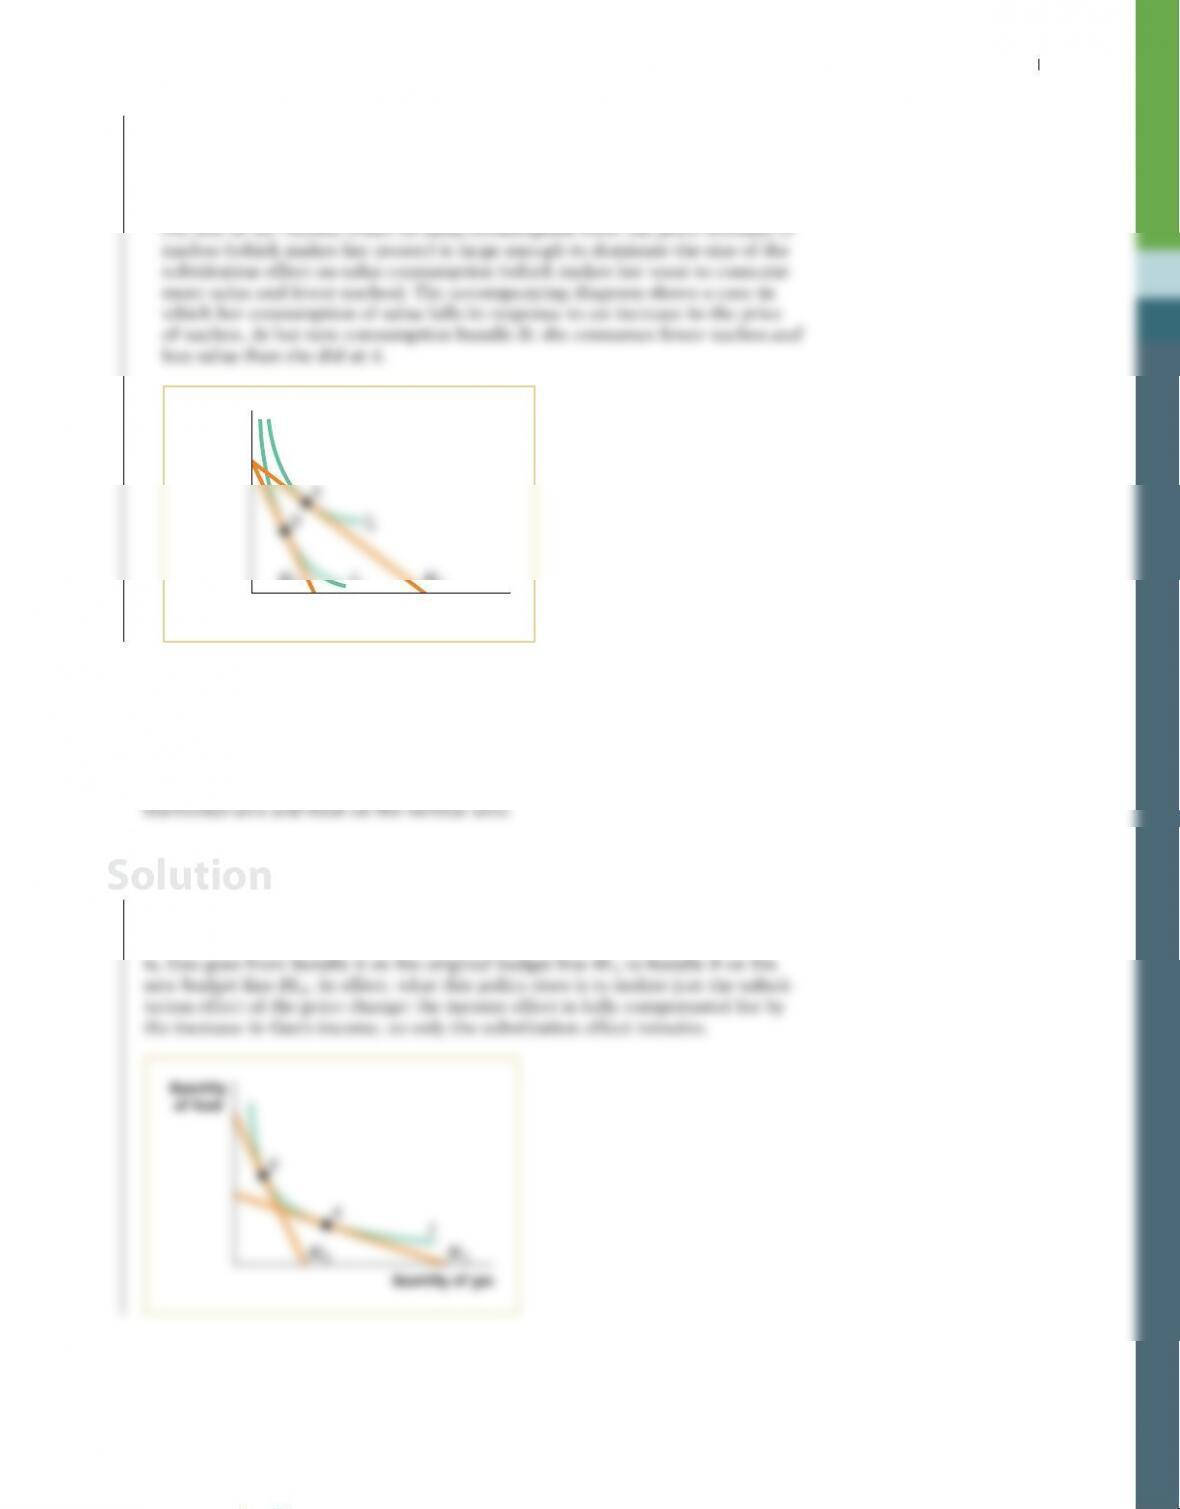
11. Gus will buy less gas. As shown in the accompanying diagram, the increase in
the price of gas makes his budget line steeper (the relative price of gas is now
higher). The increase in income shifts his budget line outward so that it is just
tangent to the indifference curve that he was on before the gas price rose. That
I
BL1
BL2
Quantity of gas
A
Solution
12. Pam spends her money on bread and Spam, and her indifference curves obey
the four properties of indifference curves for ordinary goods. Suppose that, for
Pam, Spam is an inferior, but not a Giffen, good; bread is a normal good. Bread
costs $2 per loaf, and Spam costs $2 per can. Pam has $20 to spend.
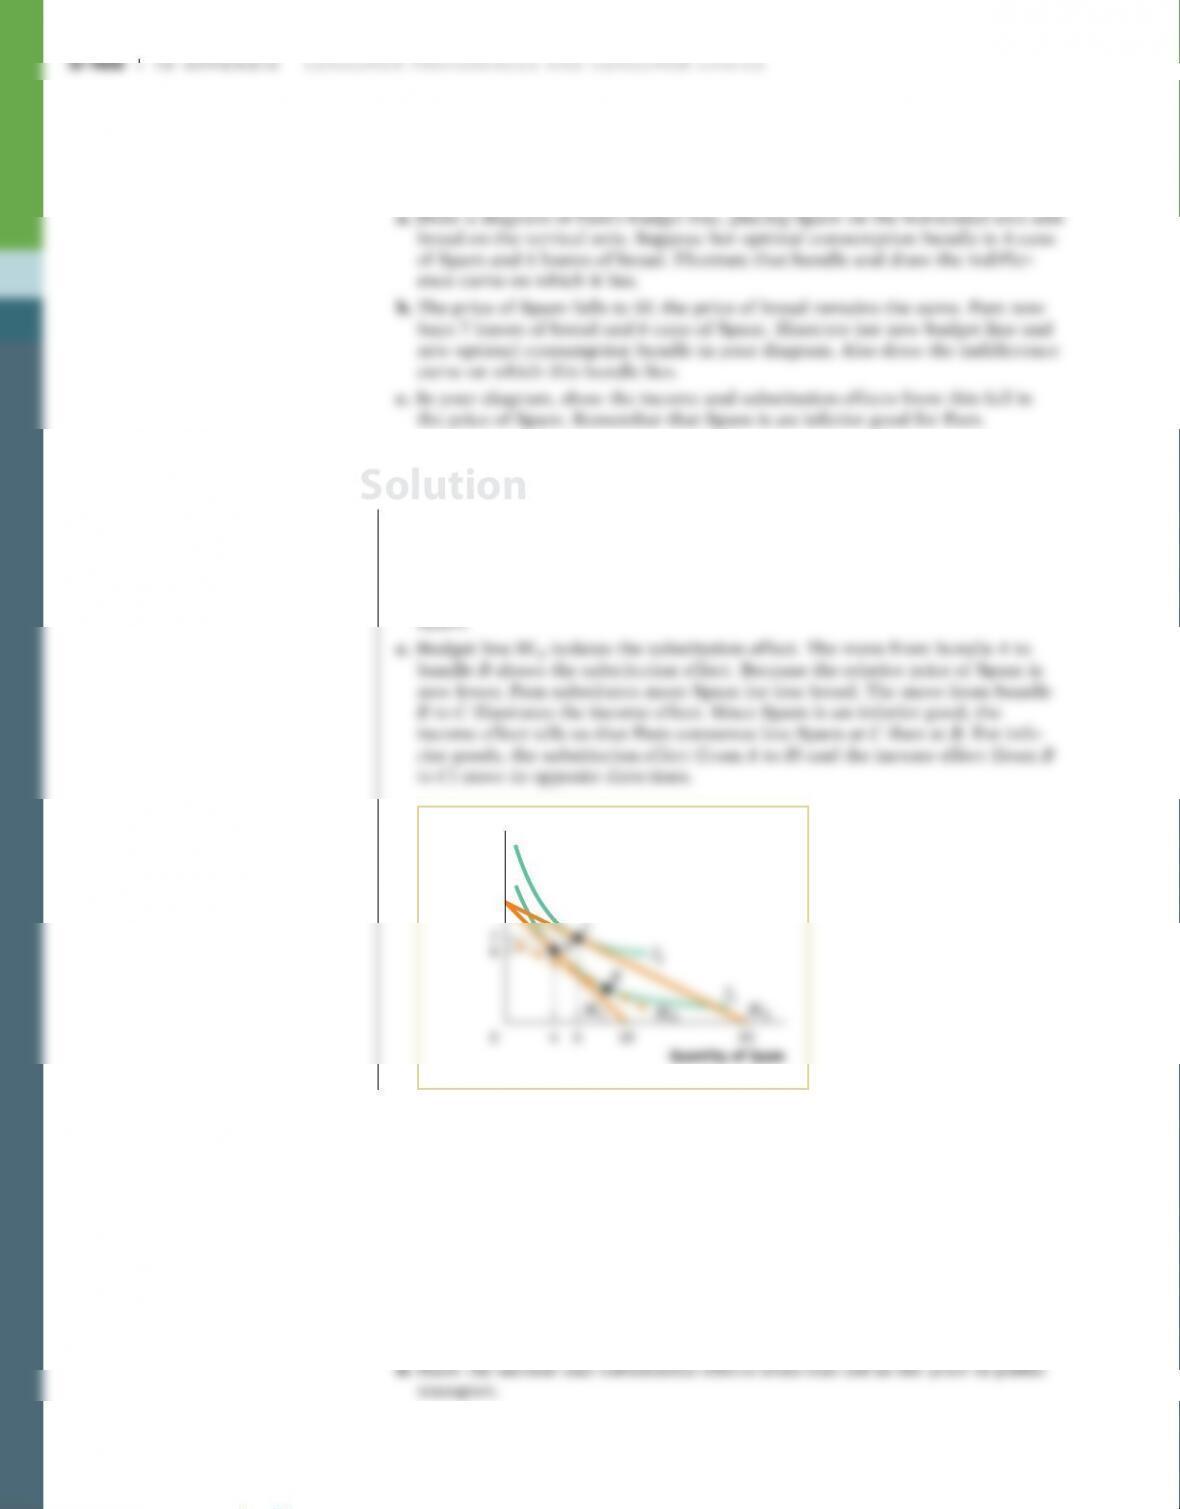
12. a. BL1 in the accompanying diagram is Pam’s budget line. Bundle A, her optimal
choice, lies on indifference curve I1, which slopes downward, has the charac–
teristic convex shape, and does not cross any other indifference curves.
b. Budget line BL2 in the accompanying diagram represents Pam’s budget line
when the price of Spam falls to $1 per can. Point C, which lies on indiffer-
ence curve I2, represents her optimal choice of 7 loaves of bread and 6 cans of
Spam.
Quantity of Spam
13. Katya commutes to work. She can either use public transport or her own car.
Her indifference curves obey the four properties of indifference curves for ordi–
nary goods.
a. Draw Katya’s budget line with car travel on the vertical axis and public transport
on the horizontal axis. Suppose that Katya consumes some of both goods. Draw
an indifference curve that helps you illustrate her optimal consumption bundle.
b. Now the price of public transport falls. Draw Katya’s new budget line.
c. For Katya, public transport is an inferior, but not a Giffen, good. Draw an indif–
ference curve that illustrates her optimal consumption bundle after the price of
public transport has fallen. Is Katya consuming more or less public transport?
Solution
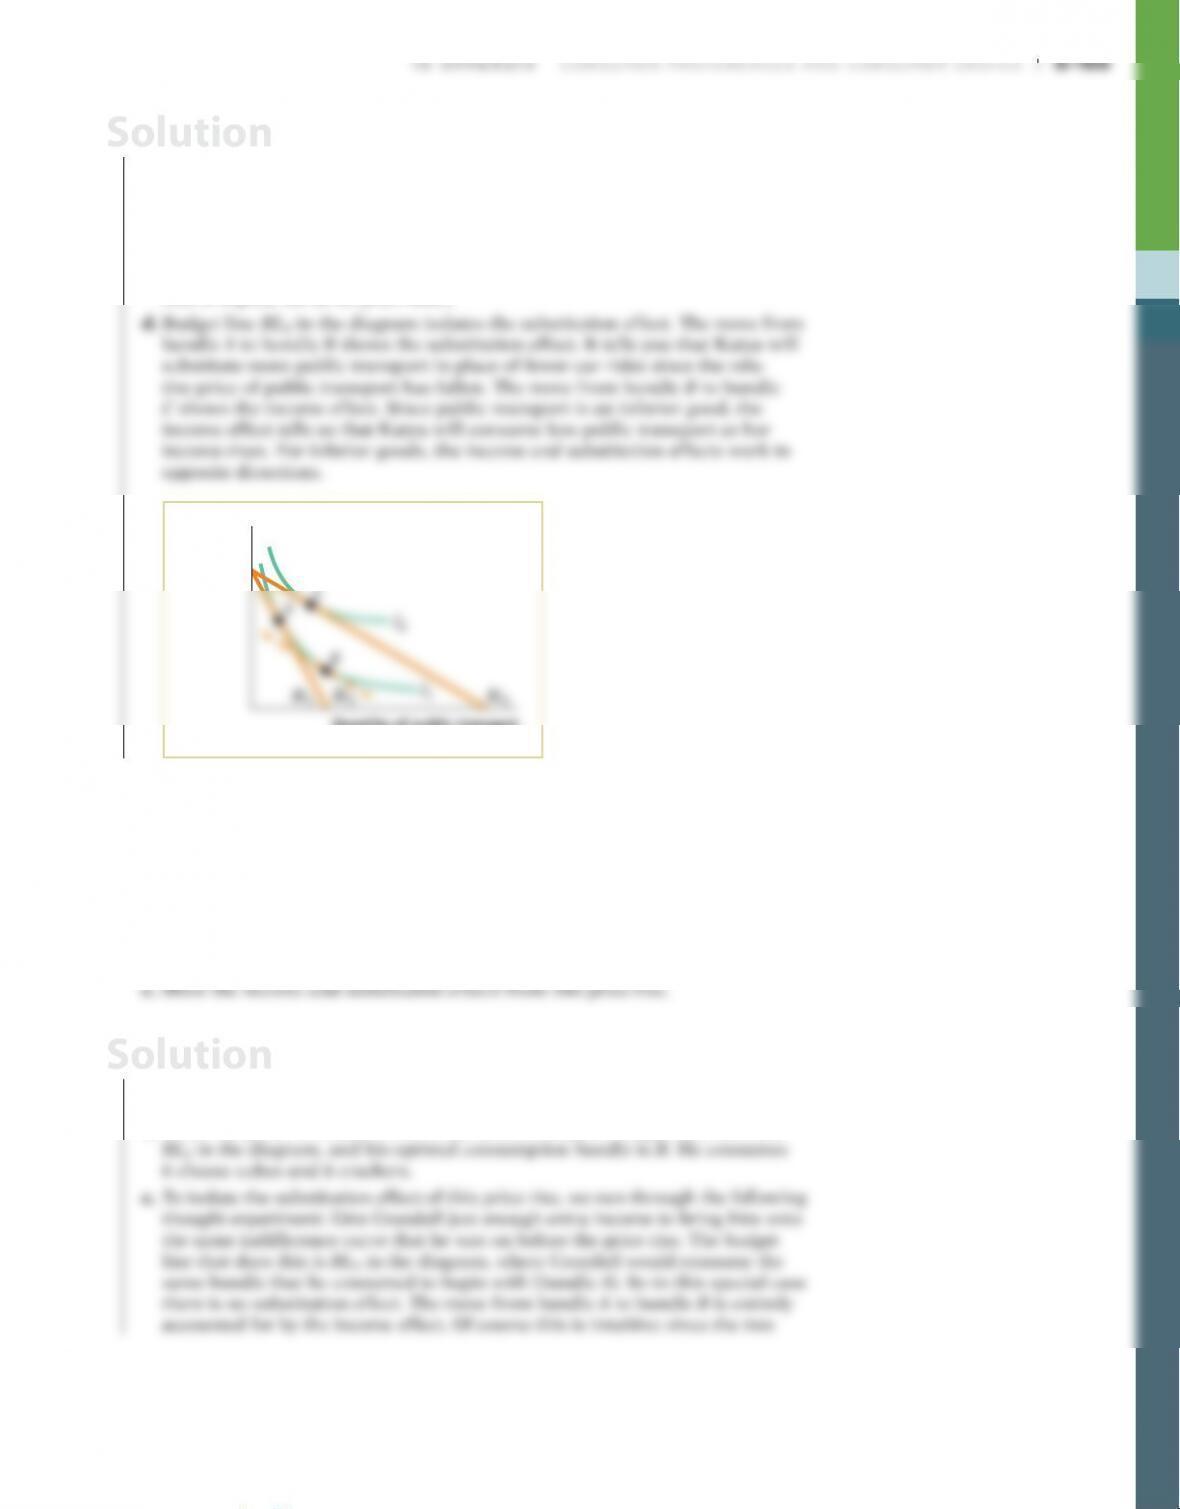
13. a. BL1 in the accompanying diagram shows Katya’s budget line, and the optimal
consumption bundle is labeled A.
b. Katya’s budget line after the price of public transport has fallen is labeled BL2
in the diagram.
c. Katya’s optimal consumption bundle is C. Since public transport is not a
Giffen good, we know that as a result of the price fall, Katya’s consumption of
public transport will increase. (Only if it were a Giffen good would consump–
tion of a good fall as its price falls.)
I1
BL1BLSBL2
Quantity of public transport
14. For Crandall, cheese cubes and crackers are perfect complements: he wants
to consume exactly 1 cheese cube with each cracker. He has $2.40 to spend on
cheese and crackers. One cheese cube costs 20 cents, and 1 cracker costs
10 cents. Draw a diagram, with crackers on the horizontal axis and cheese cubes
on the vertical axis, to answer the following questions.
a. Which bundle will Crandall consume?
b. The price of crackers rises to 20 cents. How many cheese cubes and how many
crackers will Crandall consume?
14. a. Bundle A in the accompanying diagram is Crandall’s optimal consumption
bundle. When cheese cubes cost 20 cents and crackers cost 10 cents, his bud-
get line is BL1. He consumes 8 cheese cubes and 8 crackers.
b. When the price of crackers rises to 20 cents, Crandall’s budget line becomes
Solution
Solution
S-170 10 APPENDIX CONSUMER PREFERENCES AND CONSUMER CHOICE
goods are perfect complements, they are not substitutable—and so it makes
sense that there is no substitution effect.
16
14
12
Quantity of
cheese cubes
Quantity of crackers
15. Carmen consumes nothing but cafeteria meals and music albums. Her indiffer-
ence curves exhibit the four general properties of indifference curves. Cafeteria
meals cost $5 each, and albums cost $10. Carmen has $50 to spend.
a. Draw Carmen’s budget line and an indifference curve that illustrates her opti-
mal consumption bundle. Place cafeteria meals on the horizontal axis and
albums on the vertical axis. You do not have enough information to know the
specific tangency point, so choose one arbitrarily.
b. Now Carmen’s income rises to $100. Draw her new budget line on the same
diagram, as well as an indifference curve that illustrates her optimal con-
sumption bundle. Assume that cafeteria meals are an inferior good.
c. Can you draw an indifference curve showing that cafeteria meals and albums
are both inferior goods?
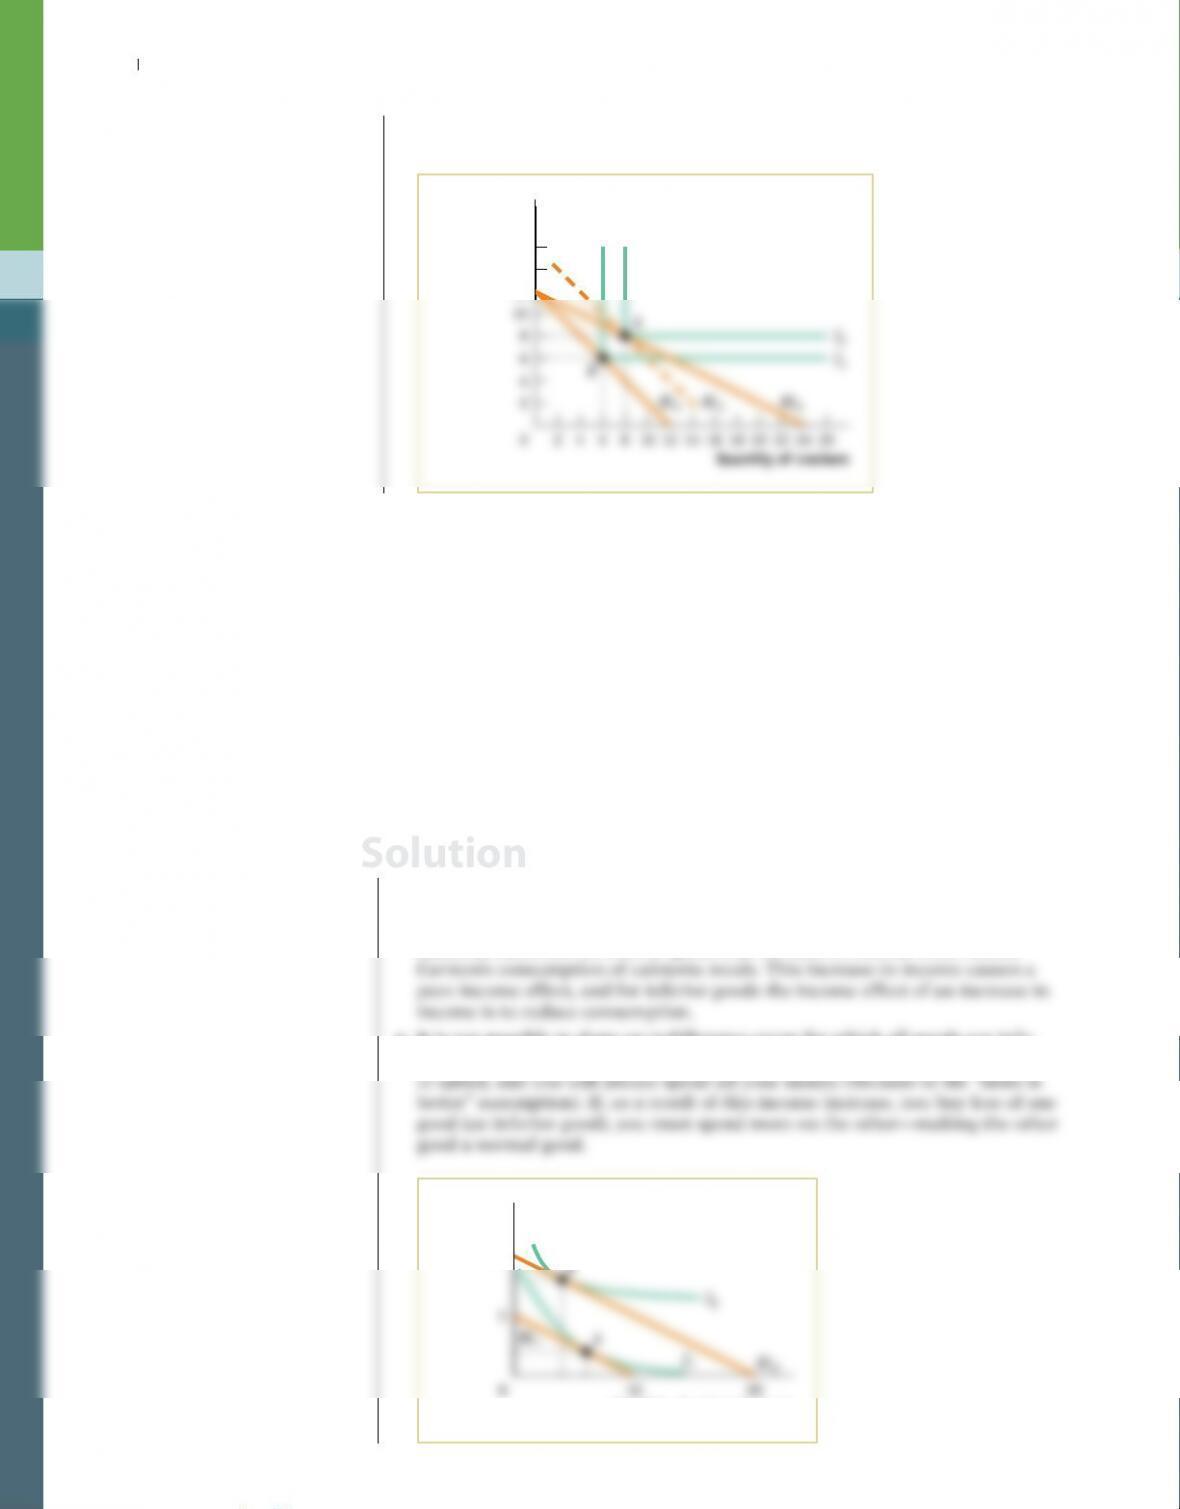
15. a. Carmen’s budget line when she has $50 to spend is BL1 in the accompanying
diagram. Her optimal consumption bundle is A, lying on indifference curve I1.
b. Carmen’s budget line when she has $100 to spend is BL2 in the diagram. Her
optimal consumption bundle is bundle B, lying on indifference curve I2. Since
cafeteria meals are an inferior good, this increase in income must reduce
c. It is not possible to draw an indifference curve for which all goods are infe–
rior goods. This is because as your income increases, you have more money
Quantity of cafeteria meals
Solution
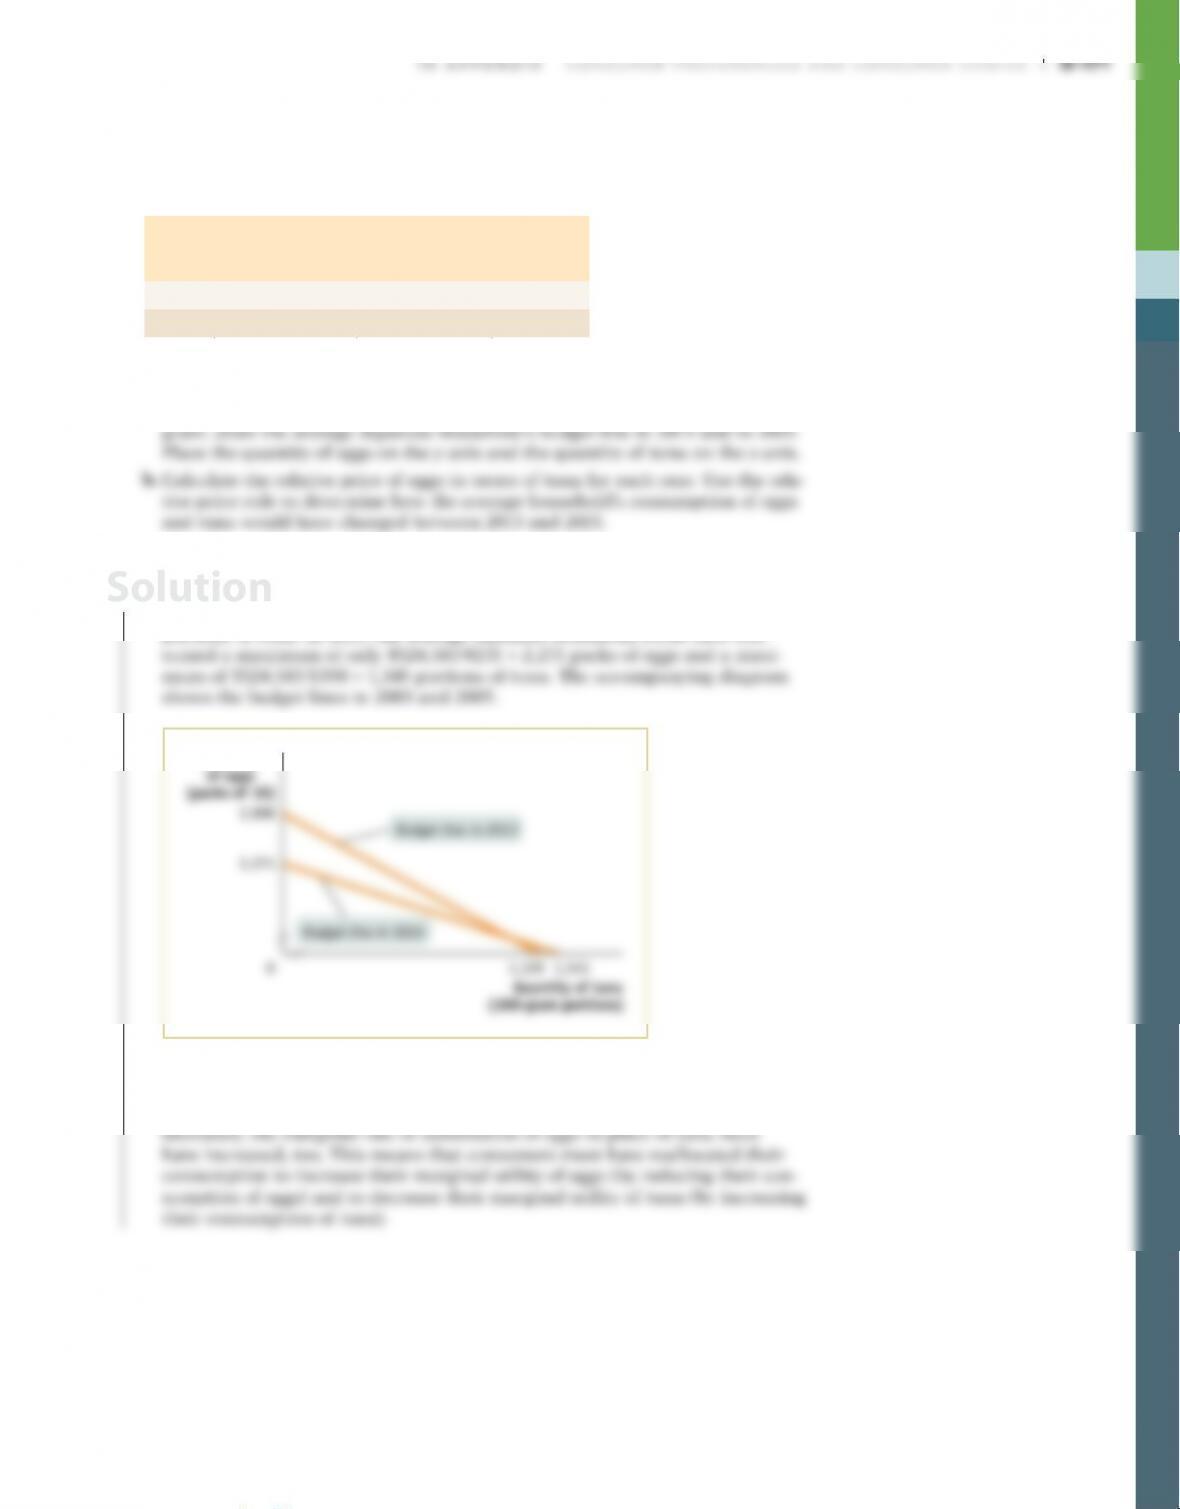
16. The Japanese Ministry of Internal Affairs and Communications collects data on
the prices of goods and services in the Ku-area of Tokyo, as well as data on the
average Japanese household’s monthly income. The accompanying table shows
some of this data. (¥ denotes the Japanese currency the yen.)
Year
Price of eggs
(per pack of 10)
Price of tuna
(per 100–gram
portion)
Average
monthly
income
2013 ¥187 ¥392 ¥524,810
2015 231 390 524,585
a. For each of the two years for which you have data, what is the maximum num-
ber of packs of eggs that an average Japanese household could have consumed
each month? The maximum number of 100-gram portions of tuna? In one dia-
16. a. In 2013, the average Japanese household could have consumed a maximum of
¥524,810/¥187 = 2,806 packs of eggs or a maximum of ¥524,810/¥392 = 1,339
portions of tuna. In 2015, the average Japanese household could have con-
Quantity of
tuna
(100-gram portions)
b. In 2013, the relative price of eggs in terms of tuna was ¥187/¥392 = 0.48. In
2015, the relative price of eggs in terms of tuna was ¥231/¥390 = 0.59. In order
for the relative price rule to hold, as the relative price of eggs in terms of tuna
Solution
S-172 10 APPENDIX CONSUMER PREFERENCES AND CONSUMER CHOICE
WORK IT OUT Interactive step-by-step help with solving this
problem can be found online.
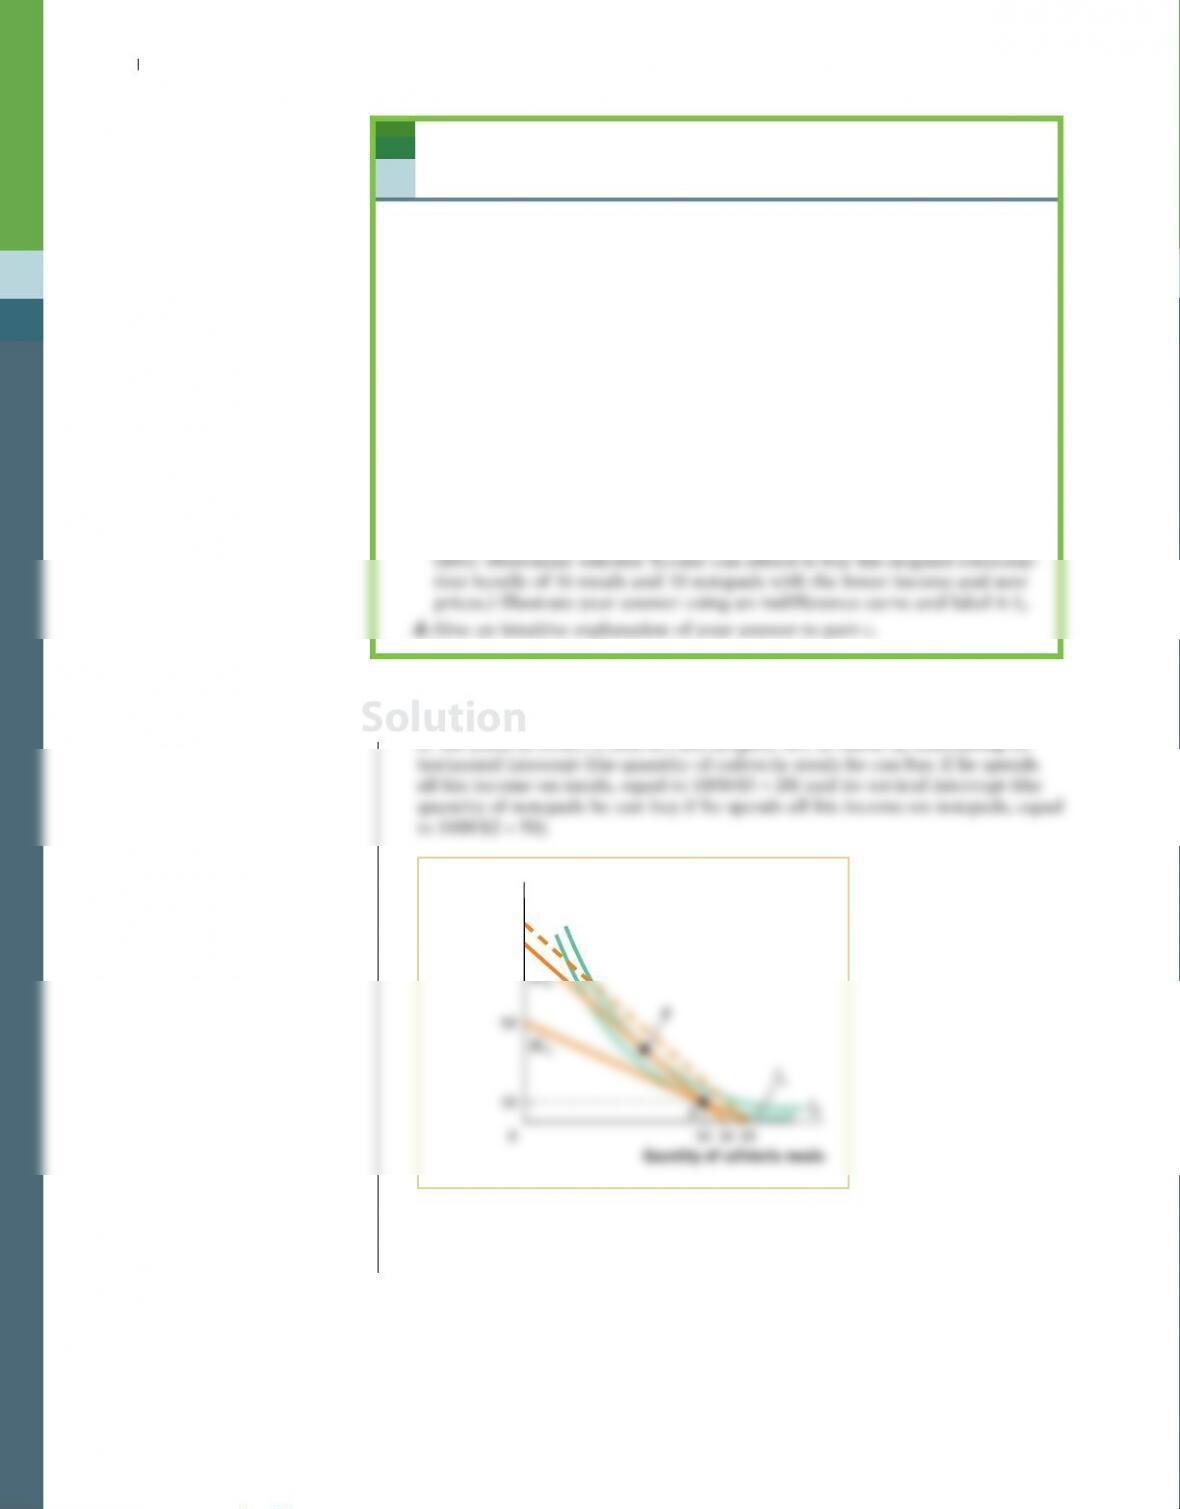
17. Tyrone is a utility maximizer. His income is $100, which he can spend on
cafeteria meals and on notepads. Each meal costs $5, and each notepad
costs $2. At these prices Tyrone chooses to buy 16 cafeteria meals and
10 notepads.
a. Draw a diagram that shows Tyrone’s choice using an indifference curve
and his budget line, placing notepads on the vertical axis and cafeteria
meals on the horizontal axis. Label the indifference curve I1 and the bud-
get line BL1.
b. The price of notepads falls to $1; the price of cafeteria meals remains
the same. On the same diagram, draw Tyrone’s budget line with the new
prices and label it BLH.
c. Lastly, Tyrone’s income falls to $90. On the same diagram, draw his
budget line with this income and the new prices and label it BL2. Is he
worse off, better off, or equally as well off with these new prices and
lower income than compared to the original prices and higher income?
17. a. Tyrone’s initial optimal bundle of 16 meals and 10 notepads is given by point
A, the point at which I1 and BL1 are tangent. BL1 is found by calculating its
B
BL1
Quantity of cafeteria meals
50
b. Given that the price of notepads falls to $1 and the price of meals stays
unchanged at $5, Tyrone’s budget line, BLH, is given by its vertical intercept
($100/$1 = 100) and its horizontal intercept ($100/$5 = 20).
Solution
10 APPENDIX CONSUMER PREFERENCES AND CONSUMER CHOICE S-173
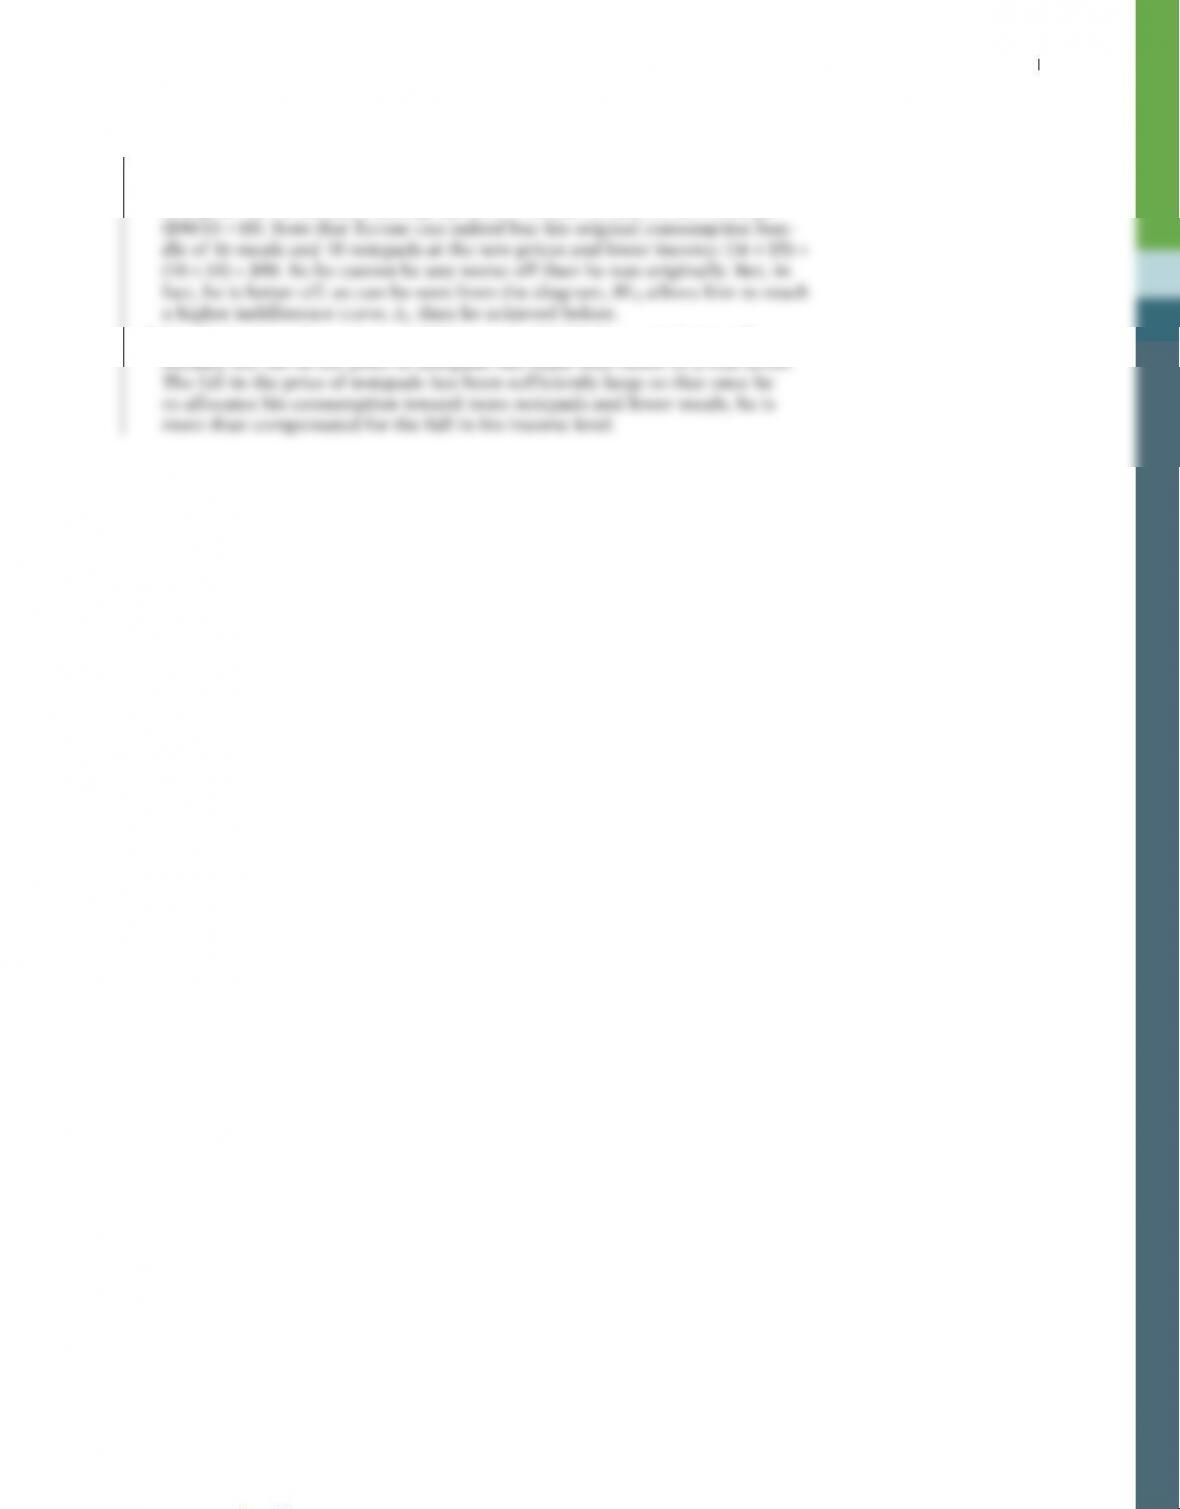
c. Given that the price of notepads drops to $1, the price of meals stays
unchanged at $5, and his income drops to $90, Tyrone’s budget line is BL2.
It is given by its vertical intercept ($90/$1 = 90) and its horizontal intercept
d. Despite having a lower income ($90 instead of $100), Tyrone is better off
because the fall in the price of notepads has made him richer in a real sense.