
CHAPTER 10
AGGREGATE SUPPLY
In this chapter, you will find:
Learning Outcomes
Chapter Outline with PowerPoint Script
Chapter Summary
Teaching Points (as on Prep Card)
Solutions to Problems Appendix
Experiential Assignment
INTRODUCTION
In Chapter 9 we determined the quantity of aggregate output that would be demanded at a particular price
level. In this chapter, the price level is not known ahead of time, but resource suppliers and firms have
LEARNING OUTCOMES
10-1 Explain what determines the shape and position of the short-run aggregate supply curve.
Short-run aggregate supply is based on resource demand and supply decisions that reflect the ex-
10-2 Describe the market forces that push the economy toward its potential output in the long run.
Output can exceed the economy’s potential in the short run, but in the long run, higher nominal wages
10-3 Explain why shifts of the aggregate demand curve change the price level in the long run but do
not change potential output.
If output in the short run is less than the economy’s potential and if wages and prices are flexible
10-4 Summarize what can shift an economy’s potential output in the long run.
The long-run aggregate supply curve, or the economy’s potential output, depends on the amount and
CHAPTER OUTLINE WITH POWERPOINT SCRIPT
USE POWERPOINT SLIDE 2 FOR THE FOLLOWING SECTION
Aggregate Supply in the Short Run: The relationship between the economy’s price level and the
amount of output firms are willing and able to supply, other things constant. Factors held constant are
resource prices, state of technology, and the institutional structure of the economy.
USE POWERPOINT SLIDES 3-4 FOR THE FOLLOWING SECTION
Labor and Aggregate Supply:
• Labor Supply: Depends on the real wage rate
USE POWERPOINT SLIDES 5-6 FOR THE FOLLOWING SECTION
Potential Output and the Natural Rate of Unemployment:
• When the actual price level of both workers and firms turns out as expected the economy produces its
potential output.
• Potential Output:
USE POWERPOINT SLIDE 7 FOR THE FOLLOWING SECTION
Actual Price Level Is Higher Than Expected
Why Costs Rise When Output Exceeds Potential
• Because the prices of some resources are fixed by contracts, the price level rises faster than the per–
USE POWERPOINT SLIDE 8 FOR THE FOLLOWING SECTION
Chapter 11 Aggregate Supply 147
Actual Price Level Is Lower Than Expected: Since production is less profitable when prices are lower
than expected, firms reduce their quantity supplied, so the economy’s output is below its potential.
USE POWERPOINT SLIDES 9-10 FOR THE FOLLOWING SECTION
The Short-Run Aggregate Supply Curve (SRAS): Shows the relationship between the actual price level
USE POWERPOINT SLIDES 11-16 FOR THE FOLLOWING SECTION
From the Short Run to the Long Run
• Long run: A period long enough to renegotiate all agreements based on knowledge of the actual price
level. There are no surprises about the price level in the long run.
Closing an Expansionary Gap
The actual price level is higher than expected: Aggregate demand curve intersects the short-run aggregate
supply curve, and output exceeds the economy’s potential.
• Short-run equilibrium: Occurs where aggregate demand intersects the short-run aggregate supply
curve; aggregate demand is greater than expected
• Expansionary gap: The amount by which short–run output exceeds the economy’s potential.
USE POWERPOINT SLIDES 17-19 FOR THE FOLLOWING SECTION
Closing a Recessionary Gap
The actual price level is lower than expected: Aggregate demand curve intersects the short-run aggregate
supply curve to the left of potential output, and production is less than the economy’s potential.
• Recessionary gap: The amount by which actual output falls short of potential GDP.
USE POWERPOINT SLIDES 20-23 FOR THE FOLLOWING SECTION
Tracing Potential Output:
• Long-run aggregate supply (LRAS) curve: A vertical line drawn at potential GDP.
Chapter 11 Aggregate Supply 148
USE POWERPOINT SLIDE 24 FOR THE FOLLOWING SECTION
Wage Flexibility and Employment
• Since nominal wages fall slowly, if at all, the supply-side adjustments needed to close a recessionary
USE POWERPOINT SLIDES 25-26 FOR THE FOLLOWING SECTION
Shifts of the Aggregate Supply Curve: Occur because of factors other than changes in the expected
price level.
Aggregate Supply Increases: Occur because of:
• A change in the supply of labor because of:
USE POWERPOINT SLIDES 27-28 FOR THE FOLLOWING SECTION
Beneficial supply shocks: Unexpected events that increase aggregate supply, sometimes only temporarily,
such as abundant harvests, discoveries of natural resources, or technological breakthroughs.
• LRAS and SRAS shift right, increasing potential output and decreasing the price level along a given
aggregate demand curve.
USE POWERPOINT SLIDES 29-30 FOR THE FOLLOWING SECTION
Decreases in Aggregate Supply
• Adverse supply shocks: Sudden, unexpected events that reduce aggregate supply, sometimes only
level.
CHAPTER SUMMARY
Short-run aggregate supply is based on resource demand and supply decisions that reflect the expected
price level. If the price level turns out as expected, the economy produces its potential output. If the price
level exceeds expectations, short-run output exceeds the economy’s potential, creating an expansionary
gap. If the price level is below expectations, short-run output falls short of the economy’s potential,
creating a recessionary gap.

Chapter 11 Aggregate Supply 149
Evidence suggests that, when output exceeds the economy’s potential, nominal wages and the price level
increase. But there is less evidence that nominal wages and the price level fall when output is below the
economy’s potential. Wages appear to be “sticky” in the downward direction. What usually closes a
recessionary gap is an increase in aggregate demand.
TEACHING POINTS
1. The short-run aggregate supply curve assumes that technology and some resource prices are held
fixed. Wages are fixed in the short run for a variety of reasons, but they adjust as workers compare
their price expectations with the actual price level. The lack of perfect foresight on the part of the
2. The potential level of output is the real GDP that is produced when there is only frictional, struc-
tural, and seasonal unemployment. Another way to think about the potential output level is
3.The term natural rate of unemployment has the connotation that it is somehow acceptable because it
is “natural.” This term should by no means be taken to imply that such unemployment is costless
or desirable.
4. It is important to discuss the dynamics of supply shocks on output and price level movements in
the economy. These dynamics include beneficial and adverse shocks to both short-run and potential
Chapter 11 Aggregate Supply 150
SOLUTIONS TO PROBLEMS APPENDIX
1. (Natural Rate of Unemployment) What is the relationship between potential output and the
natural rate of unemployment?
a. If the economy currently has a frictional unemployment rate of 2 percent, structural
unemployment of 2 percent, seasonal unemployment of 0.5 percent, and cyclical
unemployment of 2 percent, what is the natural rate of unemployment? Where is the
economy operating relative to its potential GDP?
b. What happens to the natural rate of unemployment and potential GDP if cyclical
unemployment rises to 3 percent with other types of unemployment unchanged from part
(a)?
c. What happens to the natural rate of unemployment and potential GDP if structural
unemployment falls to 1.5 percent with other types of unemployment unchanged from part
(a)?
a. Given the levels of the different types of unemployment, the natural rate of unemployment
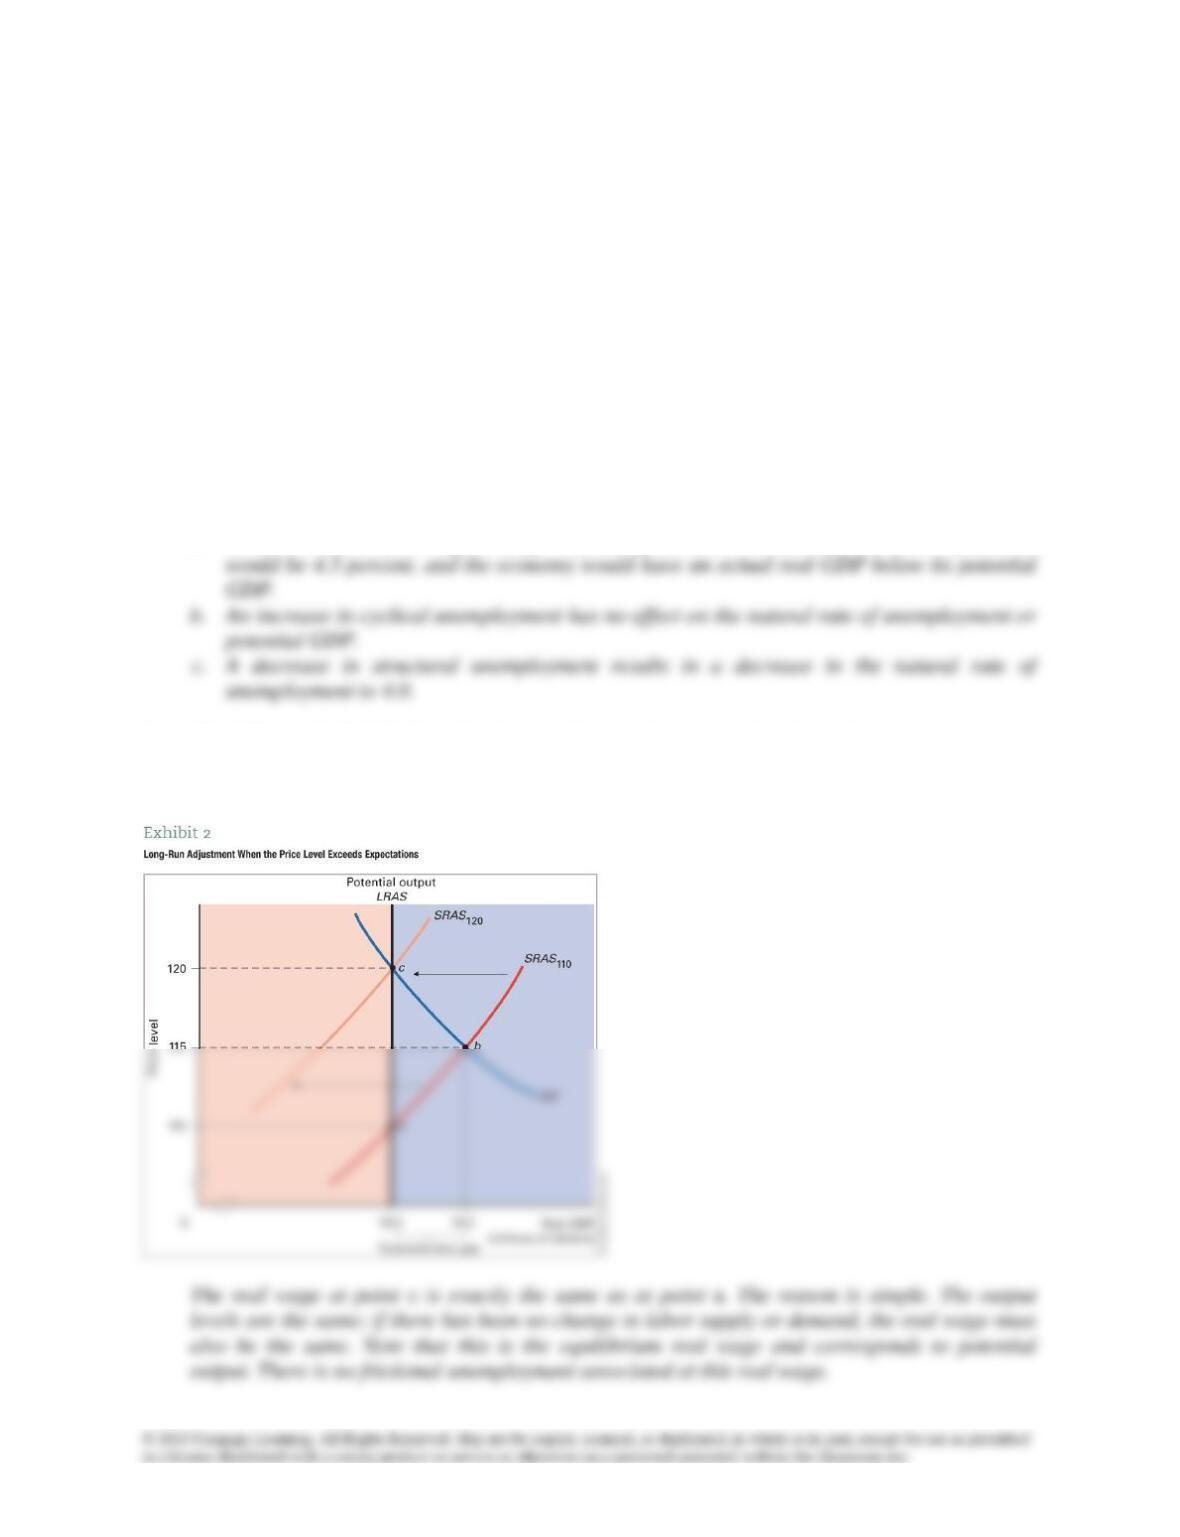
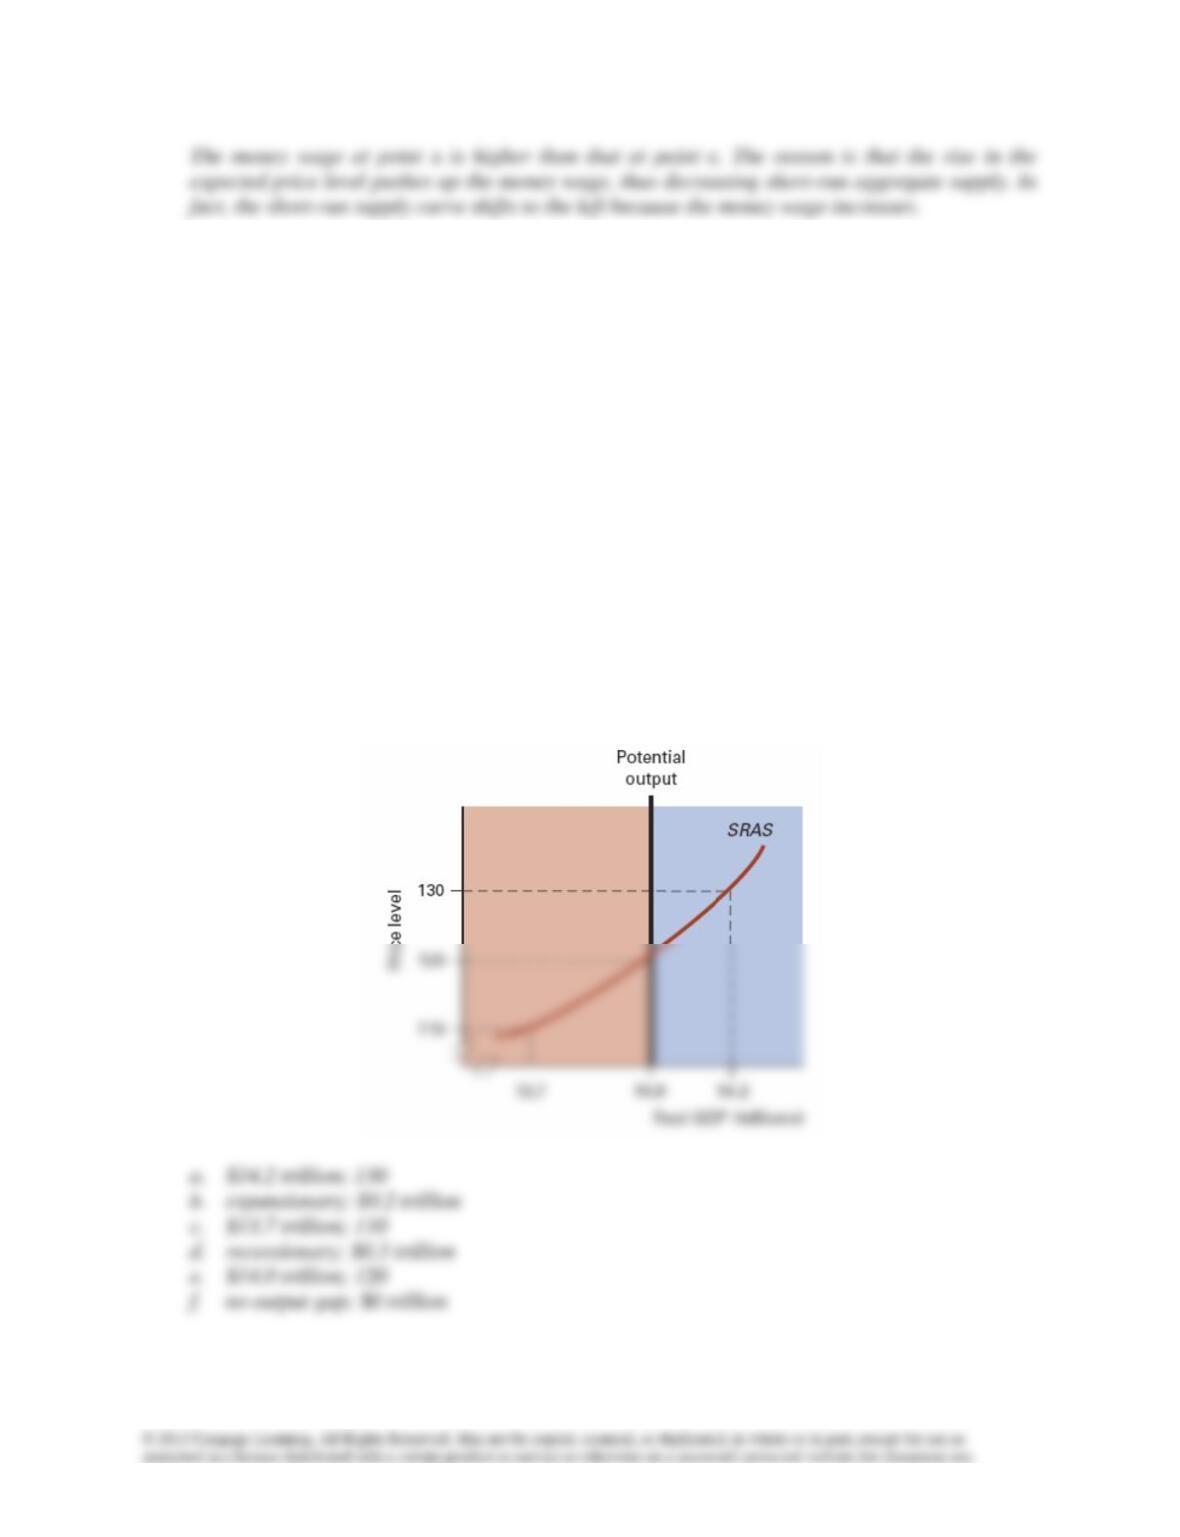
2. (Real Wages) In Exhibit 2 in this chapter (shown below), how does the real wage rate at point c
compare with the real wage rate at point a? How do nominal wage rates compare at those two
points? Explain your answers.
Chapter 11 Aggregate Supply 151
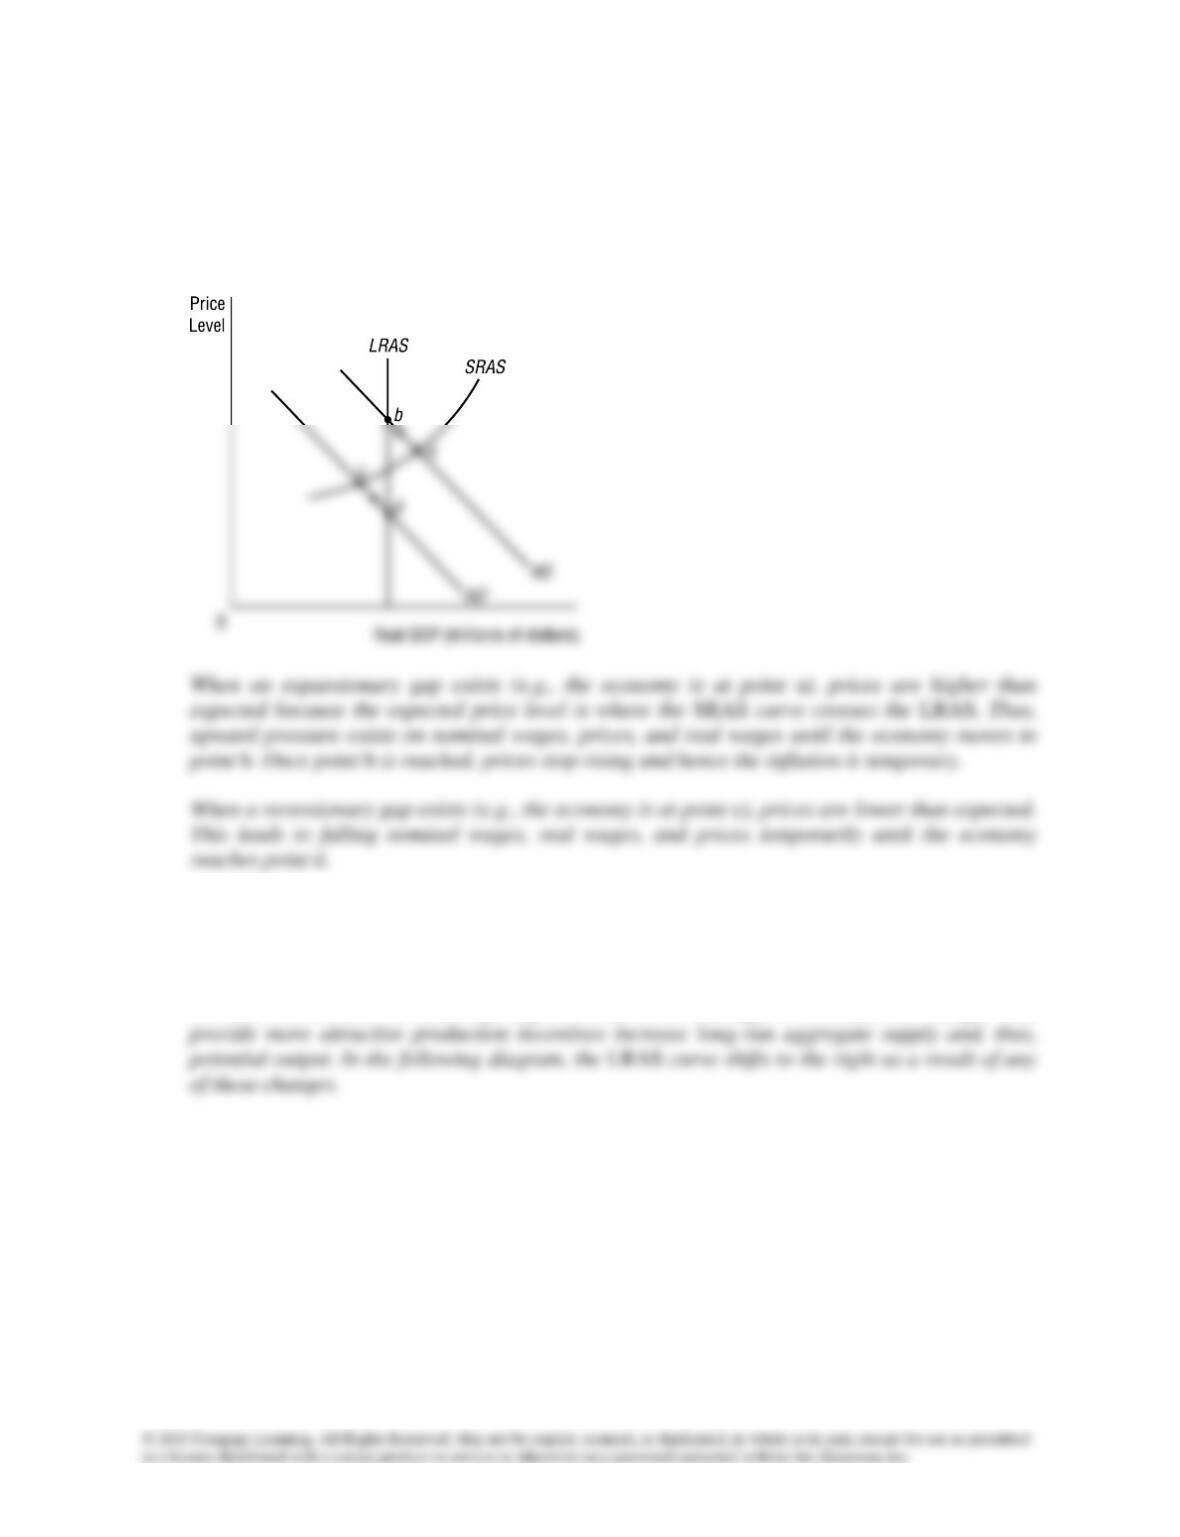
3. (Expansionary and Recessionary Gaps) Answer the questions a through f on the basis of the
following graph:
a. If the actual price level exceeds the expected price level reflected in long-term contracts,
real GDP equals ____________ and the actual price level equals _____________ in the
short run.
b. The situation described in part (a) results in a(n) _________________ gap equal to
___________.
c. If the actual price level is lower than the expected price level reflected in long-term
contracts, real GDP equals _____________ and the actual price level equals
_____________ in the short run.
d. The situation described in part (c) results in a(n) _________________ gap equal to
___________.
e. If the actual price level equals the expected price level reflected in long-term contracts, real
GDP equals ____________ and the actual price level equals _______________ in the short
run.
f. The situation described in part (e) results in _________________ gap equal to
___________.
Chapter 11 Aggregate Supply 152
4. (Long-Run Adjustment) The ability of the economy to eliminate any imbalance between actual
and potential output is sometimes called self-correction. Using an aggregate supply and
aggregate demand diagram, show why this self-correction process involves only temporary
periods of inflation or deflation.
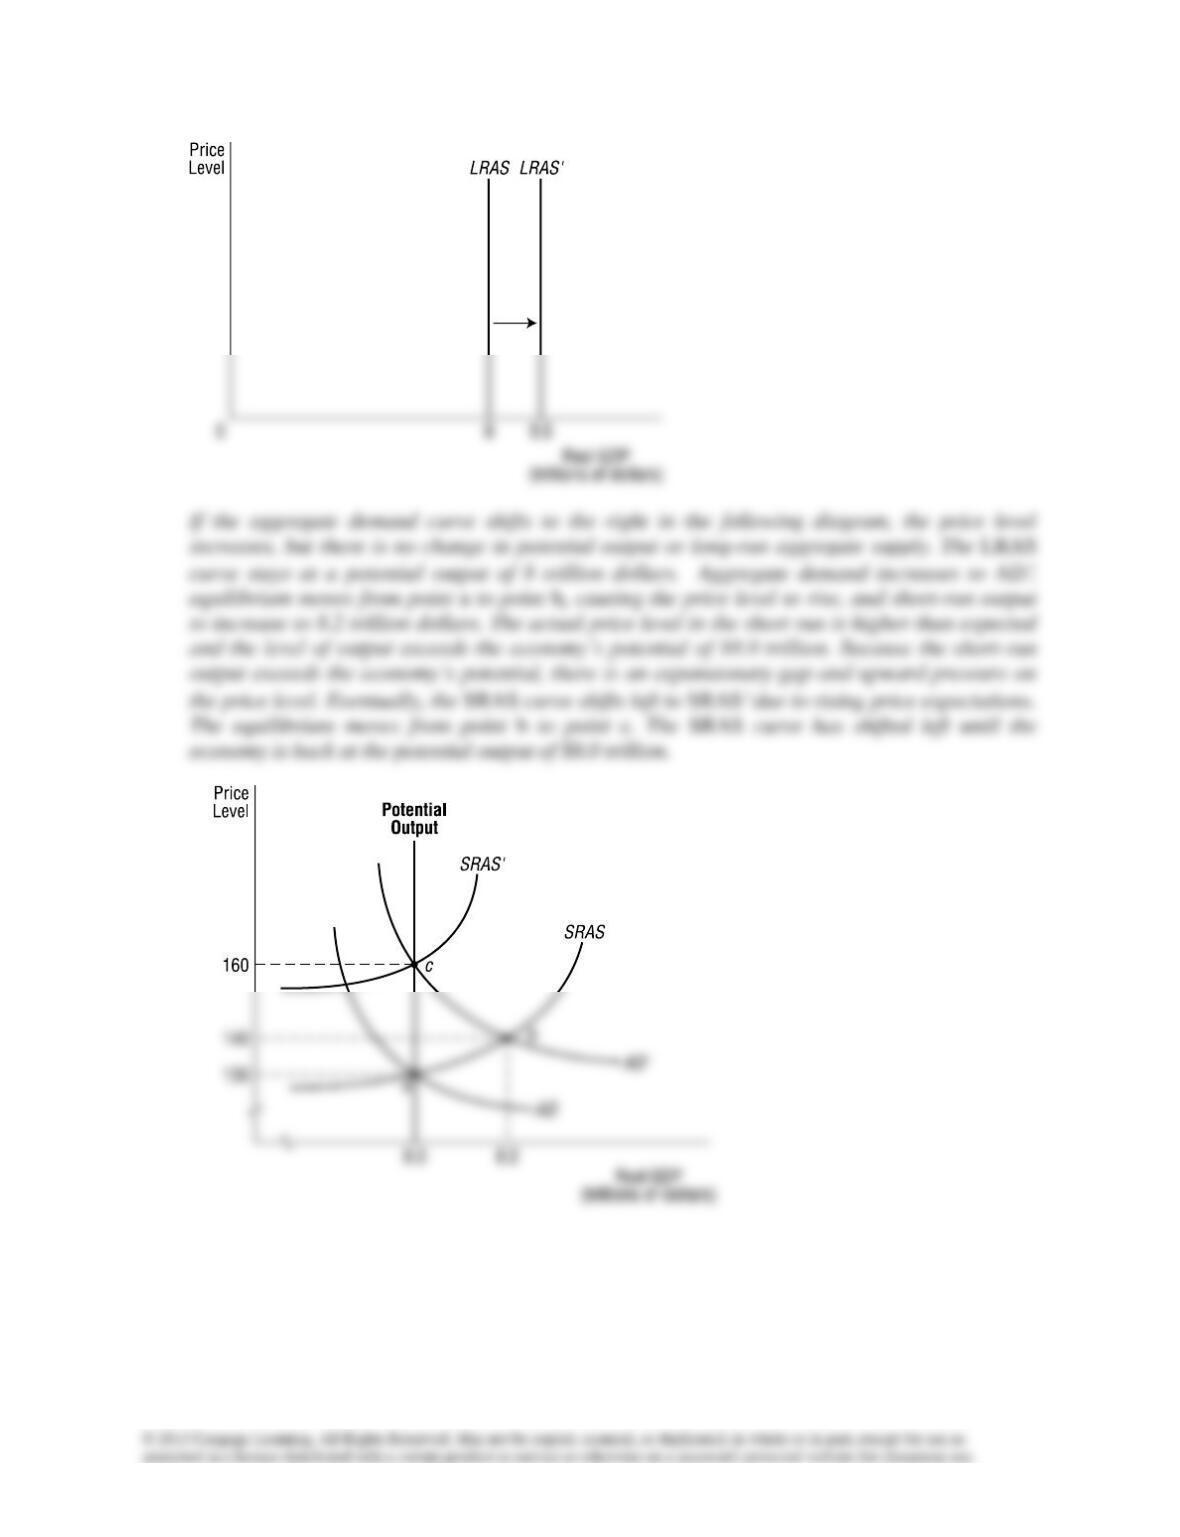
5. (Changes in Aggregate Supply) List three factors that can change the economy’s potential
output. What is the impact of shifts of the aggregate demand curve on potential output? Illustrate
your answers with a diagram.
Increases in resource availability, improvements in technology, or institutional changes that
Chapter 11 Aggregate Supply 153
Chapter 11 Aggregate Supply 154
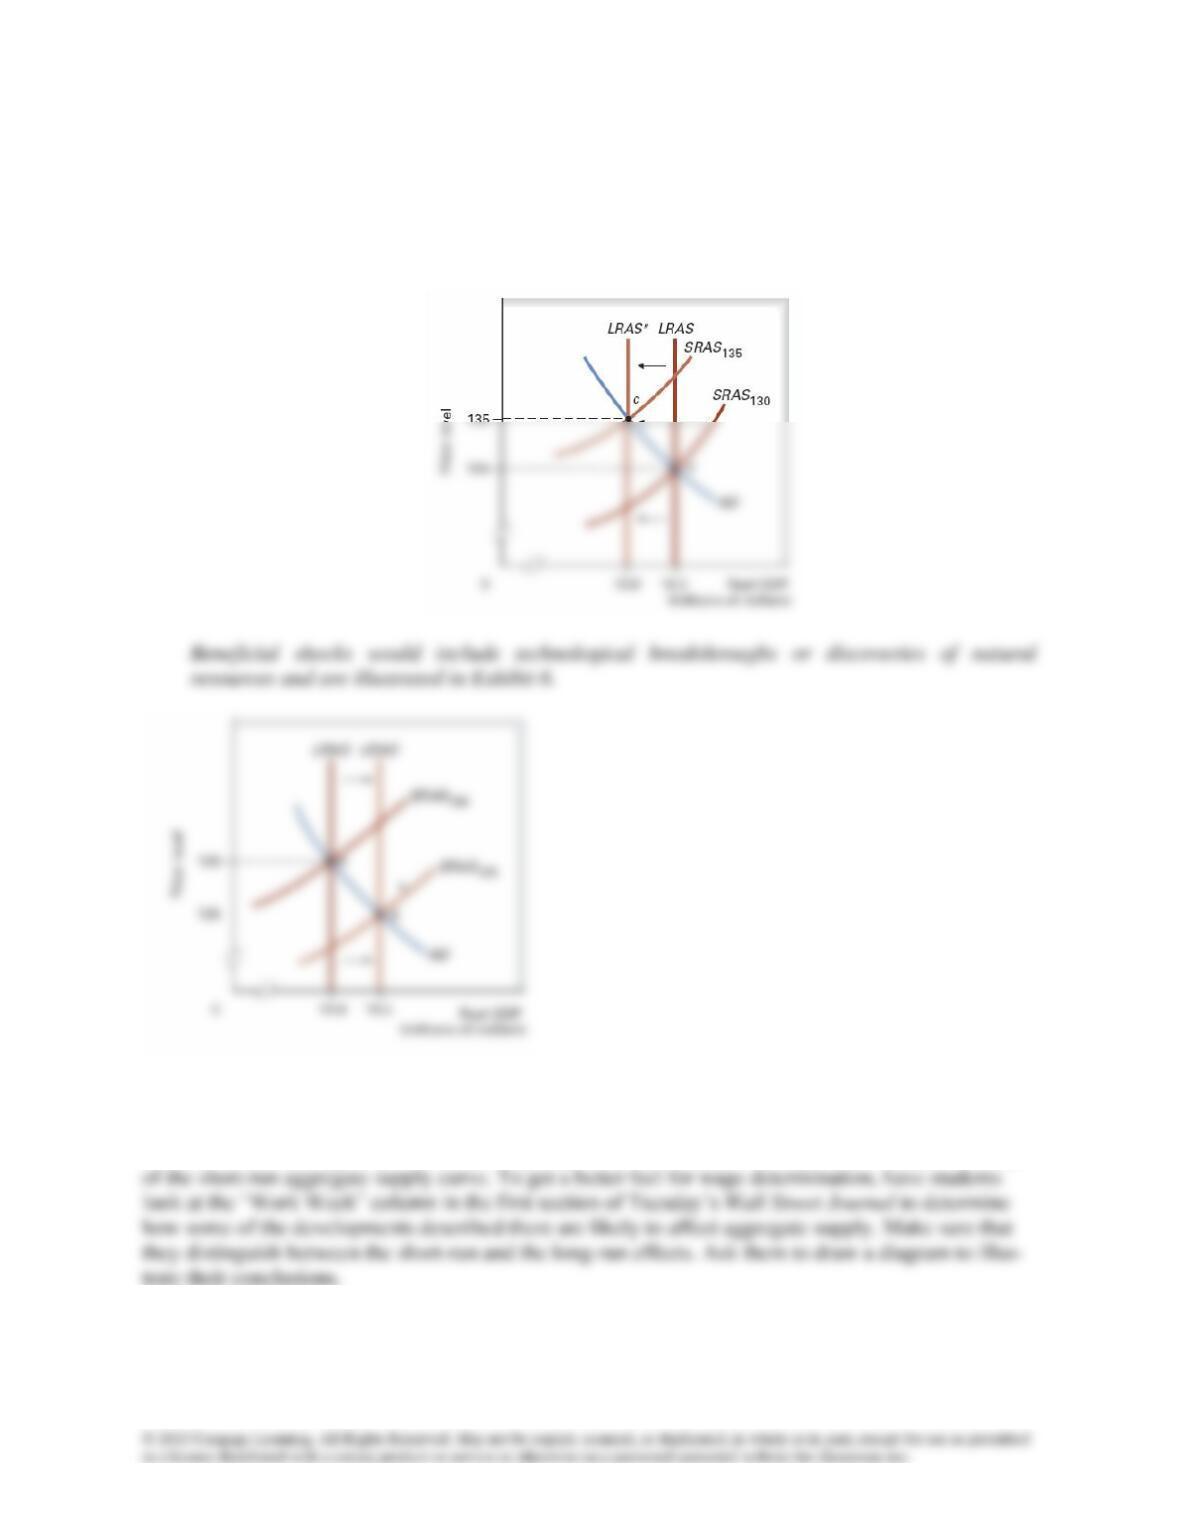
6. (Supply Shocks) Give an example of an adverse supply shock and illustrate graphically. Now
do the same for a beneficial supply shock.
A natural disaster and the attack on the World Trade Center are examples of adverse supply
shocks. The graph is Exhibit 7 in the text.
Experiential Assignment
1. In the short run, some workers’ wages are determined by contracts, and some are not. The split be-
tween costs that change as production changes and those that do not is a key determinant of the shape