Chapter 10
Monetary Policy and Aggregate Demand
◼ Chapter Outline, Overview, and Teaching Tips
Chapter Outline
The Federal Reserve and Monetary Policy
The Monetary Policy Curve
The Taylor Principle: Why the Monetary Policy Curve Has an Upward Slope
The Aggregate Demand Curve
Deriving the Aggregate Demand Curve Graphically
Factors That Shift the Aggregate Demand Curve
The Money Market and Interest Rates
Liquidity Preference and the Demand for Money
Chapter 10 Appendix: The Demand for Money
Keynesian Theories of Money Demand
Transactions Motive
Precautionary Motive
98 Mishkin • Macroeconomics: Policy and Practice, Second Edition
Empirical Evidence on the Demand for Money
Interest Rates and Money Demand
Stability of Money Demand
Chapter Overview and Teaching Tips
Chapter 10 develops two other building blocks of the AD/AS framework: the monetary policy curve and
the aggregate demand curve. It explains why monetary policy makers raise interest rates when inflation
rises so that there is a positive relationship between real interest rates and inflation, which is called the
The chapter then goes on to use the MP curve with the IS curve from the previous chapter to derive the
aggregate (AD) curve, a key element in the AD/AS framework. The AD curve has the usual downward
slope, but in contrast to the more traditional AD curve in other textbooks, it displays a negative
relationship between inflation (instead of the price level) and aggregate demand. The AD curve is derived
both graphically and with a numerical example to hone students’ intuition, and students are shown that the
factors that shift the IS curve are the same ones that shift the AD curve in exactly the same direction.
The last part of the chapter can be skipped without loss of continuity, but it provides more detail on how
central banks like the Federal Reserve set interest rates. It brings in the LM analysis that is often found in
◼ Answers to End of Chapter Review Questions and Problems
Answers to Review Questions
The Federal Reserve and Monetary Policy
1. The real interest rate is the nominal interest rate minus the expected inflation rate. Because it adjusts
for inflation, the real interest rate indicates the reward for lending and the cost of borrowing money in
purchasing power rather than dollar terms. Because prices are sticky in the short run, changes in the
Chapter 10 Monetary Policy and Aggregate Demand 99
The Monetary Policy Curve
2. The monetary policy curve represents the relationship between the inflation rate and the real interest
rate. It slopes upward because monetary policy makers who wish to keep actual inflation and
3. An autonomous monetary policy tightening occurs when the Fed decides to raise the real interest rate
The Aggregate Demand Curve
4. The aggregate demand curve shows combinations of the inflation rate and the quantity of aggregate
output for which the goods market is in equilibrium with Y = C + I + G + NX. It slopes downward
5. The aggregate demand curve shifts to the right if autonomous consumption, autonomous investment,
6. When the Fed tightens monetary policy by raising the real interest rate at any given inflation rate, this
means that the quantity of aggregate output demanded at any given inflation rate will be lower and so
The Money Market and Interest Rates
7. The demand for real money balances (M d/P) depends on the nominal interest rate i and real income
Y. Real money balances earn little or no interest; the opportunity cost of holding them is the nominal
interest rate that could be earned on bonds. The higher this interest rate, the greater the interest
8. Open market operations are purchases or sales of government securities the Fed undertakes to change
the level of bank reserves and the amount of lending that banks do. When the Fed purchases
100 Mishkin • Macroeconomics: Policy and Practice, Second Edition
9. Equilibrium in the money market occurs through adjustments in the nominal interest rate to bring the
demand and supply for real money balances into equality. If the nominal interest rate is above its
equilibrium value, the quantity of real money balances supplied is greater than the quantity of real
10. The equilibrium interest rate increases if real income increases, which shifts the money demand curve
to the right; if the Fed reduces the supply of real money balances, which shifts the money supply
Answers to Problems
The Monetary Policy Curve
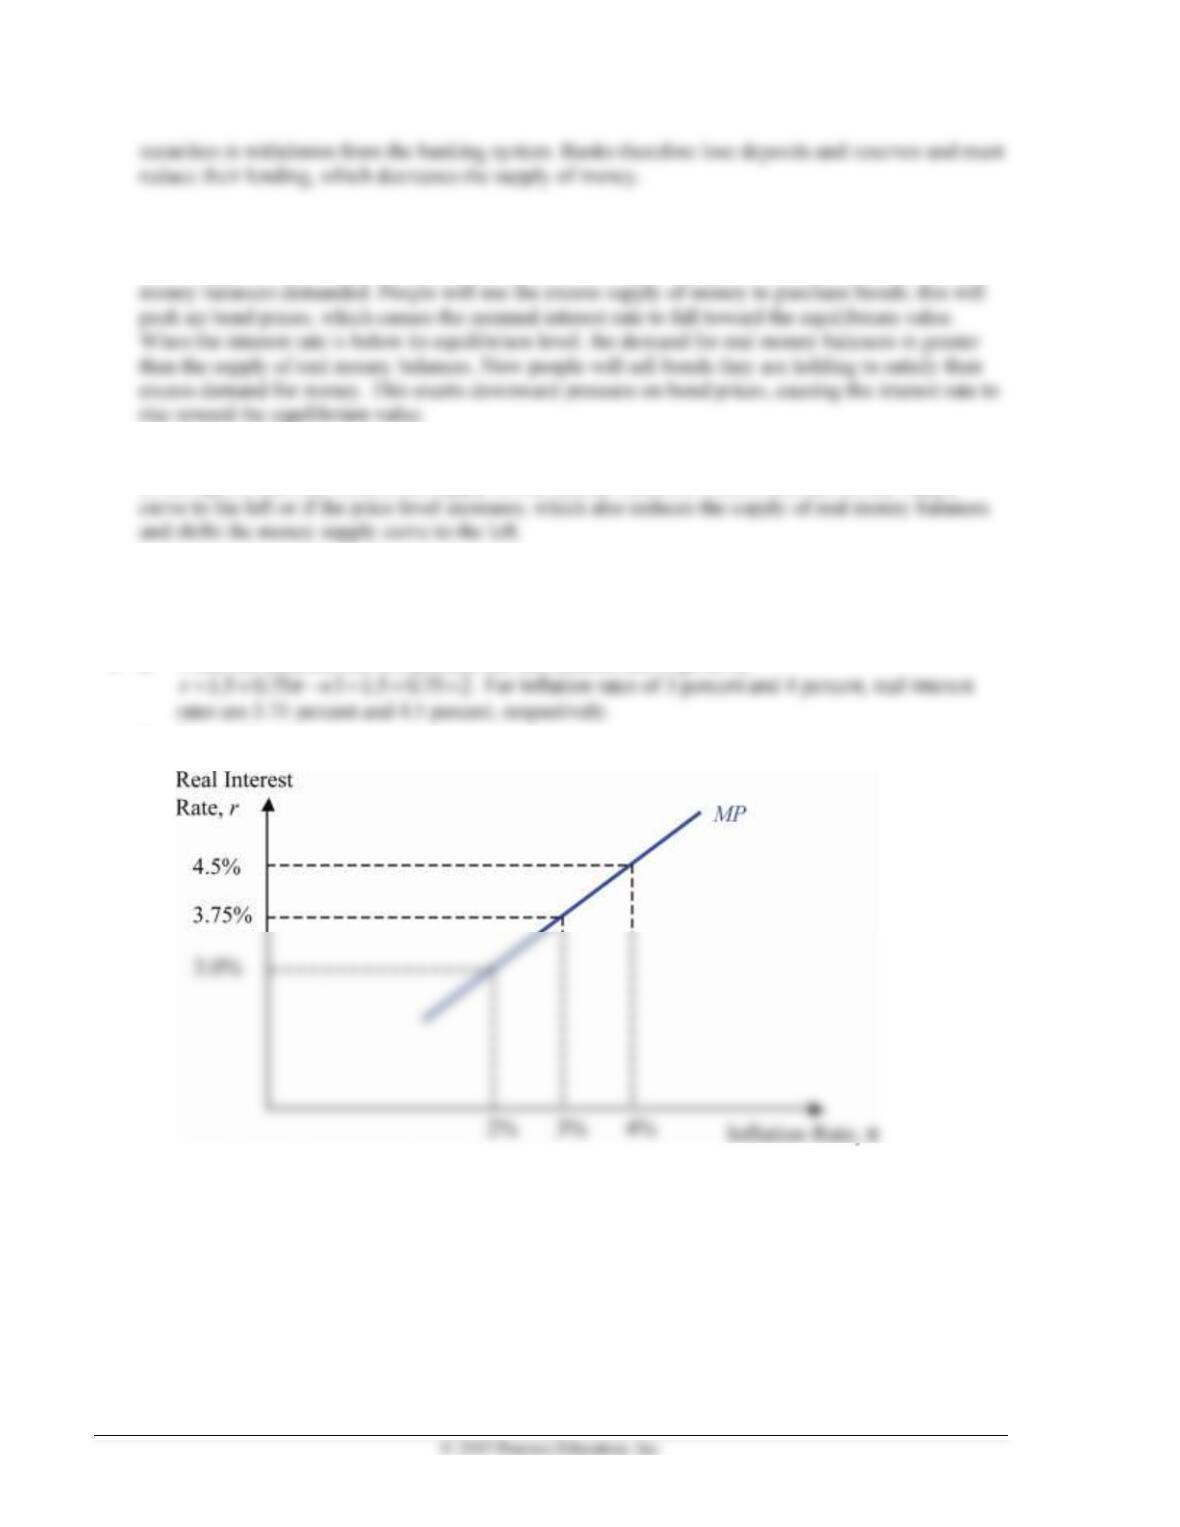
1. a. When the inflation rate is 2 percent, the real interest rate is given by:
b. See graph:
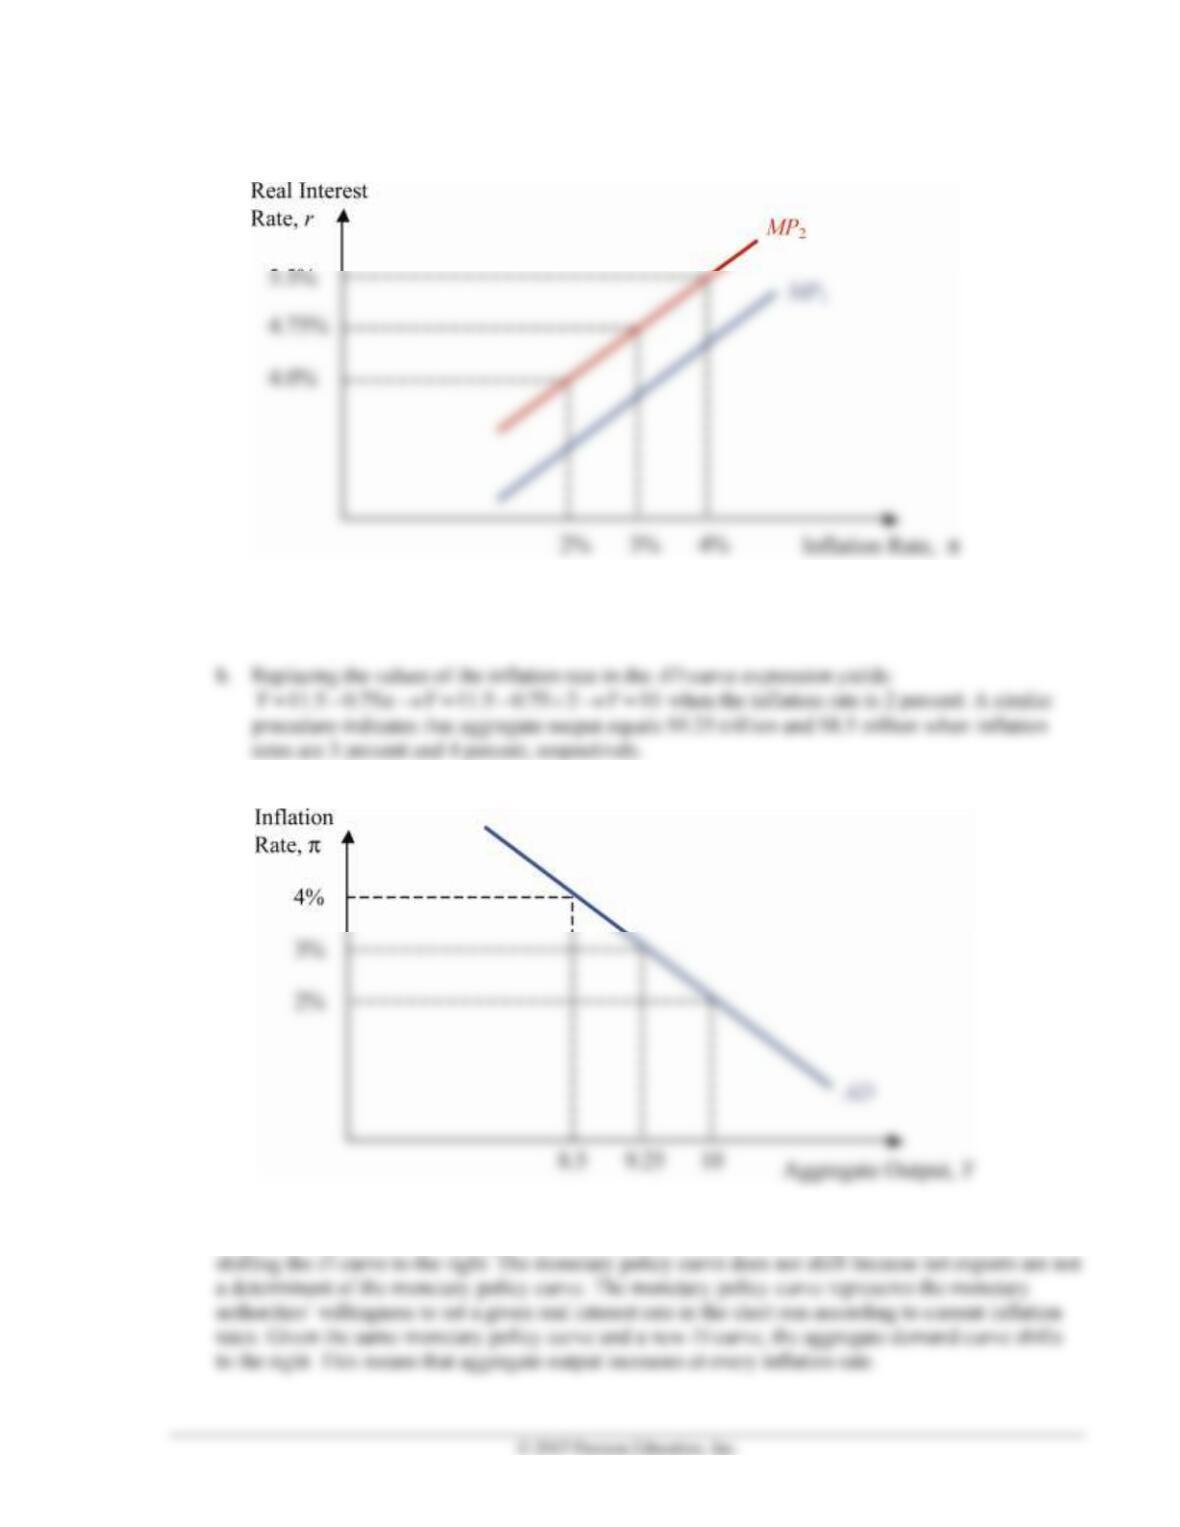
2. a. According to the new monetary policy curve, the real interest rate is higher at every inflation rate.
This means that there is an autonomous tightening of monetary policy.
Chapter 10 Monetary Policy and Aggregate Demand 101
b.
The Aggregate Demand Curve
3. a. Substituting the expression for the monetary policy curve in the IS curve equation yields:
13 (1.5 0.75 ) 11.5 0.75Y
= − + = −
c. See graph:
4. An increase in U.S. net exports directly affects the IS curve because planned expenditure increases at
every real interest rate. Assuming the goods market is in equilibrium, aggregate output increases,
102 Mishkin • Macroeconomics: Policy and Practice, Second Edition
5. a. A Fed chairman mostly worried about decreasing unemployment will probably result in a
loosening of monetary policy. Graphically, this translates as lower real interest rates at each
The Money Market and Interest Rates
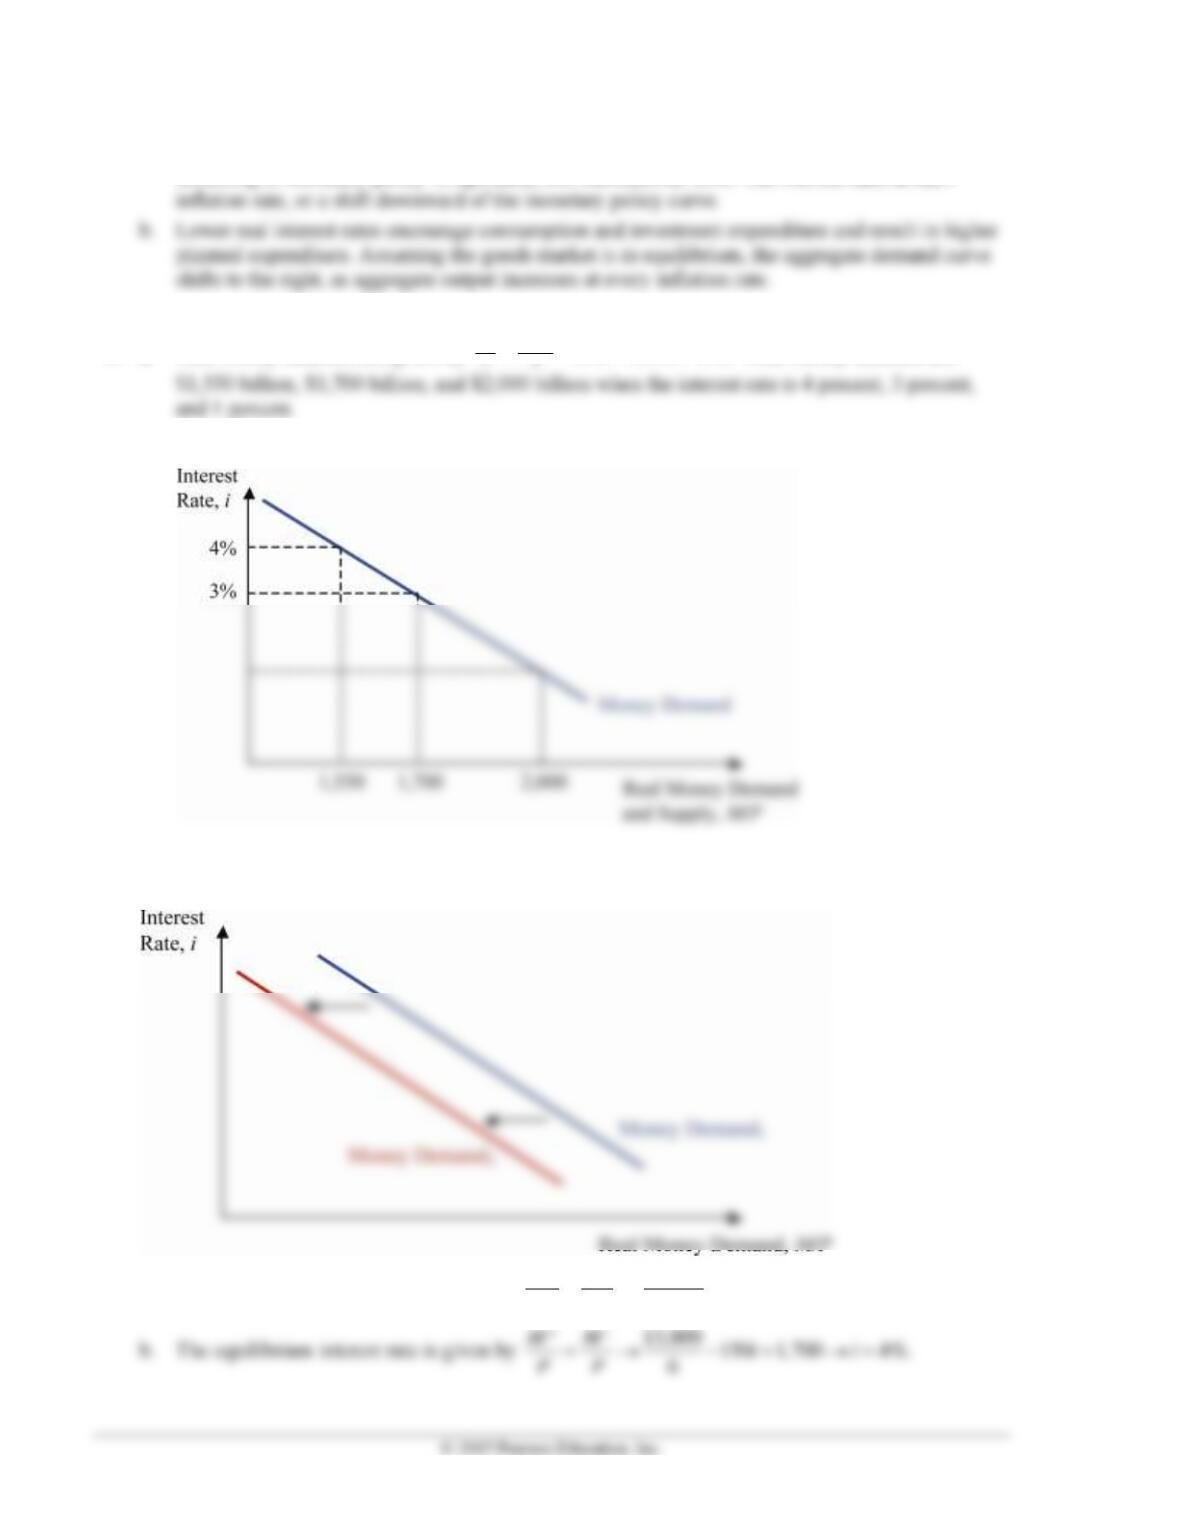
6. a. Real money balances are given by
12,900
d
M
. Real money balances are
b. See graph:
7. If aggregate output decreases, the demand for real money balances decreases at every given interest
rate. This results in a shift to the left in the demand curve.
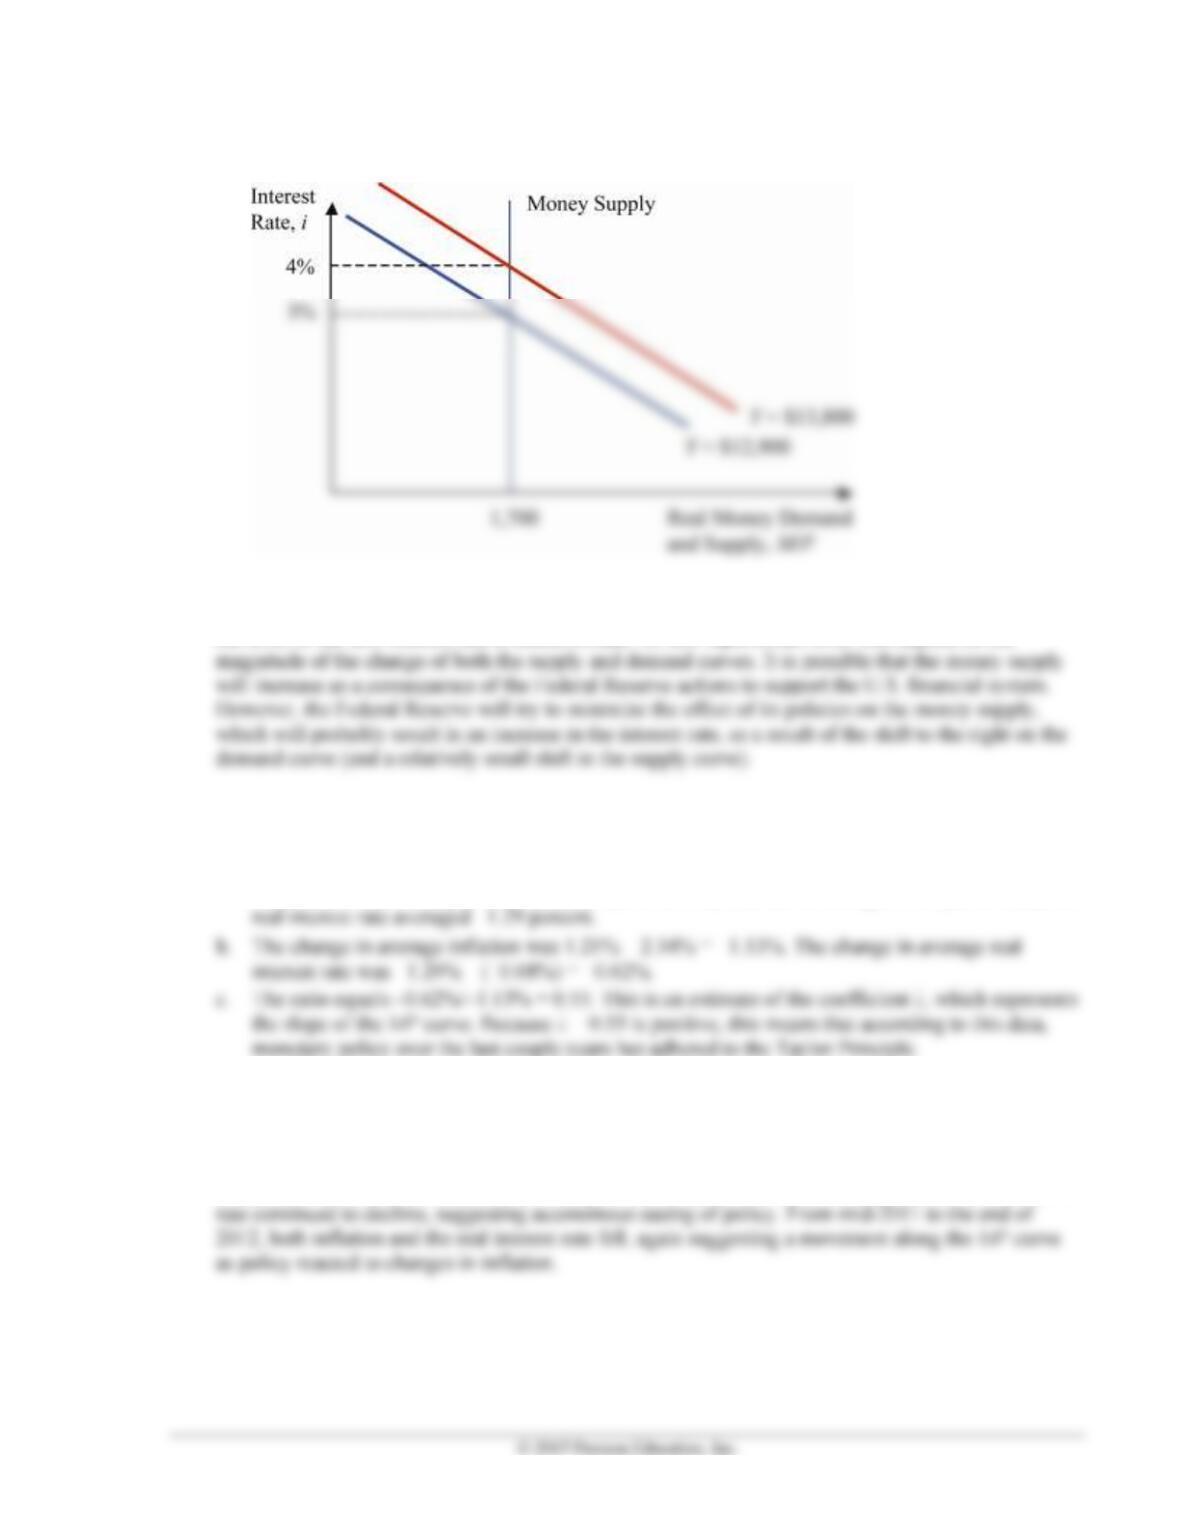
8. a. The equilibrium interest rate is given by
12,900 150 1,700 3%.
6
ds
MM ii
PP
= → − = → =
Chapter 10 Monetary Policy and Aggregate Demand 103
c. See graph:
9. The increase in aggregate output shifts the demand curve to the right, increasing the interest rate,
holding everything else constant. If the Federal Reserve decides to increase the money supply, then
the level of the new interest rate is indeterminate. Its new equilibrium level will depend on the
◼ Answers to Data Analysis Problems
1. a. For the period of 2011:Q2 to 2012:Q1, average inflation was 2.34 percent, and the average real
interest rate was –0.68 percent. For 2012:Q2 to 2013:Q1, inflation averaged 1.21 percent, and the
2. See graph on the next page. Periods of autonomous monetary policy change are characterized by a
decoupling of real rates and inflation rates. From the middle of 2007 to late 2008, inflation increased,
while the real interest rate fell, indicating an autonomous easing of policy. The period from late 2008
through mid-2009 was consistent with a move along the MP curve, where policy was reacting to
variation in inflation. From mid-2009 through mid-2011, inflation rose steadily, while the real interest
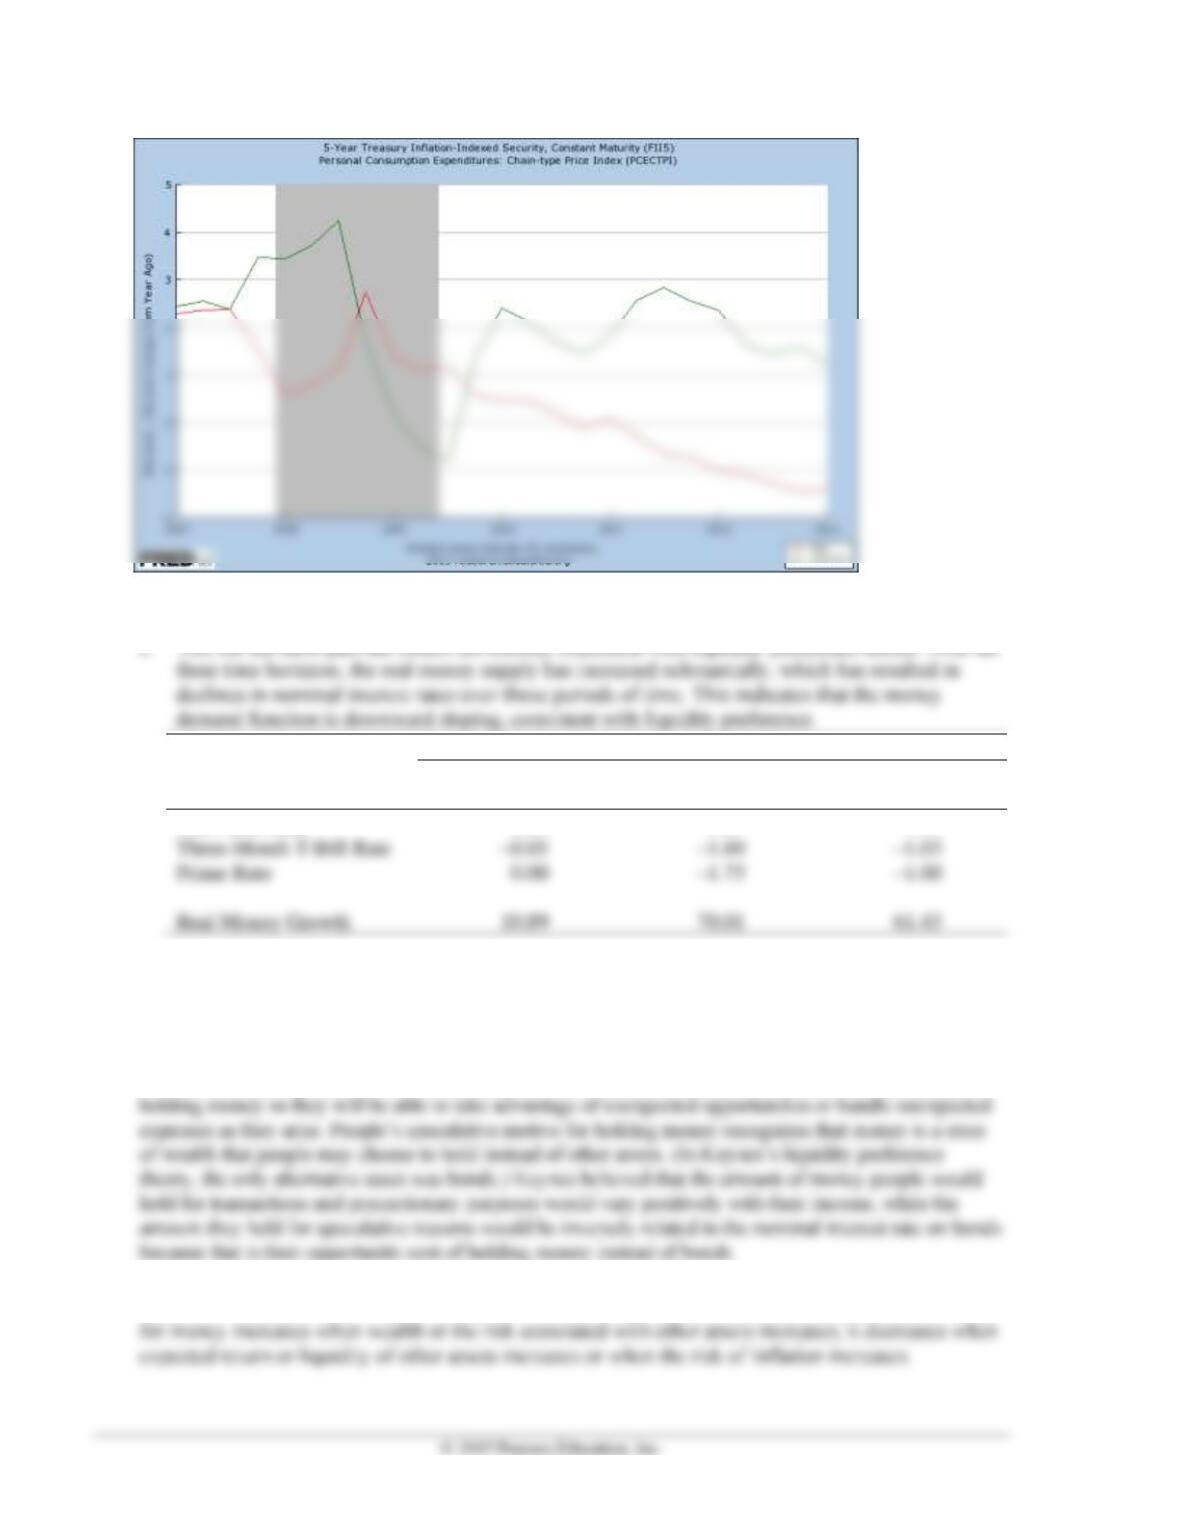
104 Mishkin • Macroeconomics: Policy and Practice, Second Edition
a. See table below.
b. See below.
Percentage Point Change
May 2012 to
May 2013
May 2008 to
May 2013
May 2003 to
May 2013
Fed Funds Rate
–0.05
–1.87
–1.15
Real Money Growth
◼ Answers to Appendix Review Questions and Problems
1. The three motives Keynes discussed were the transactions motive, the precautionary motive, and the
speculative motive. The transactions motive refers to people wishing to hold money because it is the
medium of exchange they need for their daily transactions. The precautionary motive refers to people
2. The four determinants of money demand identified in portfolio theory are wealth, expected return
relative to other assets, risk relative to other assets, and liquidity relative to other assets. The demand
Chapter 10 Monetary Policy and Aggregate Demand 105
3. Macroeconomic researchers use data on money supply (which in equilibrium equals money demand),
output, and interest rates to estimate the money demand function. Comparing the results of numerous
studies covering various time periods shows how consistent the relationships between money
demand, output, and interest rates are over time. Based on this approach, the money demand function
4. This technology would result in a decrease in the transactions component of the demand for money
and, therefore, in a decrease in the demand for money. This would allow individuals to hold smaller
5. The lack of the necessary infrastructure needed by some payment technologies (e.g., credit card
reading machines, reliable phone lines, reliable electricity supply) or its high cost determines that
6. If most people hold cash to insure themselves against unfortunate events, then the precautionary
component of the demand for money will be higher than in other societies in which individuals do not
7.
Period 1
Period 2
Period 3
Period 4
Period 5
Period 6
Period 7
Y (in billions)
12,000
12,500
12,250
12,500
12,800
13,000
13,200
106 Mishkin • Macroeconomics: Policy and Practice, Second Edition
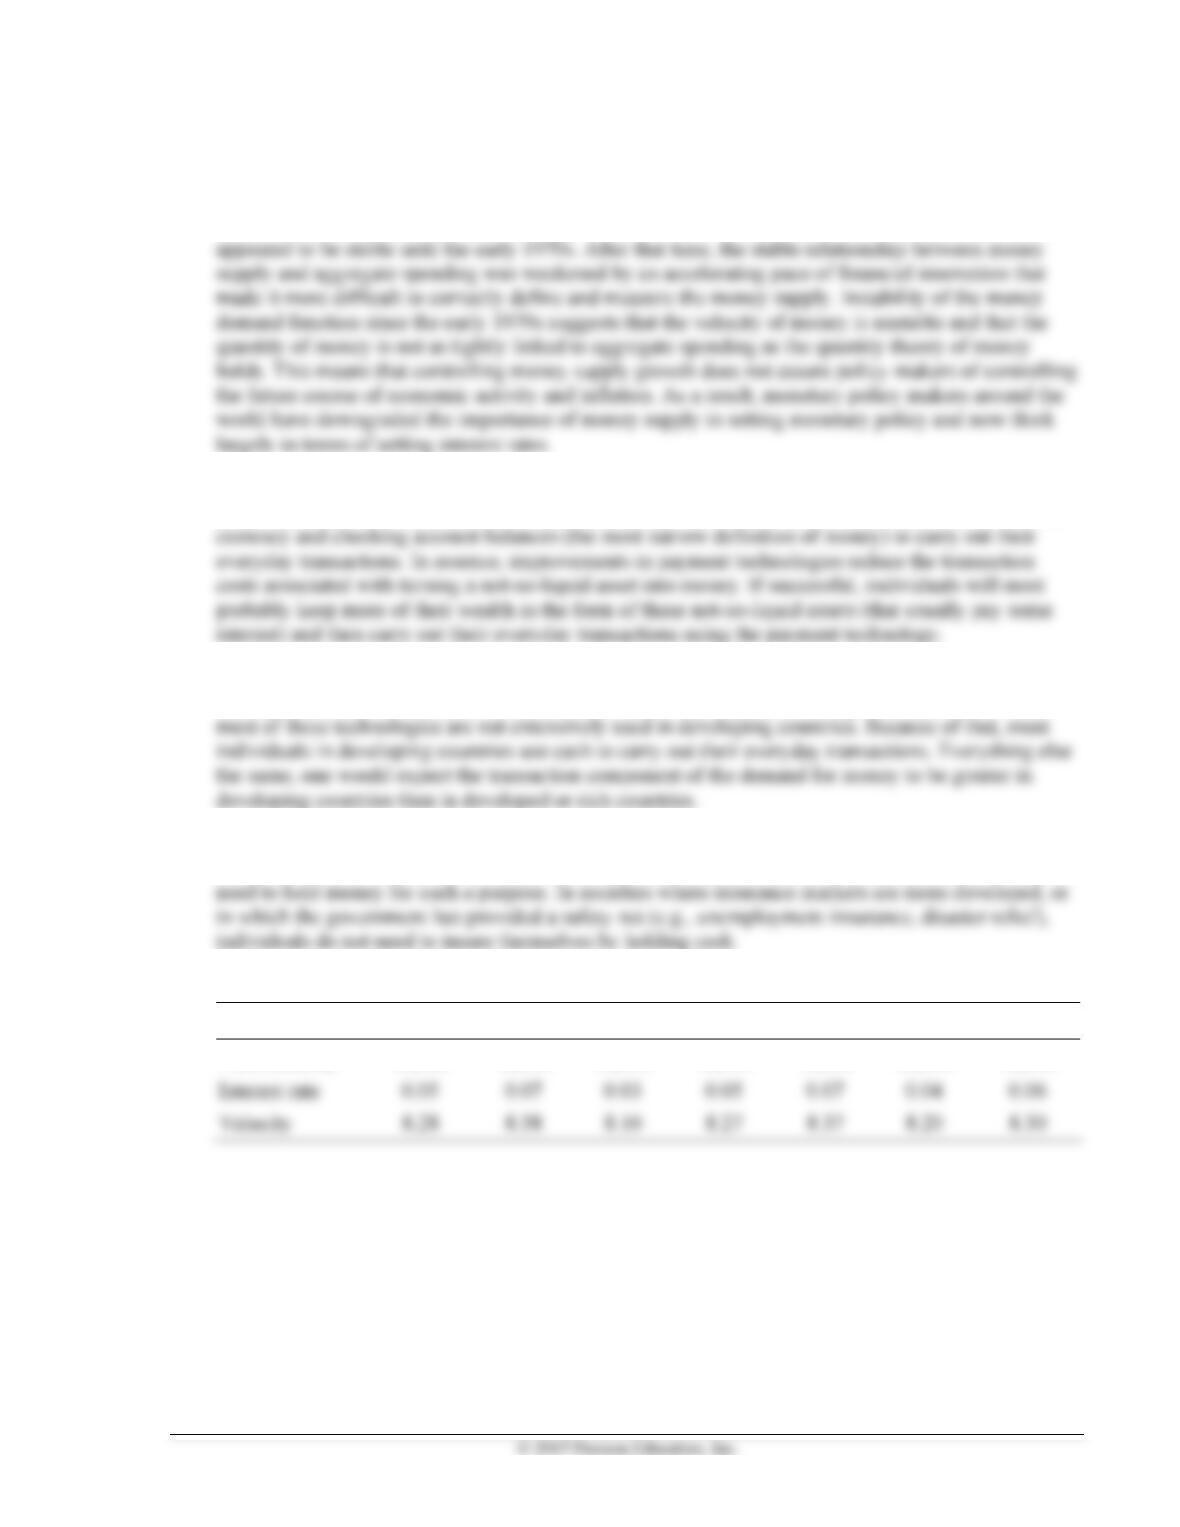
8.
Velocity
8.25
8.30
8.35
8.40
income is not primarily determined by movements in the quantity of money.
9. a. During a business cycle contraction, income decreases. As income and wealth are closely related,
wealth usually decreases as well. The decrease in wealth directly affects the demand for money,
10. High and volatile inflation rates decrease the relative real return of money, decreasing the demand for
money. As individuals observe a persistent increase in the price level, they tend to get rid of money
11. The portfolio theory approach to money demand predicts that the real return of holding money
sharply decreases during hyperinflations. During hyperinflations, the demand for money contracts so
much that sometimes other mediums of exchange are used to conduct trades. In some situations,
Chapter 10 Monetary Policy and Aggregate Demand 107
12. In the aftermath of a stock market crash, uncertainty about the performance of many firms increases,
and stock price volatility increases as well. The increase in stock price volatility increases the relative
safety of holding money. Thus, money demand should increase. However, shares of stock are a
significant portion of some individuals’ wealth. A stock market crash means that stock prices
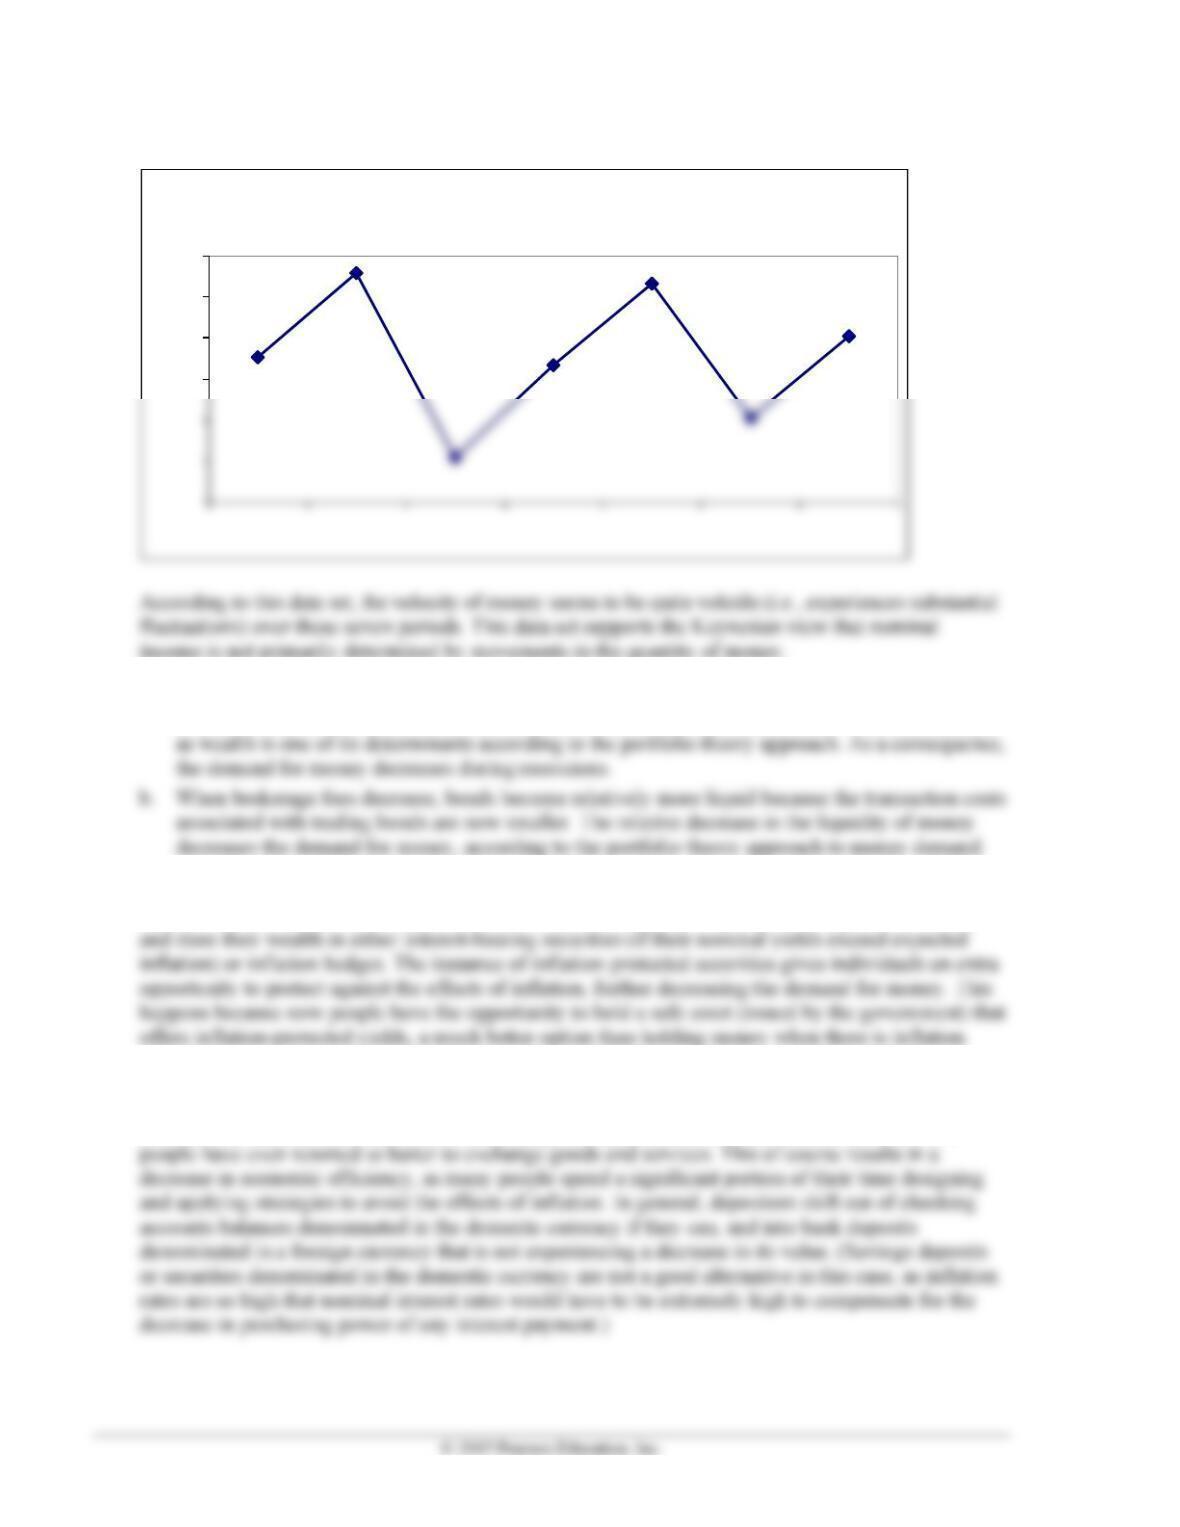
13. For this country, the evidence shows that velocity can be considered a constant, meaning that the
relationship between the money supply (as measured by M2) is closely related to aggregate spending
(nominal GDP). In this case it would be a good idea to focus the attention of monetary policy on a
◼ Data Sources, Related Articles, and Discussion Questions
A. For Information About Policy and Practice: Movements Along the MP
Curve: The Rise in the Federal Funds Rate Target, 2004–2006
Data Source
Federal Reserve Bank of St. Louis data base (FRED):
to observe changes in the effective federal funds rate engineered by the Fed during this period.
Related Article
Federal Reserve System, “Press Release”:
Discussion Question
In the second paragraph of the June 30, 2004, FOMC statement, the committee affirmed that it increased
the federal funds rate target partly due to the fact that “The evidence accumulated over the intermeeting
period indicates that output is continuing to expand at a solid pace and labor market conditions have
improved.” Explain why this should be interpreted as a movement along the MP curve and not as a shift in
the MP curve.
Answer; In this case, the FOMC quotes changes in economic conditions that are linked to future changes
108 Mishkin • Macroeconomics: Policy and Practice, Second Edition
B. For Information About Policy and Practice: Shifts in the MP Curve:
Autonomous Monetary Easing at the Onset of the 2007–2009 Financial Crisis
Data Source
Federal Reserve Bank of St. Louis data base (FRED):
2007–2010 to see the decrease in the effective federal funds rate engineered by the Fed during this period.
Related Article
Federal Reserve System, “Press Release”:
Discussion Question
In the second paragraph of the January 22, 2008, FOMC statement, the committee affirmed that it lowered
the federal funds rate target “… to help forestall some of the adverse effects on the broader economy that
might otherwise arise from the disruptions in financial markets and to promote moderate growth over
time.” Explain how this argument should be interpreted as a shift in the MP curve and not as a movement
along the MP curve.
Answer: It is clear from the FOMC’s choice of wording that its intention was to act to counter the effect of