Chapter 10
COMPETITIVE MARKETS
QUESTIONS AND ANSWERS
Q10.1 Historically, the Regional Bell Operating Companies (RBOCs) had a monopoly on the
provision of local voice phone service. Regulation has now been eased to permit
competition from Competitive Local Exchange Carriers (CLECs), cable companies,
satellite operators and wireless competitors. Is the local phone service market likely to
become a vigorously competitive market?
Q10.1 ANSWER
The local voice phone service market is not one likely to support dozens of competitors
in each local market, but competition among the few can become vigorous in this
market. Market structure is described in terms of the complete array of industry
Q10.2 One way of inferring competitive conditions in a market is to consider the lifestyle
enjoyed by employees and owners. In vigorously competitive markets, employee
compensation tends to be meager and profits are apt to be slim. Describe the perfectly
competitive market structure and provide some examples.
Q10.2 ANSWER
Perfect competition is a market structure characterized by a large number of buyers and
Competitive Markets 289
Q10.3 Competitive firms are sometimes criticized for costly but superfluous product
differentiation. Is there an easy means for determining if such efforts are in fact
wasteful?
Q10.3 ANSWER
Q10.4 The Worker Adjustment and Retraining Notification Act (WARN) requires employers
with 100 or more employees to provide notification 60 calendar days in advance of plant
closings and mass layoffs. Advance notice gives workers and their families transition
time to adjust to the prospective loss of employment, seek other jobs, or get necessary
training. Some employers complain that WARN reduces necessary flexibility and makes
them reluctant to open new production facilities. How are barriers to entry and exit
similar? How are they different?
Q10.4 ANSWER
A barrier to entry is defined as any factor or industry characteristic that creates an
advantage for incumbents over new arrivals. Legal rights such as patents and local,
290 Chapter 10
Whereas barriers to entry have the potential to impede competition by making
entry or growth difficult, competitive forces can also be diminished through barriers to
exit. A barrier to exit is any restriction on the ability of incumbents to redeploy assets
from use in one industry or line of business to another. During the late 1980s, for
example, several state governments initiated legal proceedings in order to impede plant
Q10.5 “A higher minimum wage means some low wage workers will get fired because there
will be less money available for labor costs. An international minimum wage, scaled
according to the working conditions and cost of living in a particular country, would
allow local workers to benefit without significant trade disruption.” Discuss this
statement and explain why the demand curve is apt to be horizontal in the unskilled
labor market.
Q10.5 ANSWER
In competitive markets, the demand curve tends to be horizontal because homogeneous
products are offered by several competitors. In product markets, firms are price takers in
Competitive Markets 291
paid more.
Q10.6 “For smaller firms managed by their owners in competitive markets, profit
considerations are apt to dominate almost all decisions. However, managers of giant
corporations have little contact with stockholders, and often deviate from profit–
maximizing behavior. Get real. Look at Tyco, for Pete’s sake.” Discuss this statement.
Q10.6 ANSWER
This is, of course, a controversial subject. Most analysts concede that profit
maximization is a prime concern of owner-managers that run small businesses in hotly
competitive markets. In vigorously competitive markets, productive efficiency is
Q10.7 “If excess profits are rampant in the oil business, why aren’t the stockholders of industry
giants like Exxon Mobil, Chevron Texaco, and Royal Dutch Petroleum making huge
stock-market profits?” Discuss this statement.
Q10.7 ANSWER
The stock market is a forward-looking device. If anticipated profits rise, stock prices go
292 Chapter 10
Q10.8 “Airline passenger service is a terrible high-fixed cost business featuring fierce price
competition. With uniform safety, customers pick the lowest airfare with the most
convenient departures. Except for pilots, nobody in the airline business makes any
money.” Use the competitive firm short-run supply curve concept to explain entry and
exit in the airline passenger business. Why are pilots so well paid?
Q10.8 ANSWER
An individual airline will supply output so long as it is profitable to do so. Profits are
maximized by setting MR = MC. Because P = MR in a competitive industry, perfectly
Competitive Markets 293
Q10.9 Suppose that a competitive firm long-run supply curve is given by the expression QF = –
500 + 10P. Does this mean that the firm will supply -500 units of output at a zero
price? If so, what does output of -500 units mean?
Q10.9 ANSWER
Taken literally, a competitive firm long-run supply curve given by the expression QF = –
Q10.10 The long-run supply curve for a given competitive firm can be written as QF = -250 +
8P or P = $31.25 + $0.125QF. Explain why the amount supplied by 50 such
competitors is determined by multiplying the first expression by 50 rather than by
multiplying the second expression by a similar amount.
Q10.10 ANSWER
The amount supplied in a competitive market is simply the sum of output produced by
all established competitors. In a market comprised of 50 firms with identical costs, the
SELF-TEST PROBLEMS AND SOLUTIONS
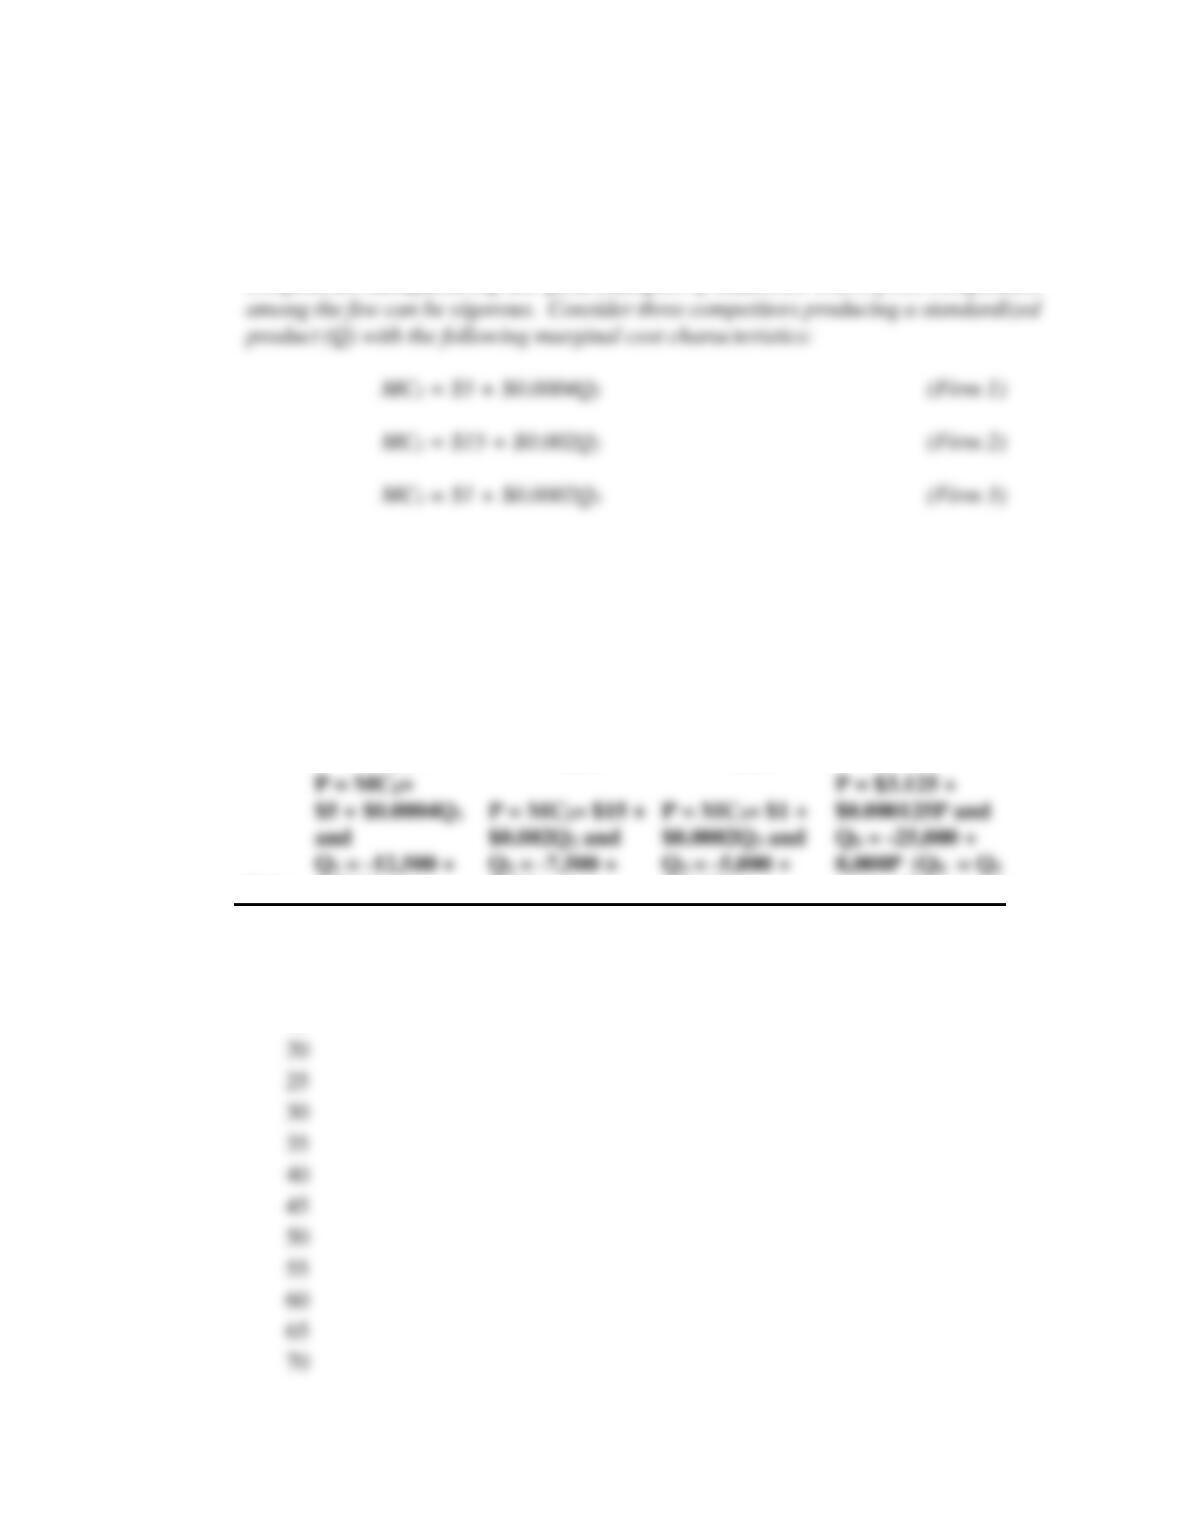
ST10.1 Market Supply. In some markets, cutthroat competition can exist even when the market
is dominated by a small handful of competitors. This usually happens when fixed costs
294 Chapter 10
are high, products are standardized, price information is readily available, and excess
capacity is present. Airline passenger service in large city-pair markets, and electronic
components manufacturing are good examples of industries where price competition
A. Using each firm’s marginal cost curve, calculate the profit-maximizing short-run supply
from each firm at the competitive market prices indicated in the following table. For
simplicity, assume price is greater than average variable cost in every instance.
Market Supply is the Sum of Firm Supply Across all Competitors
Firm One
Supply
Firm Two
Supply
Firm Three
Supply
Market Supply
Price
2,500P
500P
5,000P
+ Q2 + Q3)
$0
5
10
15
20
25
30
40
45
50
55
60
Competitive Markets 295
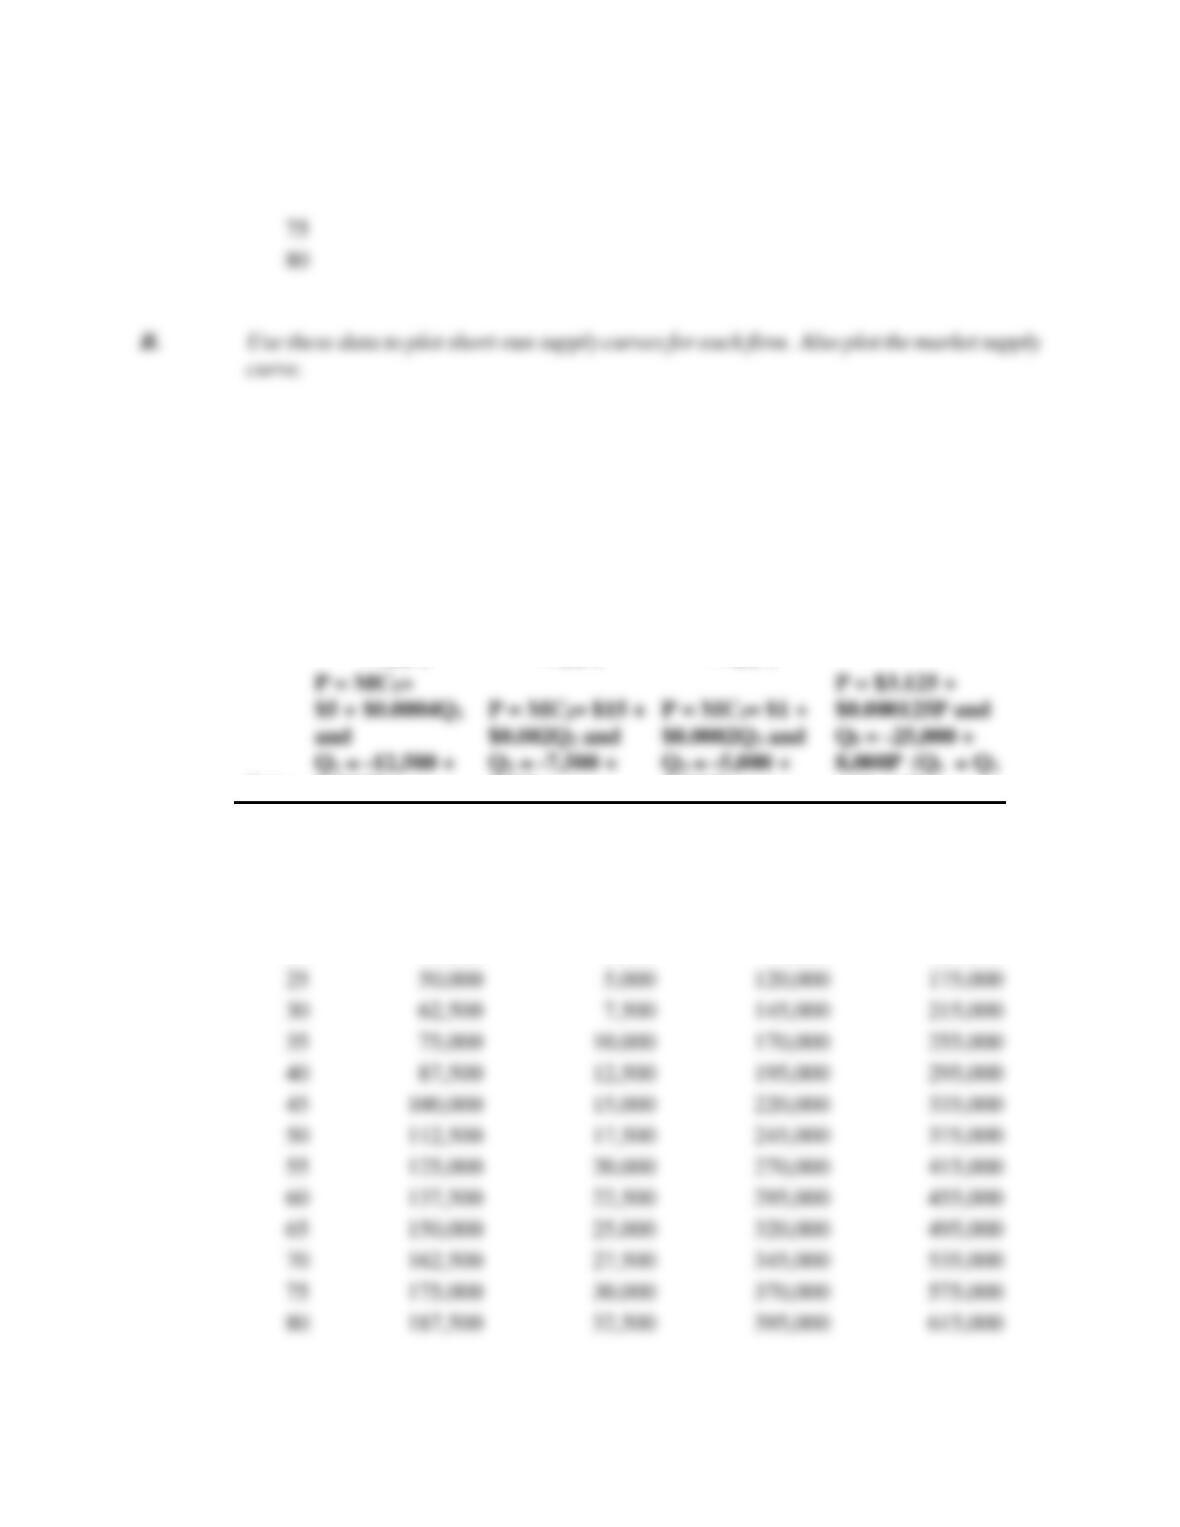
ST10.1 SOLUTION
A. The marginal cost curve constitutes the short-run supply curve for firms in perfectly
competitive markets so long as price is greater than average variable cost.
Market Supply is the Sum of Firm Supply Across all Competitors
Firm One
Supply
Firm Two
Supply
Firm Three
Supply
Market Supply
Price
2,500P
500P
5,000P
+ Q2 + Q3)
$0
-12,500
-7,500
-5,000
-25,000
5
0
-5,000
20,000
15,000
10
12,500
-2,500
45,000
55,000
15
25,000
0
70,000
95,000
20
37,500
2,500
95,000
135,000
25
50,000
5,000
120,000
175,000
30
62,500
7,500
145,000
215,000
35
75,000
10,000
170,000
255,000
40
87,500
12,500
195,000
295,000
45
100,000
15,000
220,000
335,000
296 Chapter 10
B.
Market Supply is the Sum of Firm Supply Across all Competitors
$70
$80
$90
Firm 1 Supply
Q1 = -12,500 + 2,500P drawn as
Market supply is the total amount supplied by all
competitors.
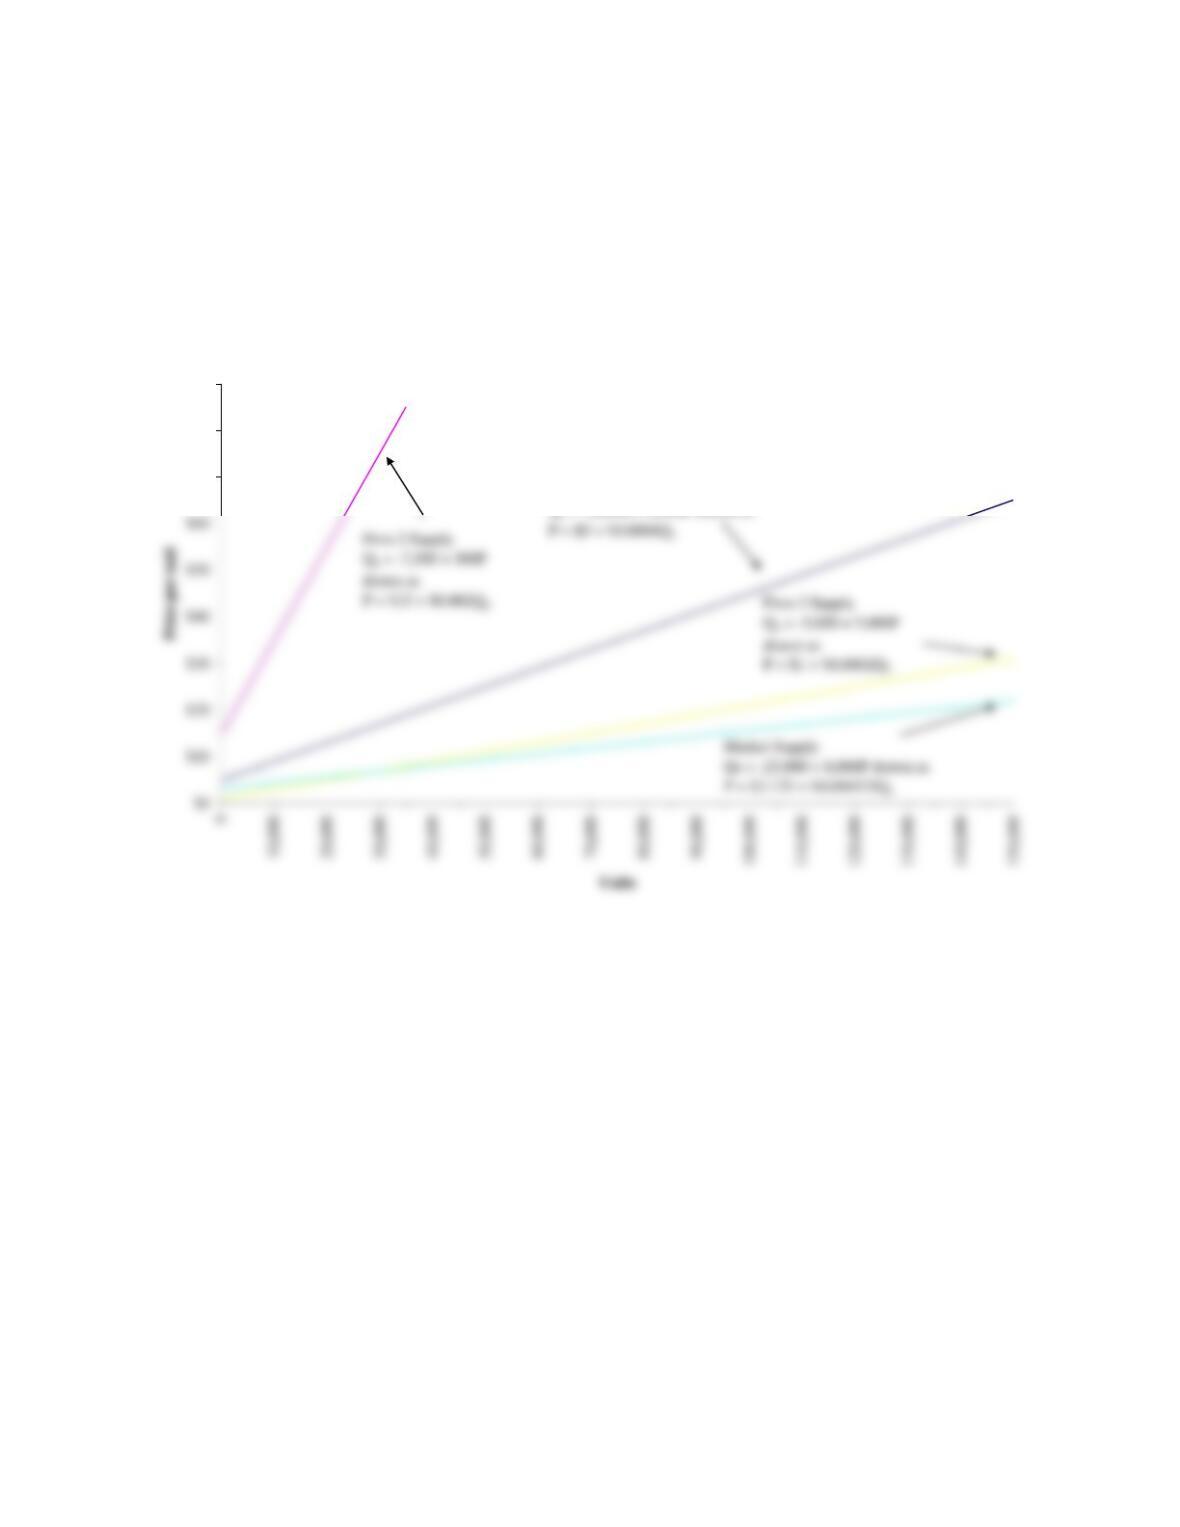
ST10.2 Competitive Market Equilibrium. Competitive market prices are determined by the
interplay of aggregate supply and demand; individual firms have no control over price.
Market demand reflects an aggregation of the quantities that customers will buy at each
or equivalently, when output is expressed as a function of price
QD = 400,000 – 10,000P
Assume market supply is provided by five competitors producing a standardized product
(Q). Firm supply schedules are as follows:
Q1 = 18 +2P (Firm 1)
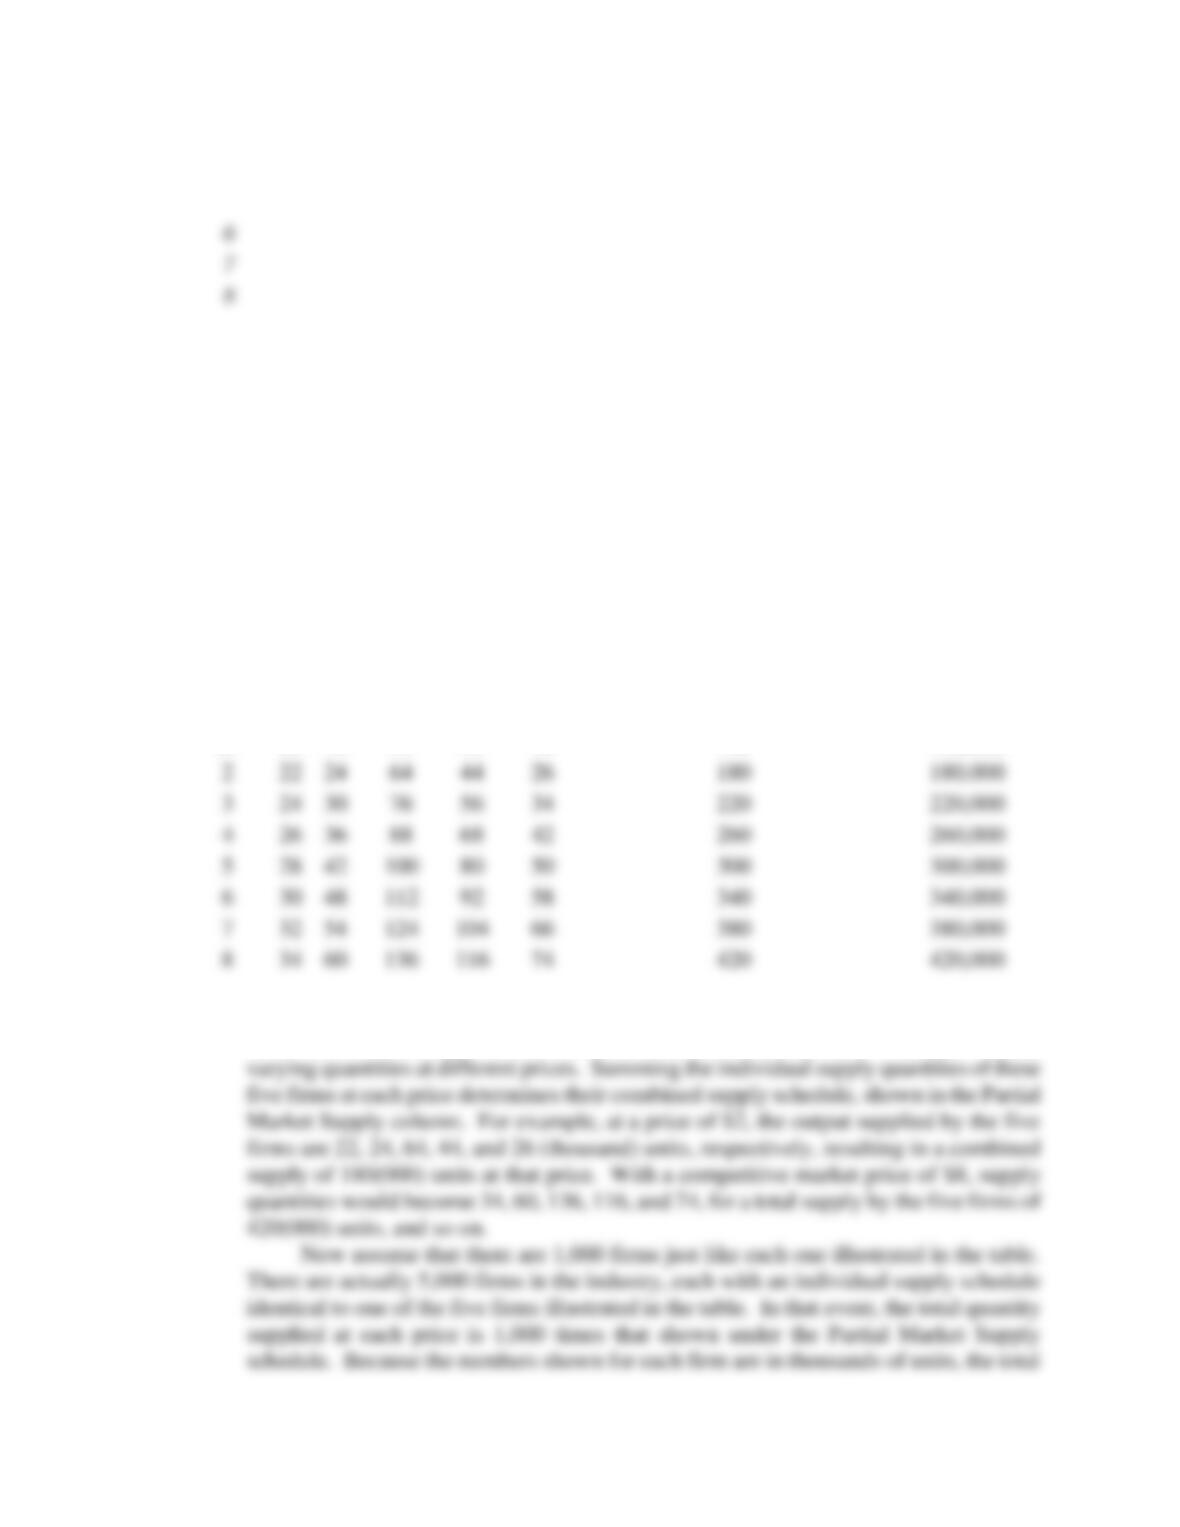
A. Calculate the optimal quantity supplied by each firm at the competitive market prices
indicated in the following table. Then, assume there are actually 1,000 firms just like
each one illustrated in the table. Use this information to complete the Partial Market
Supply and Total Market Supply columns.
Quantity Supplied by
Firm (000)
Price
1
+ 2
+ 3
+ 4
+ 5
= Partial Market Supply ×
1,000
= Total Market
Supply (000)
$1
298 Chapter 10
B. Sum the individual firm supply curves to derive the market supply curve. Plot the market
demand and market supply curve with price as a function of output to illustrate the
equilibrium price and level of output. Verify that this is indeed the market equilibrium
price-output combination algebraically.
ST9.2 SOLUTION
A.
Quantity Supplied by Firm
(000)
Price
1
+ 2
+ 3
+ 4
+ 5
= Partial Market Supply ×
1,000
= Total
Market
Supply (000)
$1
20
18
52
32
18
140
140,000
2
22
24
64
44
26
180
180,000
6
30
48
112
92
58
340
340,000
7
32
54
124
104
66
380
380,000
The data in the table illustrate the process by which an industry supply curve is
constructed. First, suppose that each of five firms in an industry is willing to supply
Competitive Markets 299
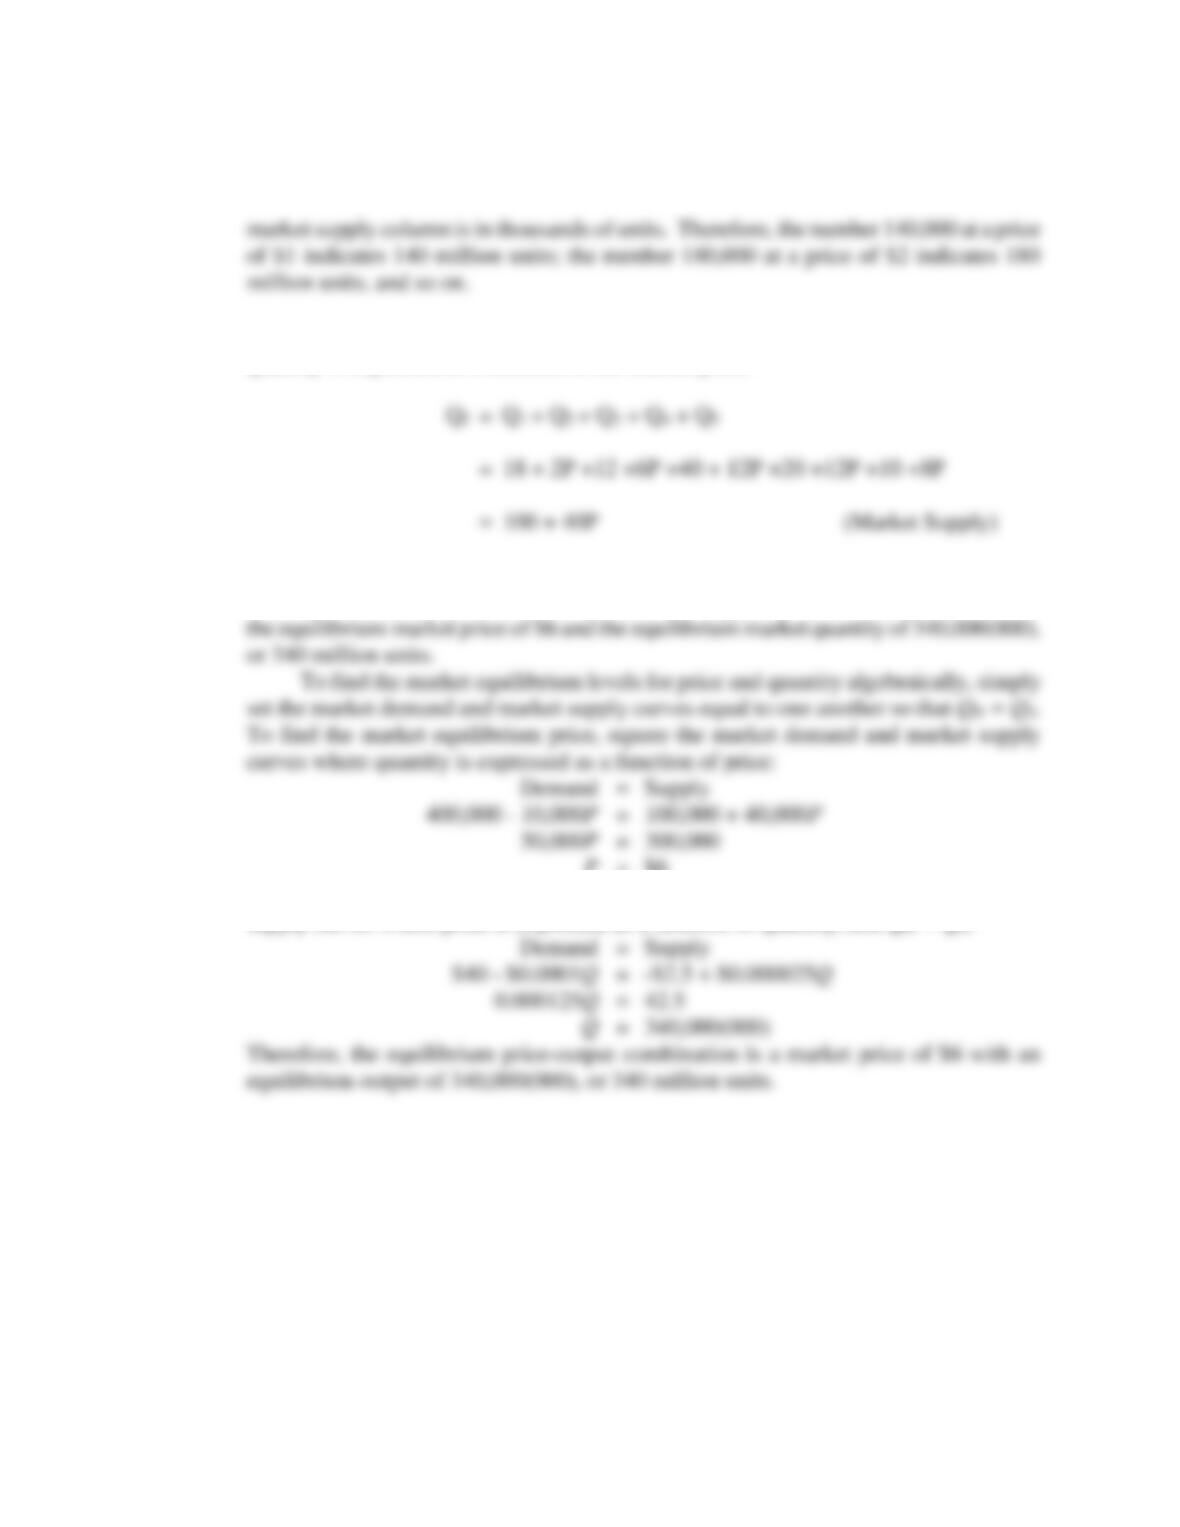
B. To find the market supply curve, simply sum each individual firm’s supply curve, where
quantity is expressed as a function of the market price:
Plotting the market demand curve and the market supply curve allows one to determine
P = $6
To find the market equilibrium quantity, set equal the market demand and market
supply curves where price is expressed as a function of quantity, and QD = QS:
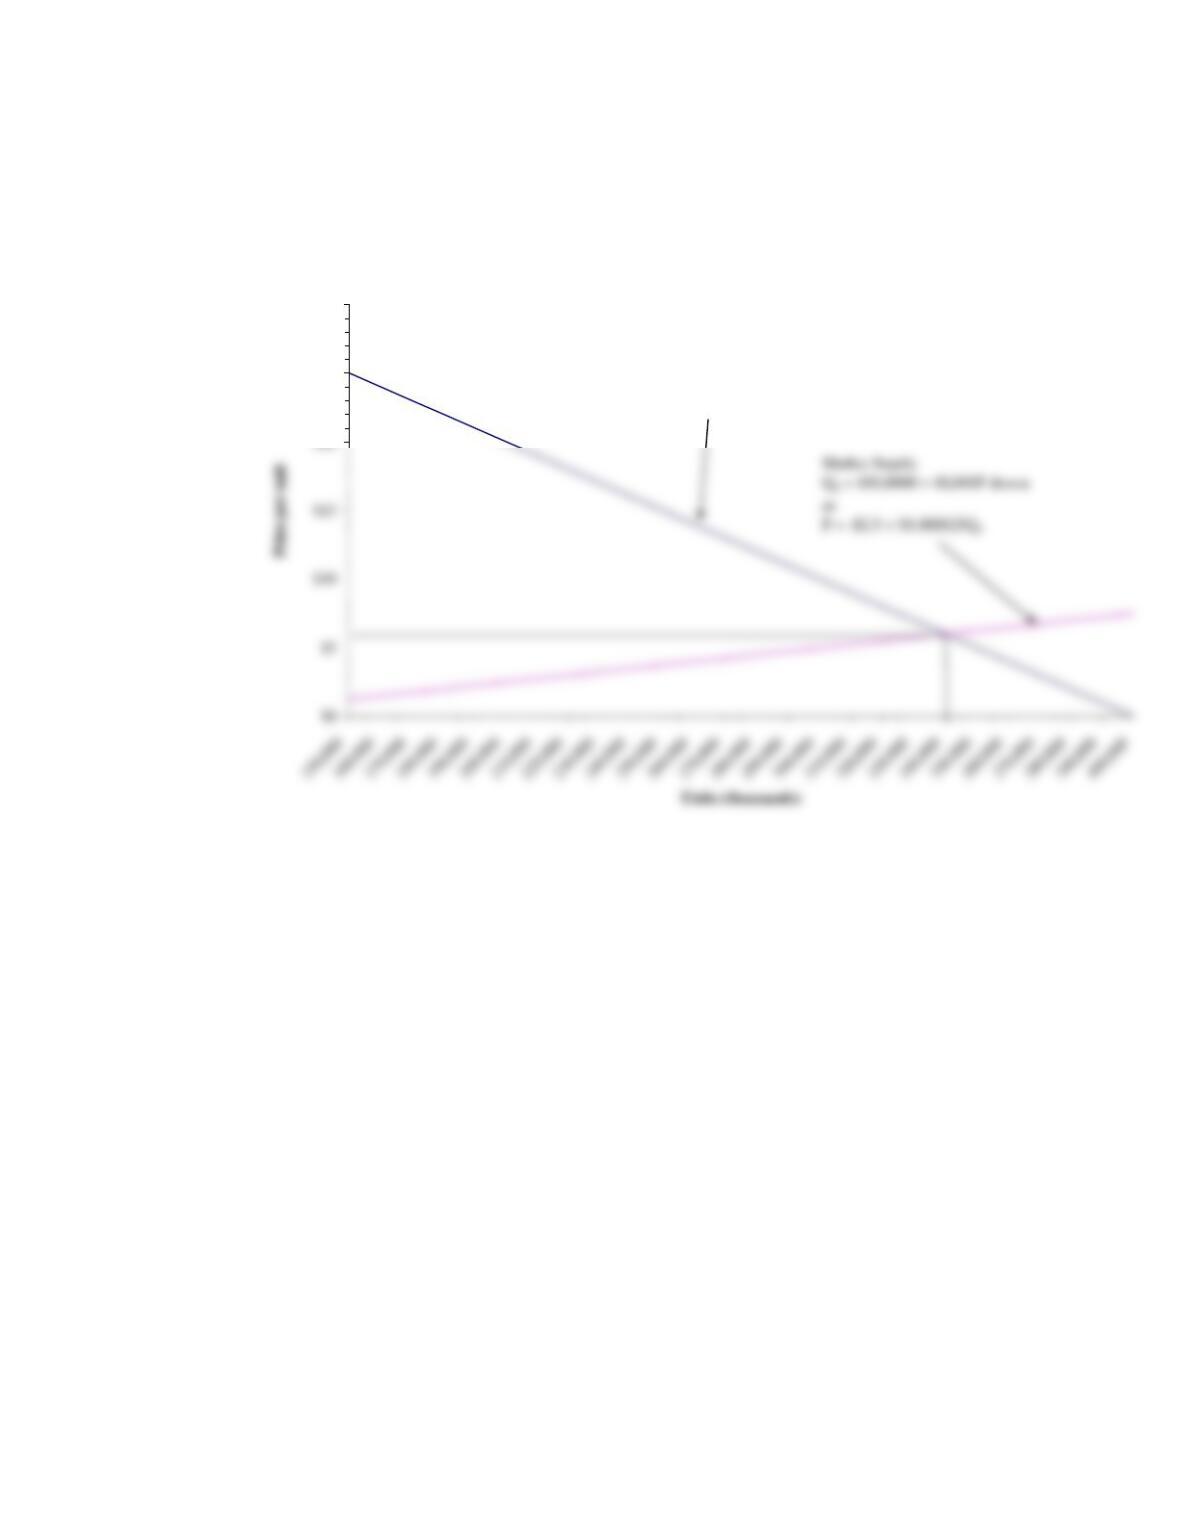
300 Chapter 10
Market Equilibrium
$20
$25
$30
Market Demand
QD = 400,0000 – 10,000P drawn as
P = $40 – 0.0001QD
PROBLEMS AND SOLUTIONS
P10.1 Competitive Markets Concepts. Indicate whether each of the following statements is
true or false, and explain why.
A. In long-run equilibrium, every firm in a perfectly competitive industry earns zero
profit.
B. Perfect competition exists in a market when all firms are price takers as opposed
to price makers.
C. In competitive markets, P > MC at the profit-maximizing output level.
D. Downward-sloping industry demand curves characterize perfectly competitive
markets.
E. A firm might show accounting profits in a competitive market but be suffering
economic losses.
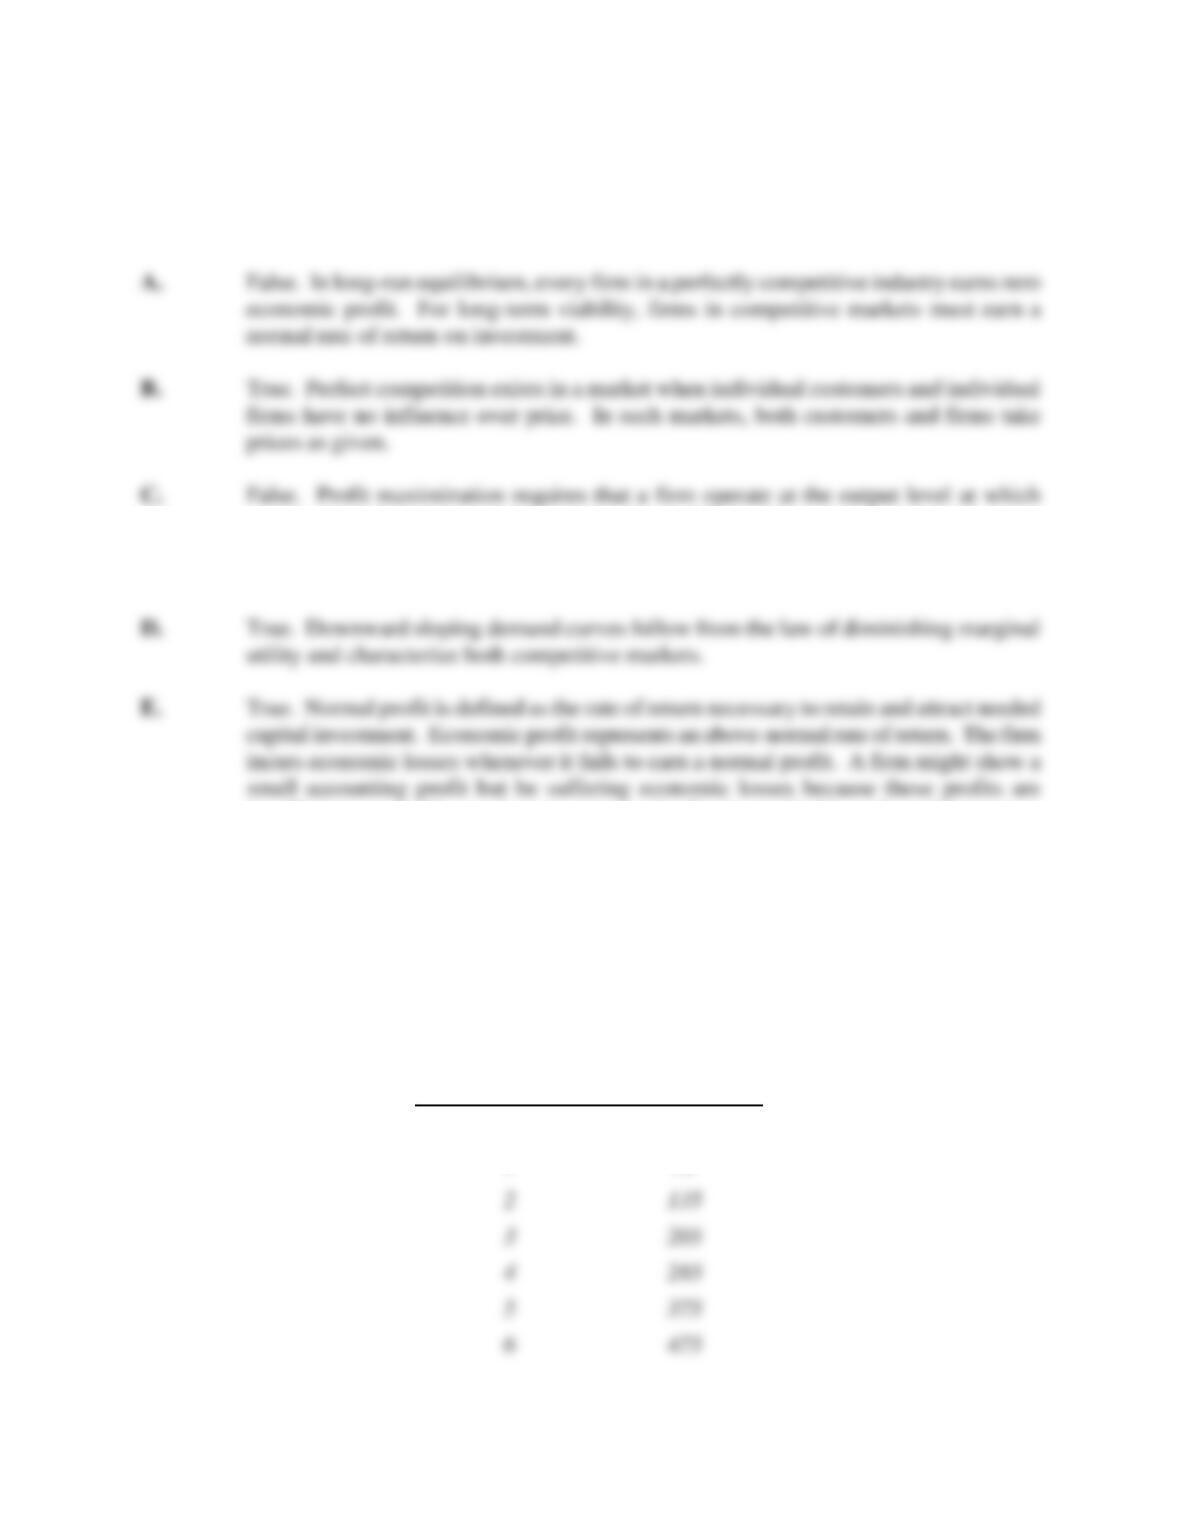
Competitive Markets 301
P10.1 SOLUTION
marginal revenue and marginal cost are equal. With price constant, average revenue
equals marginal revenue. Therefore, maximum profits result when market price is set
equal to marginal cost for firms in a perfectly competitive industry
insufficient to provide an adequate return to the firm’s stockholders. In such instances,
firms are unable to replace plant and equipment and will exit the industry in the long
run.
P10.2 Short-run Firm Supply. Mankato Paper, Inc., produces uncoated paper used in a wide
variety of industrial applications. Newsprint, a major product, is sold in a perfectly
competitive market. The following relation exists between the firm’s newsprint output
and total production costs:
Total Output
(tons)
Total Cost
0
$25
1
75
2
3
4
5
302 Chapter 10
Total Output
(tons)
Total Cost
7
600
A. Construct a table showing Mankato’s marginal cost of newsprint production.
B. What is the minimum price necessary for Mankato to supply one ton of newsprint?
C. How much newsprint would Mankato supply at industry prices of $75 and $100
per ton?
P10.2 SOLUTION
A.
Total
Output
Total
Cost
Marginal
Cost
0
$25
—
C. In a perfectly competitive market, P = MR. Therefore, Mankato will supply output so
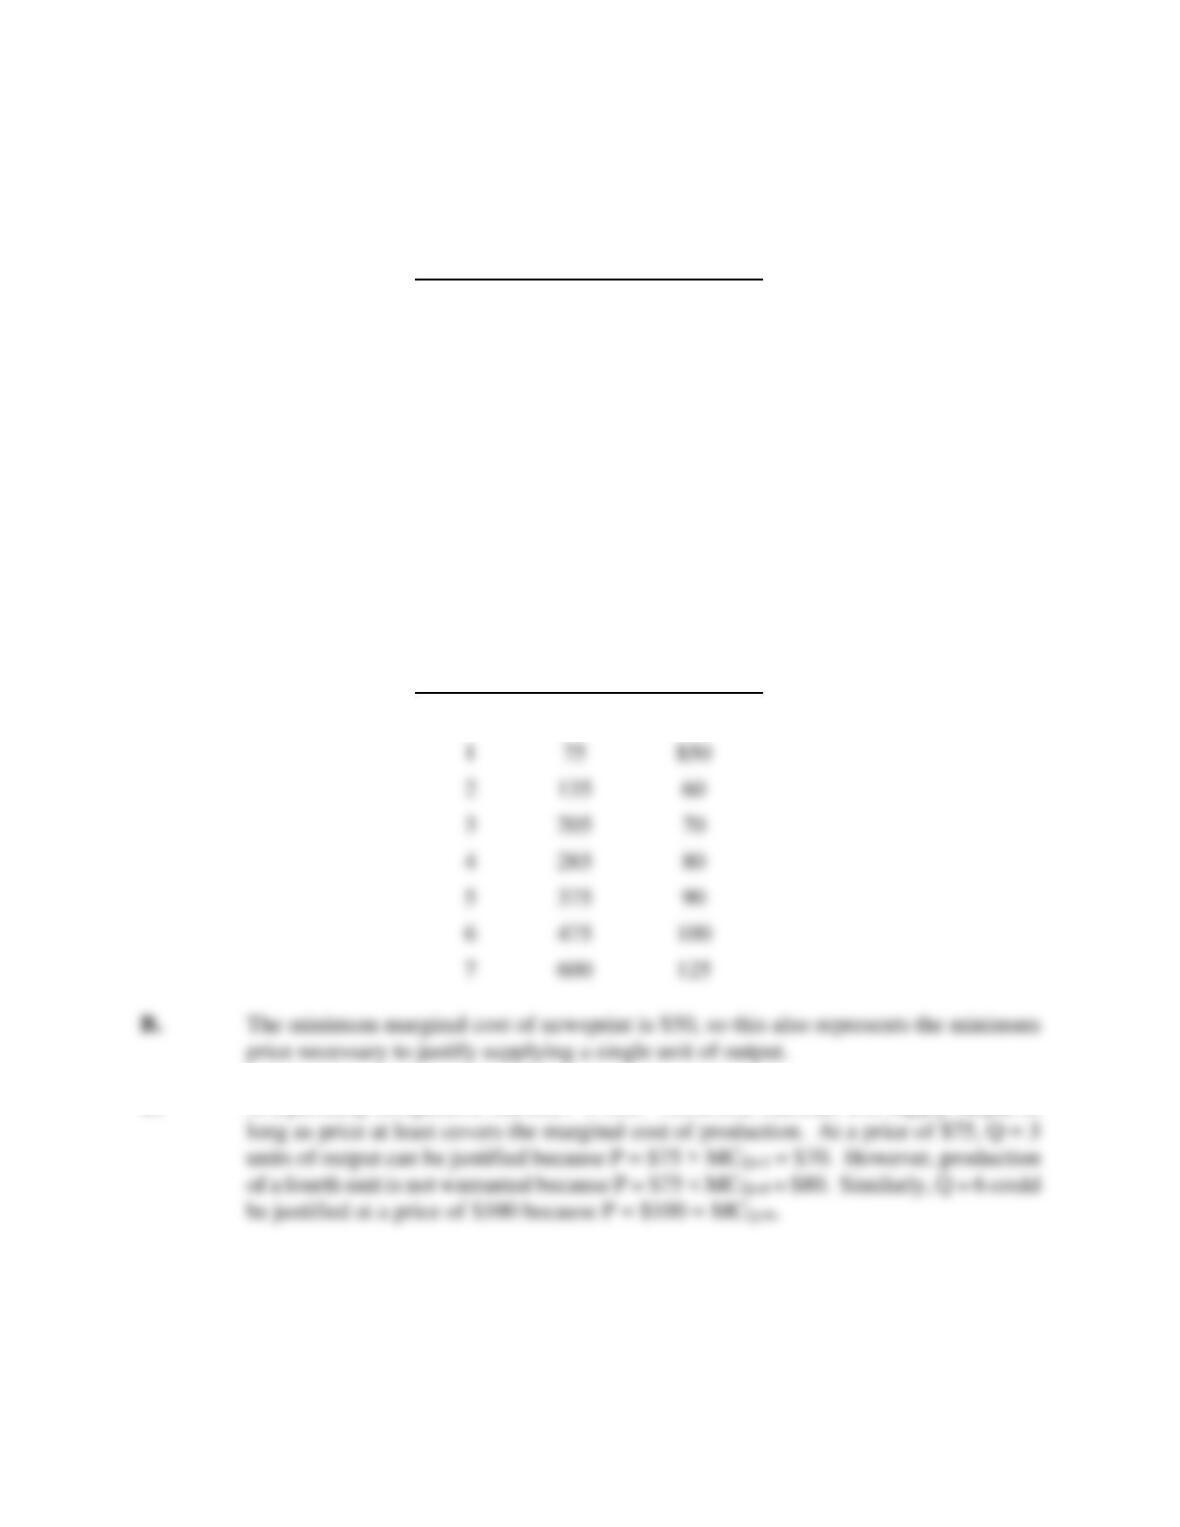
P10.3 Short-run Firm Supply. Florida is the biggest sugar-producing state, but Michigan and
Minnesota are home to thousands of sugar beet growers. Sugar prices in the United
States average about 20¢ per pound, or more than double the world-wide average of
less than 10¢ per pound given import quotas that restrict imports to about 15% of the
U.S. market. Still, the industry is perfectly competitive for U.S. growers who take the
1
2
135
3
205
4
285
5
375
6
475
7
600
Competitive Markets 303
market price of 20¢ as fixed. Thus, P = MR = 20¢ in the U.S. sugar market. Assume
that a typical sugar grower has fixed costs of $30,000 per year. Total variable cost
(TVC), total cost (TC), and marginal cost (MC) relations are:
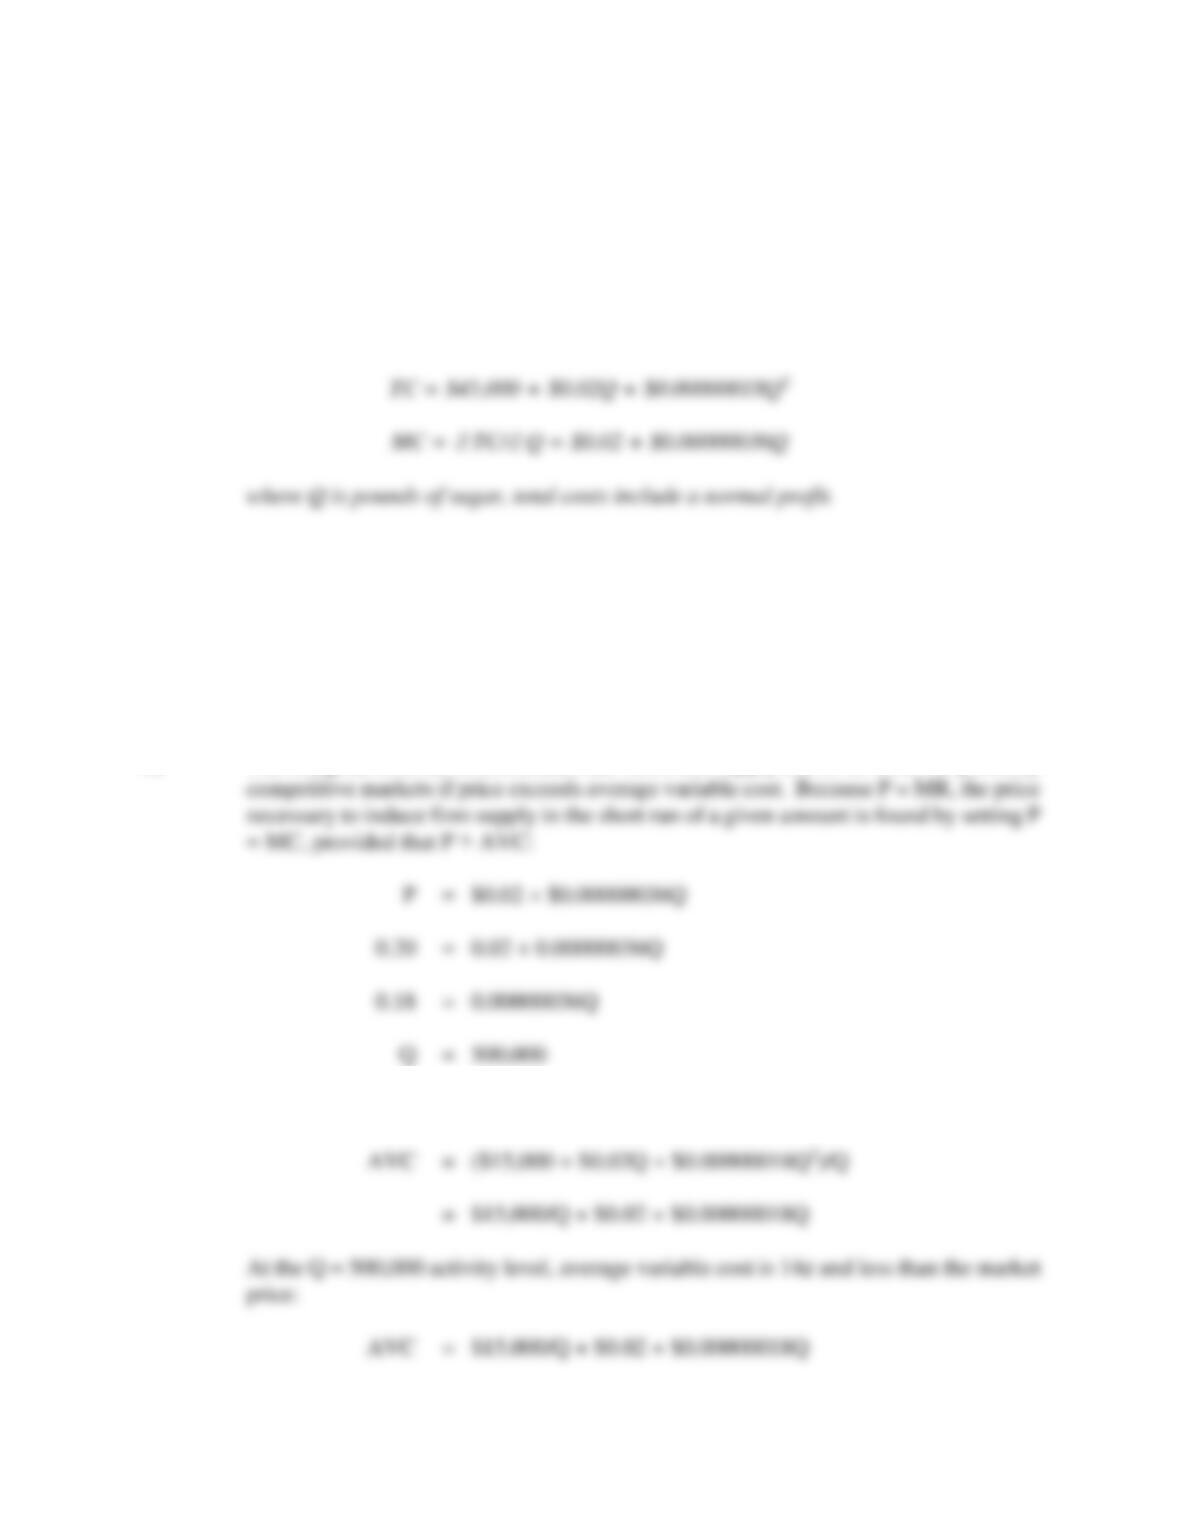
TVC = $15,000 + $0.02Q + $0.00000018Q2
A. Using the firm’s marginal cost curve, calculate the profit-maximizing short-run
supply curve for a typical grower.
B. Calculate the average variable cost curve for a typical grower, and verify that
average variable costs are less than price at this optimal activity level.
P10.3 SOLUTION
A. The marginal cost curve constitutes the short-run supply curve for firms in perfectly
B. The average variable cost curve is determined by dividing total variable cost by output: