Mishkin • Instructor’s Manual for The Economics of Money, Banking, and Financial Markets, Twelfth Edition 127
Chapter 10
ANSWERS TO QUESTIONS
1. Why are deposit insurance and other types of government safety nets important to the health
of the economy?
A government safety net can short-circuit runs on banks and bank panics, and overcome
2. If casualty insurance companies provided fire insurance without any restrictions, what kind
of adverse selection and moral hazard problems might result?
3. Do you think that eliminating or limiting the amount of deposit insurance would be a good
idea? Explain your answer.
4. How could higher deposit insurance premiums for banks with riskier assets benefit the
economy?
5. What are the costs and benefits of a too-big-to-fail policy?
6. Suppose that you have $300,000 in deposits at a bank. After careful consideration, the FDIC
decides that this bank is now insolvent. Which method would you like to see the FDIC apply?
What if your deposit were $200,000?
If you have deposited $300,000 at the failed bank, it would be better for you if the FDIC uses
7. Would you recommend the adoption of a system of deposit insurance, like the FDIC in the
United States, in a country with weak institutions, prevalent corruption, and ineffective
regulation of the financial sector?
You probably would not recommend the adoption of a system of deposit insurance in a
country with weak institutions, prevalent corruption and ineffective regulation of the
8. At the height of the global financial crisis in October 2008, the U.S. Treasury forced nine of
the largest U.S. banks to accept capital injections in exchange for nonvoting ownership
stock, even though some of the banks did not need the capital and did not want to participate.
What could be the Treasury’s rationale for doing this?
If the banks that did not need or want the capital injections were not forced to take the
capital, then only the weakest banks would be the ones that would have received the needed
9. What special problem do off-balance-sheet activities present to bank regulators, and what
have they done about it?
Because off-balance-sheet activities do not appear on bank balance sheets, they cannot be
dealt with by simple bank capital requirements, which are based on bank assets, such as a
10. What are some of the limitations to the Basel and Basel 2 Accords? How does the Basel 3
Accord attempt to address these limitations?
The original Basel Accord takes into account the riskiness of capital, but in practice, the risk
weights can differ substantially from the actual risk the bank faces. The Basel 2 Accords
were created to address this limitation; however, addressing these shortfalls greatly increased
11. How does bank chartering reduce adverse selection problems? Does it always work?
12. Why has the trend in bank supervision moved away from a focus on capital requirements to a
focus on risk management?
With the advent of new financial instruments, a bank that is quite healthy at a particular point
in time can be driven into insolvency extremely rapidly from risky trading in these
13. Suppose that after a few mergers and acquisitions, only one bank holds 70% of all deposits
in the United States. Would you say that this bank would be considered too big to fail? What
does this tell you about the ongoing process of financial consolidation and the government
safety net?
If only one bank holds 70% of all deposits in the United States, it would be a financial
catastrophe if this institution fails. We can expect that the FDIC and any other competent
14. Suppose Universal Bank holds $100 million in assets, which are composed of the following:
Required reserves: $10 million
Excess
reserves: $ 5 million
a. Do you think it is a good idea for Universal Bank to hold stocks, corporate bonds, and
commodities as assets? Why or why not?
Probably not. Since these assets are relatively high risk, the bank is subject to fluctuations
in the values of these assets, which can be substantial. This could result in a significant
b. If the housing market suddenly crashed, would Universal Bank be better off using a
mark-to-market accounting system or the historical-cost system?
If the housing market crashed, it is likely that many of the mortgage loans would default,
and the value of collateral on those loans (the market price of the house) would decline
dramatically. If the collateral from the nonperforming loans were valued at historical
c. If the price of commodities suddenly increased sharply, would Universal Bank be better
off using a mark-to-market accounting system or the historical-cost system?
If the price of commodities spiked, this would lead to a significant increase in the value
of the bank’s assets. In this case, using a mark-to-market valuation would be better. The
d. What do your answers to parts (b) and (c) tell you about the tradeoffs between the two
accounting systems?
Although mark-to-market rules can be more efficient in that they generally provide a more
accurate picture of a bank’s capital position, in severe downturns such as the one
15. Why might more competition in financial markets be a bad idea? Would restrictions on
competition be a better idea? Why or why not?
16. In what way might consumer protection regulations negatively affect a financial
intermediary’s profits? Can you think of a positive effect of such regulations on profits?
Consumer protection regulations in general make sure that all relevant information is
disclosed to potential borrowers (including costs and conditions of loans) and forbid
ANSWERS TO APPLIED PROBLEMS
17. Consider a failing bank. A deposit of $350,000 is worth how much to the depositor if the
FDIC uses the payoff method given the typical recovery rate? How much is the same deposit
worth to the depositor if the purchase-and-assumption method is used? Which is more costly
to taxpayers?
Under the payoff method, the depositor only gets around $0.90/dollar on the amount of the
deposit above $250,000. Hence, the $350,000 is worth only $340,000 ($250,000 + $100,000
18. Consider a bank with the following balance sheet:
Assets Liabilities
Required reserves $17 million Checkable deposits $205 million
Excess reserves $3 million Bank capital $10 million

19. Oldhat Financial starts its first day of operations with $9 million in capital. A total of $130
million in checkable deposits is received. The bank makes a $25 million commercial loan and
another $50 million in mortgages with the following terms: 200 standard, 30-year, fixed-rate
mortgages with a nominal annual rate of 5.25%, each for $250,000.
Assume that required reserves are 8%.
a. What does the bank balance sheet look like?
b. How well capitalized is the bank?
c. Calculate the risk-weighted assets and risk-weighted capital ratio after Oldhat’s first day.
a.
Assets Liabilities
Required Reserves $10.4 million Checkable Deposits $130 million
20. Early the next day, the bank invests $50 million of its excess reserves in commercial loans.
Later that day, terrible news hits the mortgage markets, and mortgage rates jump to 13%,
implying a present value of Oldhat’s current mortgage holdings of $124,798 per mortgage.
Bank regulators force Oldhat to sell its mortgages to recognize the fair market value. What
does Oldhat’s balance sheet look like? How do these events affect its capital position?
Mishkin • Instructor’s Manual for The Economics of Money, Banking, and Financial Markets, Twelfth Edition 133
The sale of each mortgage would be recorded as:
Debit Credit
After the fact, the actual balance sheet is:
Assets Liabilities
Required Reserves $10.4 million Checkable Deposits $130 million
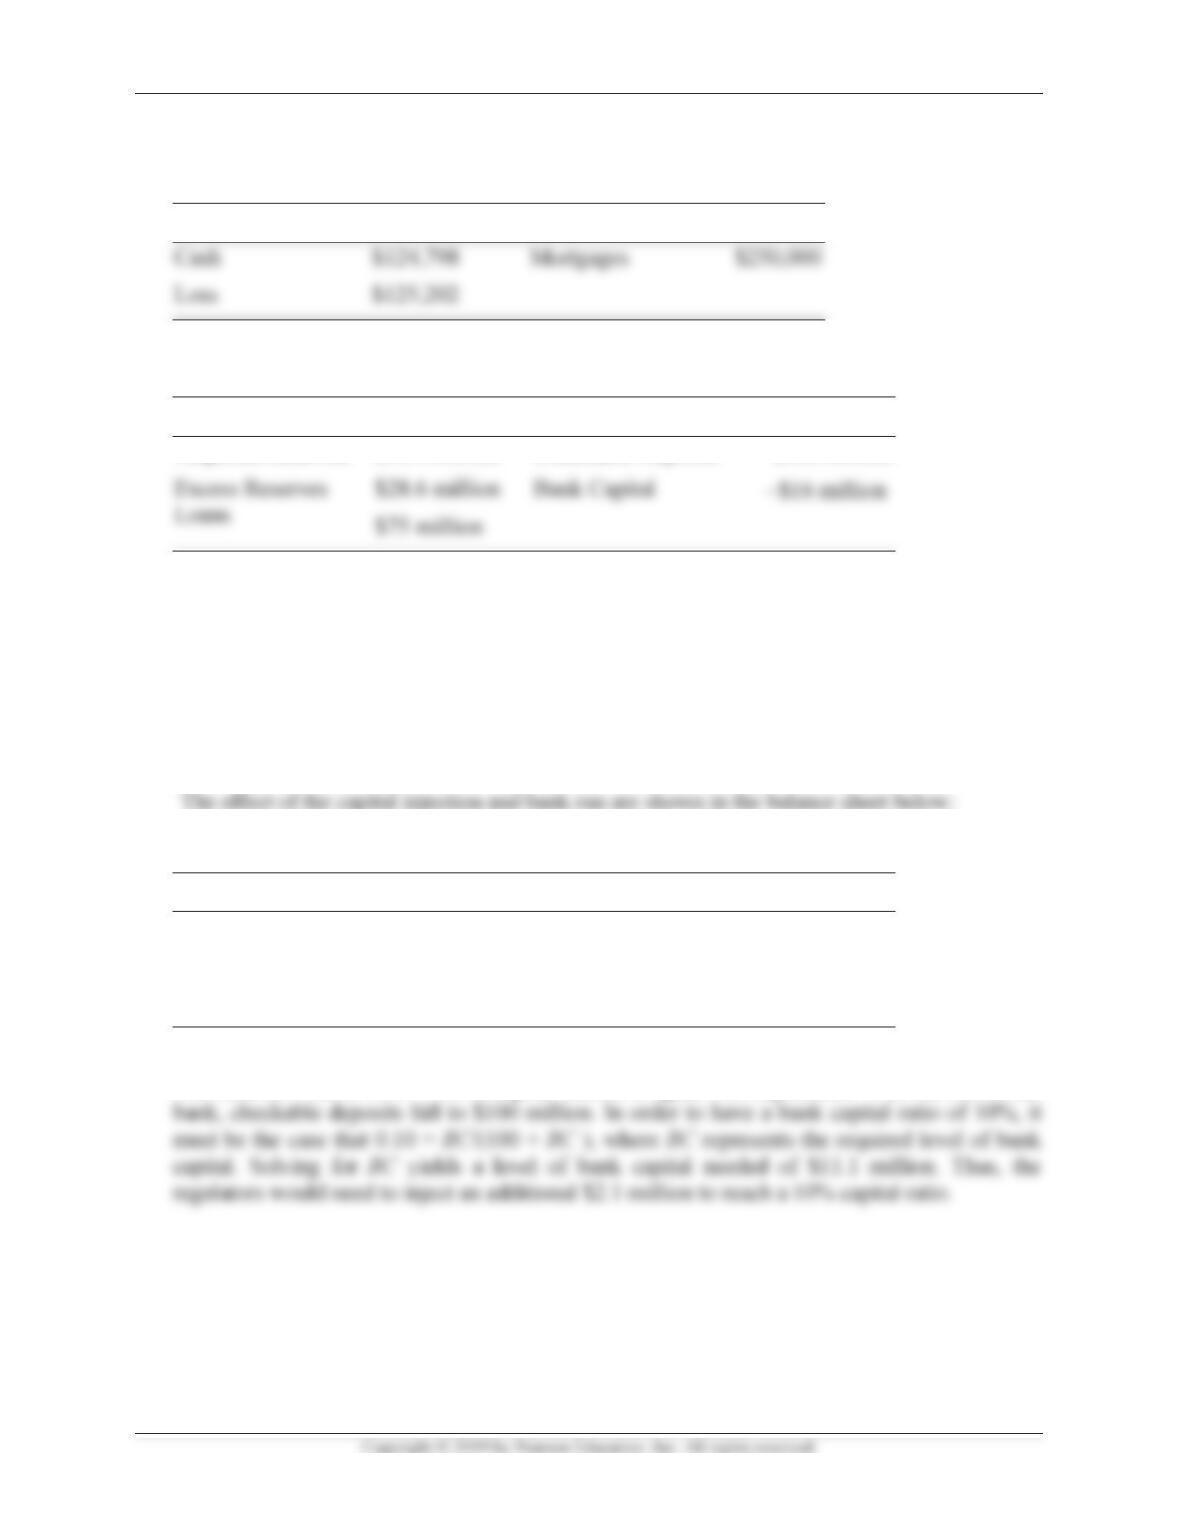
21. To avoid insolvency, regulators decide to provide the bank with $25 million in bank capital.
However, the bad news about the mortgages is featured in the local newspaper, causing a
bank run. As a result, $30 million in deposits is withdrawn. Show the effects of the capital
injection and the bank run on the balance sheet. Was the capital injection enough to stabilize
the bank? If the bank regulators decide that the bank needs a capital ratio of 10% to prevent
further runs on the bank, how much of an additional capital injection is required to reach a
10% capital ratio?
22.
Assets Liabilities
Required Reserves $ 8 million Checkable Deposits $100 million
Excess Reserves
Loans
$26 million
$75 million
Bank Capital $ 9 million
The bank now has a 9/109 = 8.3% capital ratio; it is again well capitalized. With the run on the
Mishkin • Instructor’s Manual for The Economics of Money, Banking, and Financial Markets, Twelfth Edition 134
ANSWERS TO DATA ANALYSIS PROBLEMS
1. Go to the St. Louis Federal Reserve FRED database and find data on the number of
commercial banks in the United States in each of the following categories: average assets
less than $100 million (US100NUM), average assets between $100 million and $300 million
(US13NUM), average assets between $300 million and $1 billion (US31NUM), average
assets between $1 billion and $15 billion (US115NUM), and average assets greater than $15
billion (USG15NUM). Download the data into a spreadsheet. Calculate the percentage of
banks in the smallest (less than $100 million) and largest (greater than $15 billion)
categories, as a percentage of the total number of banks, for the most recent quarter of data
available and for 1990:Q1. What has happened to the proportion of very large banks? What
has happened to the proportion of very small banks? What does this say about the “too-big-
to-fail” problem and moral hazard?
In 1990:Q1, there were 25 ‘very large’ banks, and 9,529 ‘very small’ banks, representing
0.2% and 76.5% of total commercial banks in the United States, respectively. For the most
recent quarter of 2017:Q1, there were 77 ‘very large’ banks, and 1,324 ‘very small’ banks,
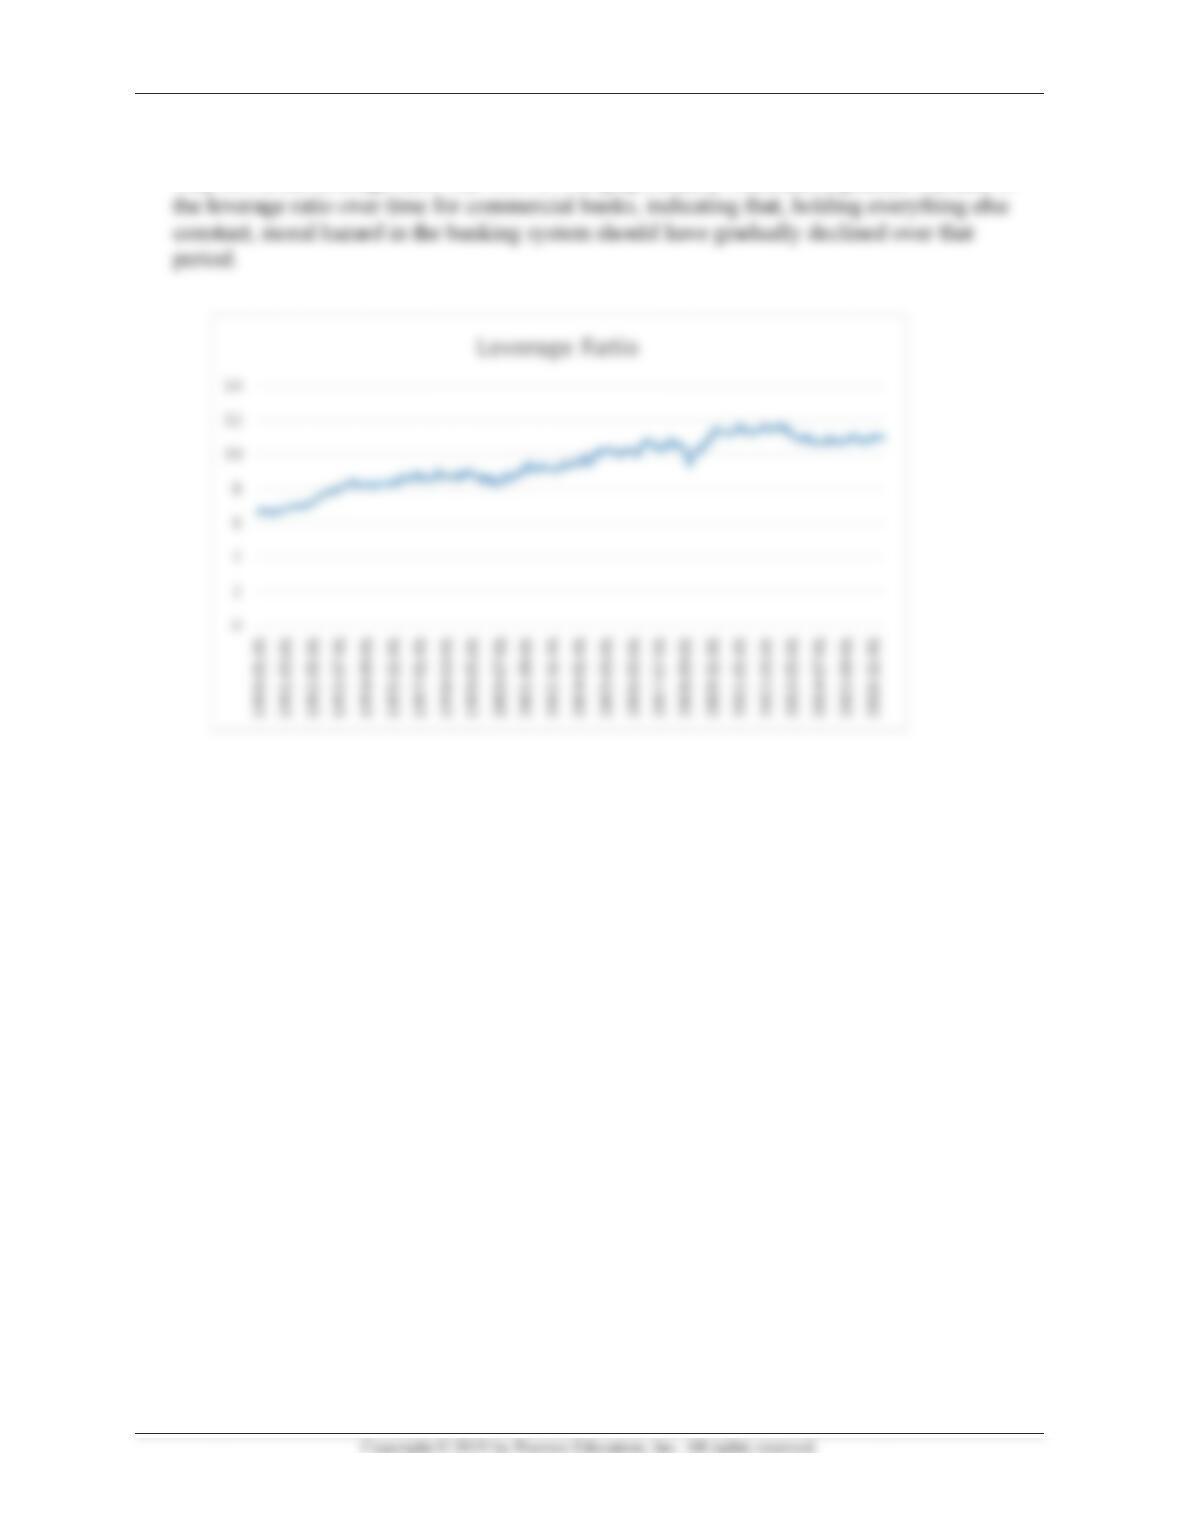
2. Go to the St. Louis Federal Reserve FRED database and find data on the residual of assets
less liabilities, or bank capital (RALACBM027SBOG), and total assets of commercial banks
(TLAACBM027SBOG). Download the data from January 1990 through the most recent
month available into a spreadsheet. For each monthly observation, calculate the bank
leverage ratio as the ratio of bank capital to total assets. Create a line graph of the leverage
ratio over time. All else being equal, what can you conclude about leverage and moral
hazard in commercial banks over time?
Mishkin •
See
g
May
I
nstructor’s Ma
n
g
raph below
.
2017, the le
v
n
ual for The Ec
o
.
In January
v
erage ratio
o
nomics of Mon
e
1990, the le
v
was 10.9%
.
e
y, Banking, an
d
v
erage ratio
The graph
c
d
Financial Mar
k
was 6.6%,
a
c
learly illus
t
k
ets, Twelfth E
d
a
nd the mos
t
t
rates a grad
u
d
ition
t
recent mo
n
u
al increase
135
n
th of
in