Chapter 10
Real GDP and the Price Level in the Long Run
◼ Overview
This chapter introduces the concepts of aggregate demand (AD) and long-run aggregate supply (LRAS).
It shows how economic growth can be illustrated by the use of the LRAS. Both LRAS and AD are used
extensively in later chapters. Aggregate demand and long-run aggregate supply curves are derived. They
are used to identify the long-run equilibrium price level and equilibrium real GDP. Why each curve shifts
is then discussed, and the effect of these shifts on macroeconomic equilibrium is shown. Finally, the
model is used to explain both inflation and deflation.
◼ Learning Objectives
After studying this chapter, students should be able to:
• 10.1 Discuss the concept of long-run aggregate supply and describe the effect of economic growth on
the long-run aggregate supply curve
◼ Outline
I. Output Growth and the Long-Run Aggregate Supply Curve: The total of all planned production
for the entire economy is referred to as the aggregate supply of real output.
A. The Long-Run Aggregate Supply Curve: The long-run aggregate supply curve (LRAS) is
some amount of output of real goods and services in a world in which technology is constant,
the price level has not changed, labor productivity has not changed, all resources are fully
employed, and people have fully adjusted to all the information they have.
1. The LRAS Curve and Full-Employment Real GDP: The LRAS is related to the full-
employment level of real GDP, or the natural rate of unemployment.
B. Economic Growth and Long-Run Aggregate Supply: Economic growth is shown by the
outward shifting of the production possibilities curve or as the LRAS curve shifting to the right
over time. A long-run growth or trend path can be derived showing real GDP at full
employment over time. (See Figures 10-2 and 10-3.)
144 Miller • Economics Today, Nineteenth Edition
II. Total Expenditures and Aggregate Demand: The spending decisions of individuals, firms,
governments, and foreigners determine the total value of nominal GDP. Two issues need to be
addressed. The first issue is what determines the total amount that individuals, governments,
businesses, and foreigners want to spend? Second, what determines the equilibrium price level
and the rate of inflation? The total of all planned expenditures in the entire economy is called
aggregate demand.
A. The Importance of Spending Decisions for the level of Real GDP
B. The Aggregate Demand Curve: The aggregate demand curve shows planned purchase rates
for all final goods and services in the economy at various price levels, other things held constant.
1. Depicting the Aggregate Demand Curve (See Figure 10-4.)
2. Planned Spending in the U.S. Economy (See Figure 10-4.)
C. What Happens When the Price Level Rises?
1. The Real-Balance Effect: The change in expenditures resulting from the real value of
money balances when the price level changes. A rise in the price level decreases the real
value of a given amount of money balances, and so planned spending will decrease.
real value of the existing cash balance.
2. The Interest Rate Effect: Higher prices result in a rising interest rate. Households spend
3. The Open Economy Effect: The Substitution of Foreign Goods: An increase in the
aggregate quantity of U.S. produced goods and services demanded falls.
D. What Happens When the Price Level Falls? The same three effects occur when the price
level falls as when it rises; they just have the reverse effect on the aggregate quantity of goods
and services demanded.
E. Demand for All Goods and Services versus Demand for a Single Good or Service: When
F. Shifts in the Aggregate Demand Curve: When non-price level determinants of aggregate
III. Long-Run Equilibrium and the Price Level: Long-run equilibrium occurs at the intersection of
the aggregate demand and the long-run aggregate supply curve. At this point, planned real
expenditures for the entire economy equal actual full employment real GDP produced by firms.
(See Figure 10-5.)
A. The Long-Run Equilibrium Price Level: The economy’s long-run equilibrium price level
occurs at the point at which the aggregate demand curve crosses the long-run aggregate supply
curve. (See Figure 10-5.)
Chapter 10 Real GDP and the Price Level in the Long Run 145
B. The Effects of Economic Growth on the Price Level
1. Economic Growth and Secular Deflation: If all factors that affect total planned real
2. Secular Deflation in the United States: Between 1872 and 1894, the price level in the
IV. Causes of Inflation: The United States has experienced secular inflation. (See Figure 10-7.)
A. Supply-Side Inflation? Inflation could be caused by a decrease in aggregate supply with a
B. Demand-Side Inflation: If the aggregate demand curve shifts rightward over time at a pace
◼ Points to Emphasize
Planned Values versus Actual Values
It is important to emphasize that aggregate demand represents total planned expenditures in the economy
on domestically produced goods at different price levels and that aggregate supply is total planned production
Real Balance Effect
This effect of a change in the price level on planned expenditures through the decline in the purchasing
power of money is similar to the income effect associated with a price change in the model of demand.
Changes in the Price Level/Changes in Non-Price-Level Factors
The idea of moving along a curve and a shift of the curve is often difficult for students to grasp. Emphasize
the difference between an increase in planned expenditures that occurs because the price level falls (a
Long-Run Aggregate Supply
The long-run aggregate supply concept is easy for students to grasp when it is presented simply as full–
employment real GDP with no other conditions or explanation given. The idea of long-run aggregate
supply as the level of real GDP that exists in the stationary state after all adjustments to any disturbances
146 Miller • Economics Today, Nineteenth Edition
◼ For Those Who Wish to Stress Theory
The Real Balance Effect
In order to explain the negatively sloped aggregate demand curve using the real balance effect, try the
following approach. Suppose a person owns $100 worth of real estate, a $100 corporate (not U.S.) bond,
and a $100 bill. What happens if the price level falls to one-thousandth of its previous value? Assume that
all prices fall at the same rate, which is how this analysis is usually conducted.
2. The person is better off because a bond is a monetary asset; the coupon payment on the bond is
3. The $100 bill is now worth $100,000. A person is better off because he or she can now buy
The fact is that all monetary assets are corresponding liabilities for others. This is true for money itself,
Secular Inflation
Secular inflation can only occur if aggregate demand increases faster than aggregate supply in an
economy in which the resource base is growing and technology is improving. Because the private sector
Secular Deflation
Secular deflation brings its own problems to the economy. As the value of money rises, the real cost
Chapter 10 Real GDP and the Price Level in the Long Run 147
◼ Further Questions for Class Discussion
1. As the price level rises, the aggregate quantity of real goods and services demanded declines due
to the open economy effect. Ask students why the AD curve slopes downward in this case. After all,
while foreigners buy fewer U.S. produced goods, Americans buy more foreign goods, so that total
2. What kinds of government policies could discourage economic growth by reducing the rate at
which the LRAS curve shifts to the right? Because the LRAS curve depends on the quantity of
3. Why is a stable price level likely to increase the rate of economic growth? A stable price level tends
4. In what ways might deflation affect an individual’s well-being? For persons who are creditors,
5. Inflation has been a macroeconomic issue since the 1950s. It has varied from year to year, but
the overall trend of the price level has been up for every year since 1950. What has likely been the
cause of this long-term (secular) inflation? Increases in the money supply have caused aggregate
6. By 2008, the foreign exchange rate of the dollar had dropped against almost every major currency
in the world. Despite a financial crisis and a crash in the U.S. housing market (a major decrease
◼ Answers to Questions for Critical Analysis
China’s Long String of Rightward Shifts in Its LRAS Curve (p. 215)
Has China’s production possibilities curve been shifting outward or inward over the past 40 years?
Explain your answer.
Does the “Sentiment” of Consumers Generate Aggregate Demand Shifts?
(pp. 219−220)
Why do you suppose that economists generally are more interested in the Index of Consumer
Sentiment’s validity than they are in its reliability as a predictor?
Inferring That South African Aggregate Demand Dropped after 2008 (pp. 224)
What would happen to the South African inflation rate in future years if the AD curve were to
begin shifting rightward at a more rapid pace than the LRAS curve?
◼ You Are There
Watching a Crumbling U.S. River System Impede Growth of Aggregate
Supply (p. 225)
1. As more of the nation’s systems of river locks become deficient, what is happening to the pace
at which the U.S. production possibilities curve shifts outward over time?
2. How are deficiencies in the U.S. river system affecting the extent to which the U.S. long-run
aggregate supply come shifts rightward each year?
Chapter 10 Real GDP and the Price Level in the Long Run 149
◼ Issues and Applications
The Implications of U.S. Secular Stagnation for Real GDP and the Price Level
(pp. 226–227)
1. How could a return of the U.S. population growth rate to its previous level reduce the
disinflationary effect of secular stagnation?
2. Why might a return of the U.S. population growth rate to its prior level also tend to boost
growth of U.S. long-run aggregate supply? (Hint: Recall that real GDP growth is generated
by the contributions of growth in labor and capital and growth in productivity of these
resources.)?
◼ Research Project
1. To read a “simple guide” to the interaction between secular stagnation and inflation, see the
◼ Answers to Problems
10-1. Many economists view the natural rate of unemployment as the level observed when real
GDP is given by the position of the long-run aggregate supply curve. How can there be
positive unemployment in this situation?
10-2. Suppose that the long-run aggregate supply curve is positioned at a real GDP level of
$18 trillion in base-year dollars, and the long-run equilibrium price level (in index
number form) is 115. What is the full-employment level of nominal GDP?
10-3. Continuing from Problem 10-2, suppose that the full-employment level of nominal GDP
in the following year rises to $21.85 trillion. The long-run equilibrium price level, however,
remains unchanged. By how much (in real dollars) has the long-run aggregate supply curve
shifted to the right in the following year? By how much, if any, has the aggregate demand
curve shifted to the right? (Hint: The equilibrium price level can stay the same only if LRAS
and AD shift rightward by the same amount.)
10-4. Suppose that the position of a nation’s long-run aggregate supply curve has not changed,
but its long-run equilibrium price level has increased. Which of the following factors might
account for this event?
a. A rise in the value of the domestic currency relative to other world currencies
b. An increase in the quantity of money in circulation
c. An increase in the labor force participation rate
d. A decrease in taxes
e. A rise in real incomes of countries that are key trading partners of this nation
f. Increased long-run economic growth
10-5. Identify the combined shifts in long-run aggregate supply and aggregate demand that could
explain the following simultaneous occurrences.
a. An increase in equilibrium real GDP and an increase in the equilibrium price level
b. A decrease in equilibrium real GDP with no change in the equilibrium price level
c. An increase in equilibrium real GDP with no change in the equilibrium price level
d. A decrease in equilibrium real GDP and a decrease in the equilibrium price level
10-6. Suppose that during the past 3 years, equilibrium real GDP in a country rose steadily, from
$450 billion to $500 billion, but even though the position of its aggregate demand curve
remained unchanged, its equilibrium price level steadily declined, from 110 to 103. What
could have accounted for these outcomes, and what is the term for the change in the price
level experienced by this country?
10-7. Suppose that during a given year, the quantity of U.S. real GDP that can be produced in the
long run rises from $17.9 trillion to $18.0 trillion, measured in base-year dollars. During the
year, no change occurs in the various factors that influence aggregate demand. What will
happen to the U.S. long-run equilibrium price level during this particular year?
10-8. Assume that the position of a nation’s aggregate demand curve has not changed, but the
long-run equilibrium price level has declined. Other things being equal, which of the
following factors might account for this event?
a. An increase in labor productivity
b. A decrease in the capital stock
Chapter 10 Real GDP and the Price Level in the Long Run 151
c. A decrease in the quantity of money in circulation
e. The discovery of new mineral resources used to produce various goods
f. A technological improvement
10-9. Suppose that there is a sudden rise in the price level. What will happen to economywide
planned spending on purchases of goods and services? Why?
10-10. Assume that the economy is in long-run equilibrium with complete information and that
input prices adjust rapidly to changes in the prices of goods and services. If there is a rise in
the price level induced by an increase in aggregate demand, what happens to real GDP?
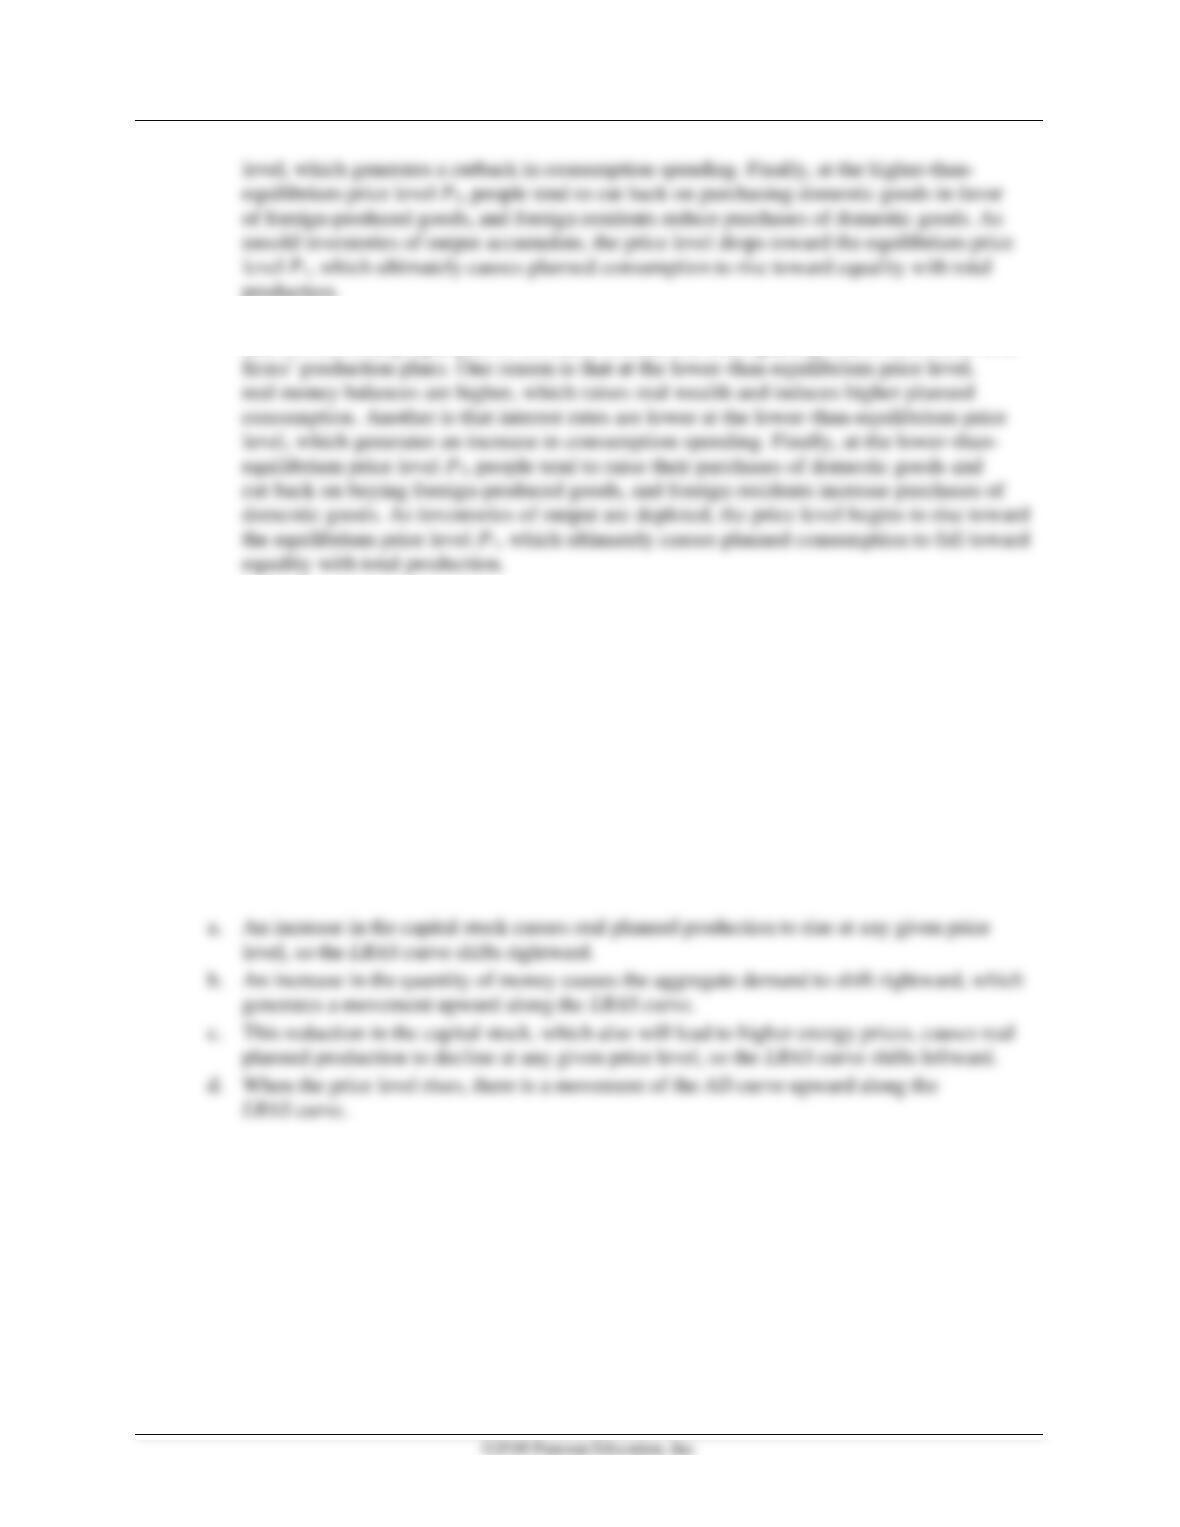
10-11. Consider the diagram below when answering the questions that follow.
a. Suppose that the current price level is P2. Explain why the price level will decline
toward P1.
b. Suppose that the current price level is P3. Explain why the price level will rise toward P1.
a. At the price level P2 above the equilibrium price level P1, the total quantity of real goods
152 Miller • Economics Today, Nineteenth Edition
production.
b. At the price level P3 below the equilibrium price level P1, the total quantity of real goods
and services that people plan to consume exceeds the total quantity that is consistent with
10-12. Explain whether each of the following events would cause a movement along or a shift in
the position of the LRAS curve, other things being equal. In each case, explain the direction
of the movement along the curve or shift in its position.
a. Last year, businesses invested in new capital equipment, so this year the nation’s capital
stock is higher than it was last year.
b. There has been an 8 percent increase in the quantity of money in circulation that has
shifted the AD curve.
c. A hurricane of unprecedented strength has damaged oil rigs, factories, and ports all
along the nation’s coast.
d. Inflation has occurred during the past year as a result of rightward shifts of the
AD curve.
10-13. Explain whether each of the following events would cause a movement along or a shift in
the AD curve, other things being equal. In each case, explain the direction of the movement
along the curve or shift in its position.
a. Deflation has occurred during the past year.
b. Real GDP levels of all the nation’s major trading partners have declined.
c. There has been a decline in the foreign exchange value of the nation’s currency.
d. The price level has increased this year.
Chapter 10 Real GDP and the Price Level in the Long Run 153
10-14. This year, a nation’s long–run equilibrium real GDP and price level both increased. Which of
the following combinations of factors might simultaneously account for both occurrences?
a. An isolated earthquake at the beginning of the year destroyed part of the nation’s
capital stock, and the nation’s government significantly reduced its purchases of goods
and services.
b. There was a technological improvement at the end of the previous year, and the
quantity of money in circulation rose significantly during the year.
c. Labor productivity increased throughout the year, and consumers significantly
increased their total planned purchases of goods and services.
d. The capital stock increased somewhat during the year, and the quantity of money in
circulation declined considerably.
10-15. Explain how, if at all, each of the following events would affect equilibrium real GDP and
the long-run equilibrium price level.
a. A reduction in the quantity of money in circulation
b. An income tax rebate (the return of previously paid taxes) from the government to
households, which they can apply only to purchases of goods and services
c. A technological improvement
d. A decrease in the value of the home currency in terms of the currencies of other nations
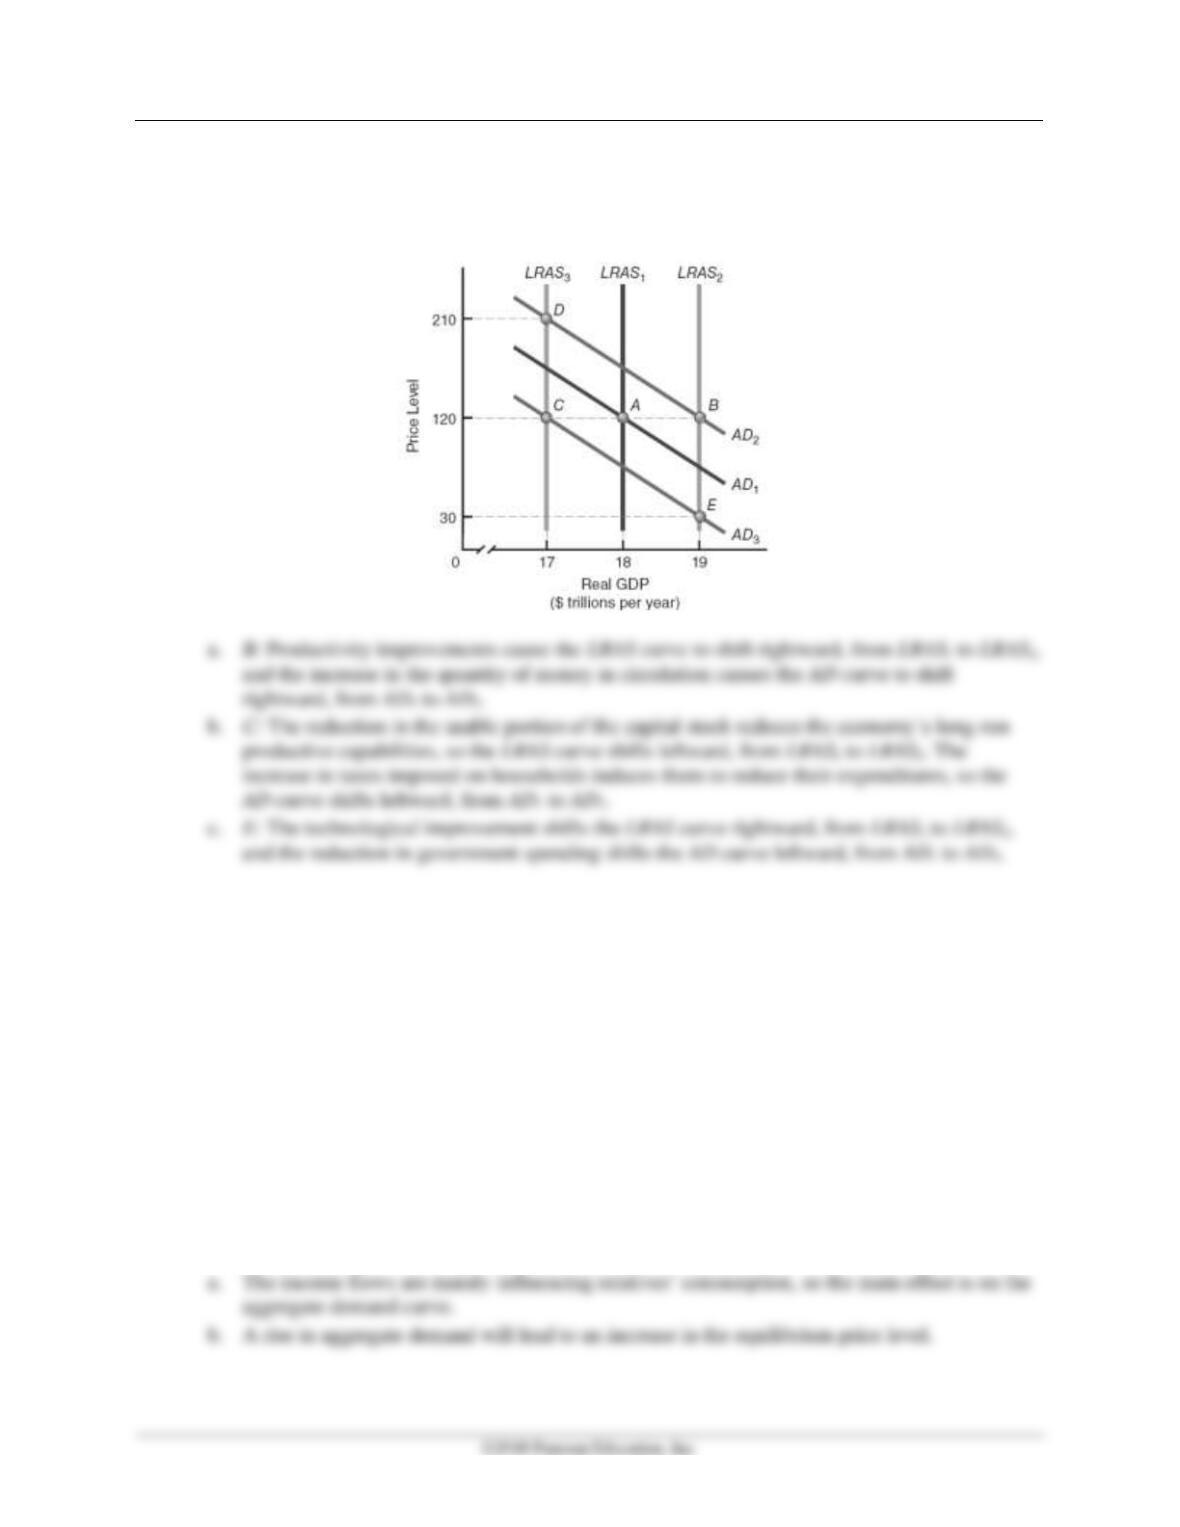
10-16. For each question, suppose that the economy begins at the long-run equilibrium point A in
the diagram below. Identify which of the other points on the diagram—points B, C, D, or
E—could represent a new long-run equilibrium after the described events take place and
move the economy away from point A.
a. Significant productivity improvements occur, and the quantity of money in circulation
increases.
b. No new capital investment takes place, and a fraction of the existing capital stock
depreciates and becomes unusable. At the same time, the government imposes a large
tax increase on the nation’s households.
154 Miller • Economics Today, Nineteenth Edition
c. More efficient techniques for producing goods and services are adopted throughout the
economy at the same time that the government reduces its spending on goods and
services.
10-17. In Ciudad Barrios, El Salvador, the latest payments from relatives working in the United
States have finally arrived. When the credit unions open for business, up to 150 people are
already waiting in line. After receiving the funds their relatives have transmitted to these
institutions, customers go off to outdoor markets to stock up on food or clothing or to
appliance stores to purchase new stereos or televisions. Similar scenes occur throughout the
developing world, as each year migrants working in higher-income, developed nations send
around $200 billion of their earnings back to their relatives in less developed nations.
Evidence indicates that the relatives, such as those in Ciudad Barrios, typically spend nearly
all of the funds on current consumption.
a. Based on the information supplied, are developing countries’ income inflows
transmitted by migrant workers primarily affecting their economies’ long-run
aggregate supply curves or aggregate demand curves?
b. How are equilibrium price levels in nations that are recipients of large inflows of funds
from migrants likely to be affected? Explain your reasoning.
10-18. In Figure 10-2, if the economy acquires a larger amount of capital goods in the current year,
does a larger or smaller onward shift in the production possibilities curve result? Does the
LRAS curve shift more or less far to the right? Why?
10-19. Consider Figure 10-4, what are the three effects of decreases in the price level, and do these
generate upwards or downward movements along the economy’s aggregate demand curve?
10-20. Take a look at panel (a) of Figure 10-6. In the absence of a change in aggregate demand,
what effect does economic growth have on the price level over time, other things being
equal? Why?
10-21. Take a look at panel (b) of Figure 10–6. If the Federal Reserve seeks to prevent secular
deflation from taking place as a consequence of economic growth, how should it change
the quantity of money in circulation? How would this policy action prevent secular
deflation?
10-22. Consider panel (a) of Figure 10-8. What type of variation in the position of the long-run
aggregate supply curve could generate inflation-that is, an increase in the equilibrium, price
level? In a nation that generally experiences economic growth over the long run, would we
anticipate that such a change in the position of the long-run aggregate supply curve could
explain persistent inflation?
10-23. Take a look at panel (b) of Figure 10-8. What change in the position of the aggregate
demand curve could generate inflation-that is, an increase in the equilibrium price level?
What type of variation in the quantity of money placed into circulation by the Federal
Reserve could generate such a change in the position of the aggregate demand curve?
◼ Selected References
Barro, Robert J., Macroeconomics, 2nd ed., New York: John Wiley and Sons, 1987.