Solution
Chapter: 10
Problem: 23
Expected Net Cash Flows
Time Project A Project B
0($375) ($575)
1($300) $190
2($200) $190
3($100) $190
4$600 $190
5$600 $190
6$926 $190
7($200) $0
@ 12% cost of capital @ 18% cost of capital
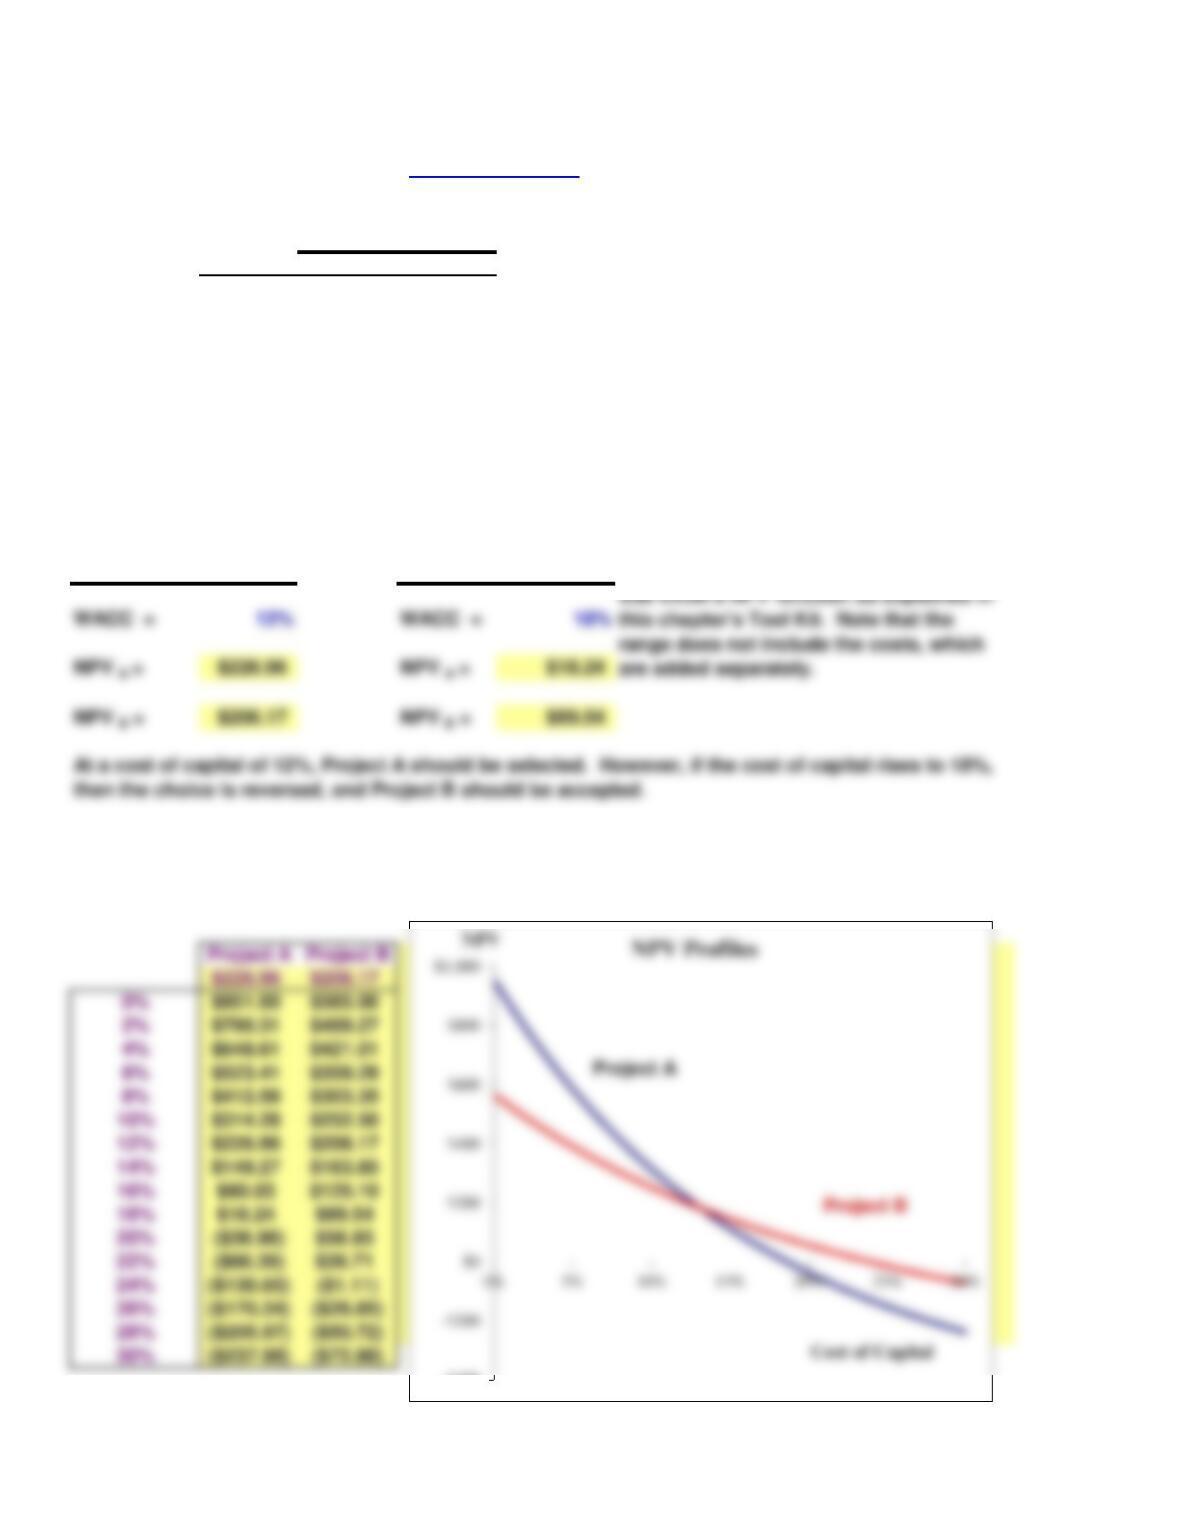
b. Construct NPV profiles for Projects A and B.
c. What is each project’s IRR?
We find the internal rate of return with Excel’s IRR function:
12/7/2012
Before we can graph the NPV profiles for these projects, we must create a data table of project NPVs
relative to differing costs of capital.
Gardial Fisheries is considering two mutually exclusive investments. The projects’ expected net cash
flows are as follows:
a. If each project’s cost of capital is 12%, which project should be selected? If the cost of capital is
18%, what project is the proper choice?
-$400
At a cost of capital of 12%, Project A should be selected. However, if the cost of capital rises to 18%,
then the choice is reversed, and Project B should be accepted.
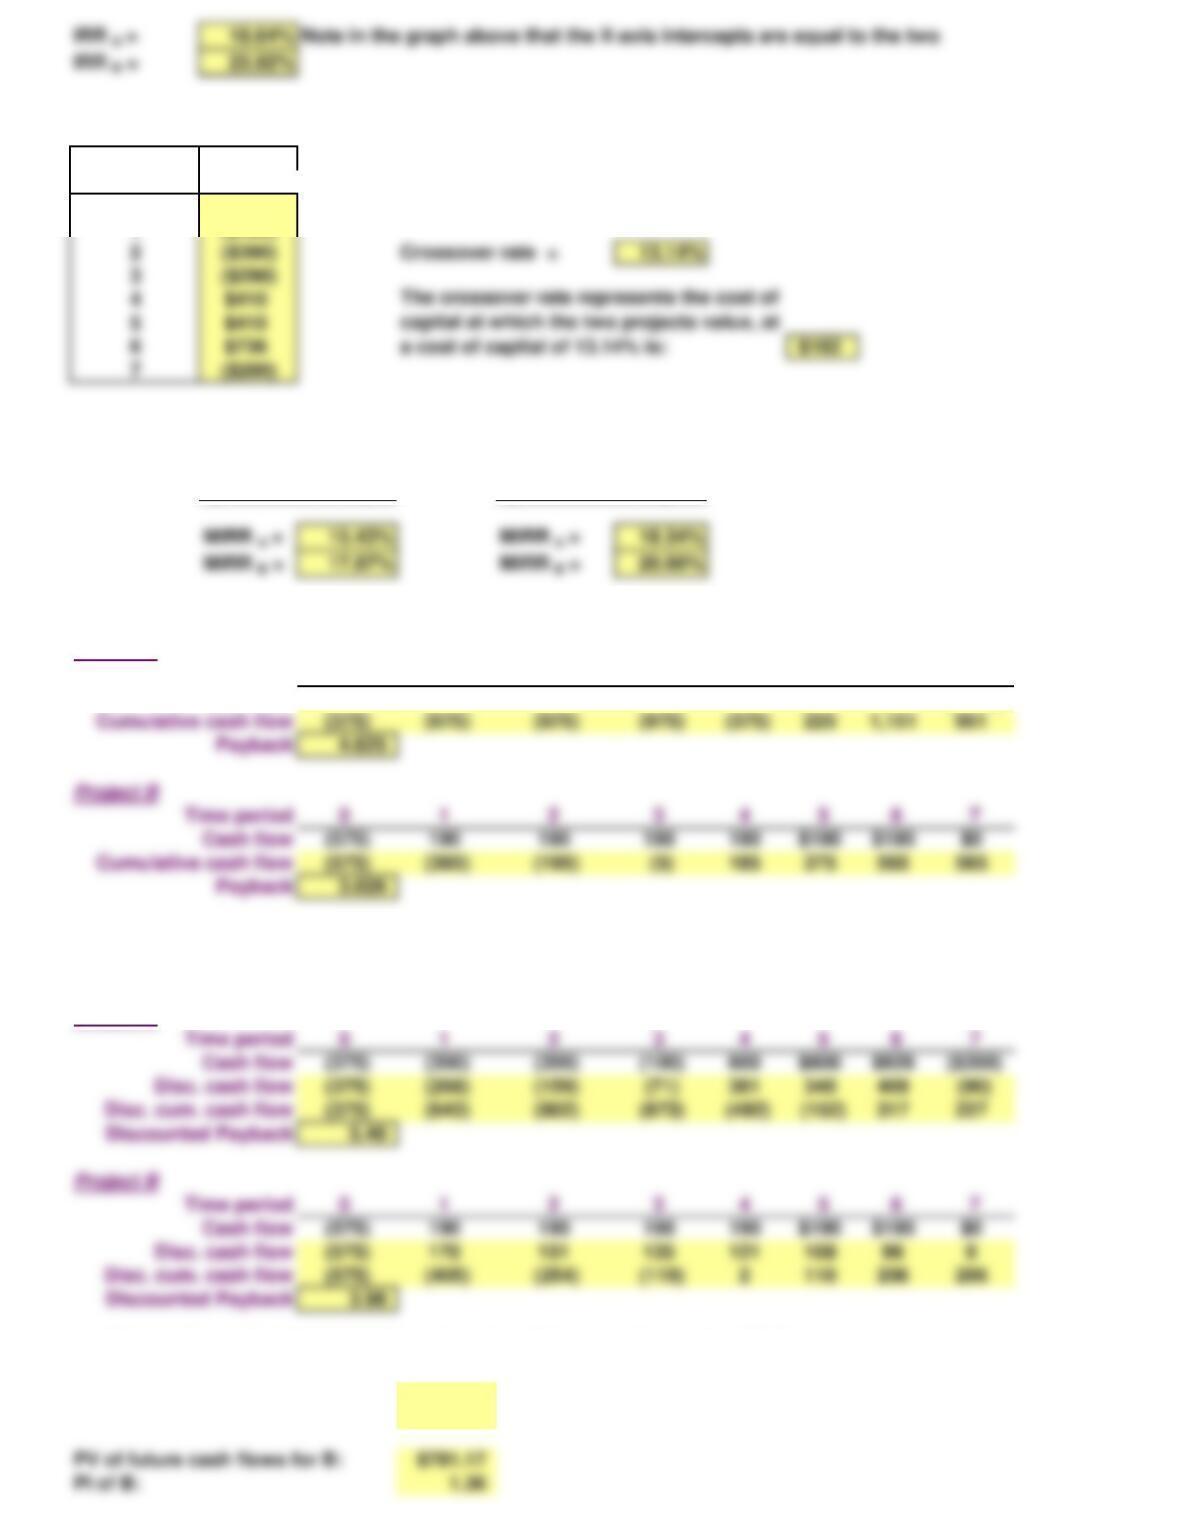
d. What is the crossover rate, and what is its significance?
Cash flow
Time
differential
0$200
1 ($490)
3 ($290)
4$410
5$410
6$736 $182
7 ($200)
@ 12% cost of capital @ 18% cost of capital
f. What is the regular payback period for these two projects?
Project A
Time period 0 1 2 3 4 5 6 7
Cash flow (375) (300) (200) (100) 600 $600 $926 ($200)
Project B
Time period 0 1 2 3 4 5 6 7
Cash flow (575) 190 190 190 190 $190 $190 $0
g. At a cost of capital of 12%, what is the discounted payback period for these two projects?
WACC = 12%
Project A
Time period 0 1 2 3 4 5 6 7
Cash flow (375) (300) (200) (100) 600 $600 $926 ($200)
Project B
Time period 0 1 2 3 4 5 6 7
Cash flow (575) 190 190 190 190 $190 $190 $0
h. What is the profitability index for each project if the cost of capital is 12%?
PV of future cash flows for A: $601.96
PI of A: 1.61
PV of future cash flows for B: $781.17
PI of B: 1.36
e. What is each project’s MIRR at a cost of capital of 12%? At r = 18%? Hint: note that B is a 6-year project.