Answers and Solutions: 10 – 1
Chapter 10
The Basics of Capital Budgeting: Evaluating Cash Flows
ANSWERS TO END-OF-CHAPTER QUESTIONS
10-1 a. Capital budgeting is the whole process of analyzing projects and deciding whether
they should be included in the capital budget. This process is of fundamental
importance to the success or failure of the firm as the fixed asset investment decisions
chart the course of a company for many years into the future. The payback, or
b. Mutually exclusive projects cannot be performed at the same time. We can choose
either Project 1 or Project 2, or we can reject both, but we cannot accept both
projects. Independent projects can be accepted or rejected individually.
c. The net present value (NPV) and internal rate of return (IRR) techniques are
discounted cash flow (DCF) evaluation techniques. These are called DCF methods
because they explicitly recognize the time value of money. NPV is the present value
of the project’s expected future cash flows (both inflows and outflows), discounted at
the appropriate cost of capital. NPV is a direct measure of the value of the project to
shareholders. The internal rate of return (IRR) is the discount rate that equates the
f. Capital projects with nonnormal cash flows have a large cash outflow either
sometime during or at the end of their lives. A common problem encountered when
evaluating projects with nonnormal cash flows is multiple IRRs. A project has
normal cash flows if one or more cash outflows (costs) are followed by a series of
cash inflows.
g. The mathematics of the NPV method imply that project cash flows are reinvested at
h. A replacement chain is a method of comparing mutually exclusive projects that have
unequal lives. Each project is replicated such that they will both terminate in a
common year. If projects with lives of 3 years and 5 years are being evaluated, the 3–
year project would be replicated 5 times and the 5-year project replicated 3 times;
thus, both projects would terminate in 15 years. Not all projects maximize their NPV
if operated over their engineering lives and therefore it may be best to terminate a
project prior to its potential life. The economic life is the number of years a project
should be operated to maximize its NPV, and is often less than the maximum
potential life. Capital rationing occurs when a firm’s management limits its capital
10-2 Projects requiring greater investments or that have greater risk should be given detailed
analysis the capital budgeting process.
10-3 The NPV is obtained by discounting future cash flows, and the discounting process
actually compounds the interest rate over time. Thus, an increase in the discount rate has
a much greater impact on a cash flow in Year 5 than on a cash flow in Year 1.
Answers and Solutions: 10 – 3
SOLUTIONS TO END-OF-CHAPTER PROBLEMS
10-1 NPV = -$40,000 + $9,000[(1/I) – (1/(I × (1 + I)N)]
= -$40,000 + $9,000[(1/0.11) – (1/(0.11 × (1 + 0.11)7)]
= $2,409.77.
Financial calculator solution: Input CF0 = -40000, CF1-7 = 9000, I/YR = 11, and then
solve for NPV = $2,409.77.
10-2 Financial calculator solution: Input CF0 = -40000, CF1-8 = 9000, and then solve for IRR
= 12.84%.
Answers and Solutions: 10 – 4
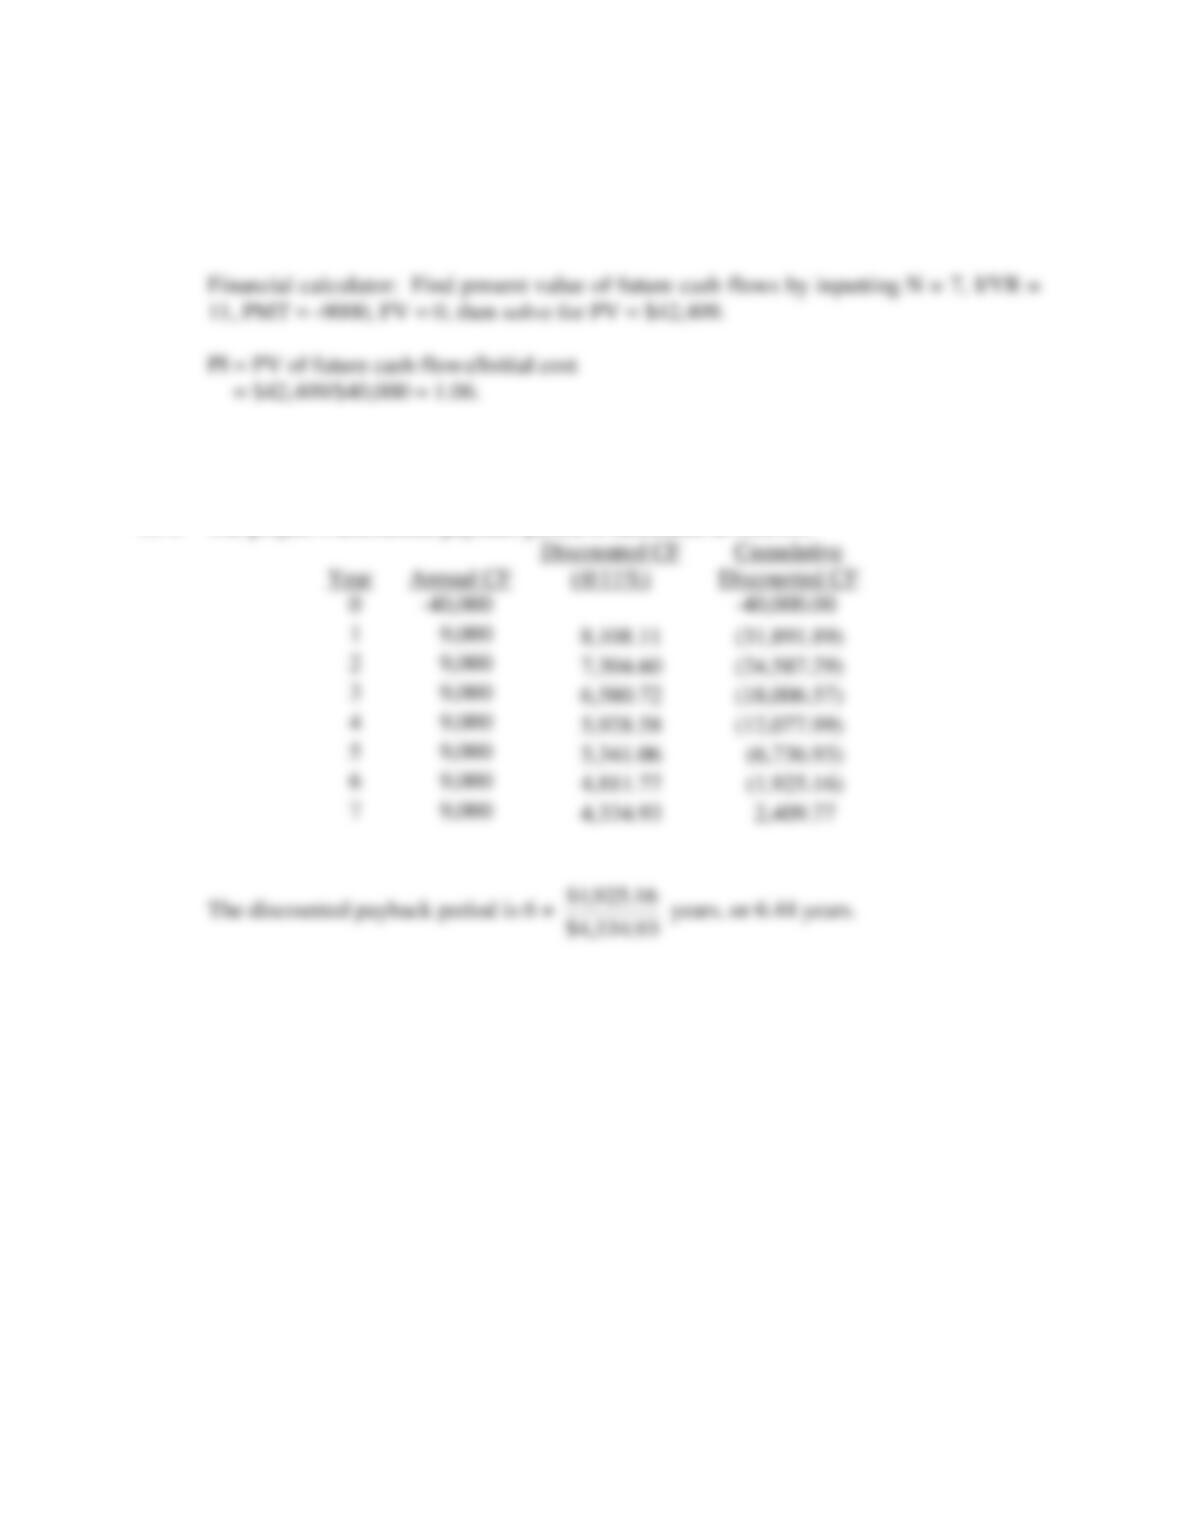
10-4 PV = $9,000[(1/I) – (1/(I × (1 + I)N)]
= $9,000[(1/0.11) – (1/(0.11 × (1 + 0.11)7)]
= $42,410.
10-5 Since the cash flows are a constant $9,000, calculate the payback period as:
$40,000/$9,000 = 4.44, so the payback is about 4 years.
10-6 The project’s discounted payback period is calculated as follows:
Answers and Solutions: 10 – 5
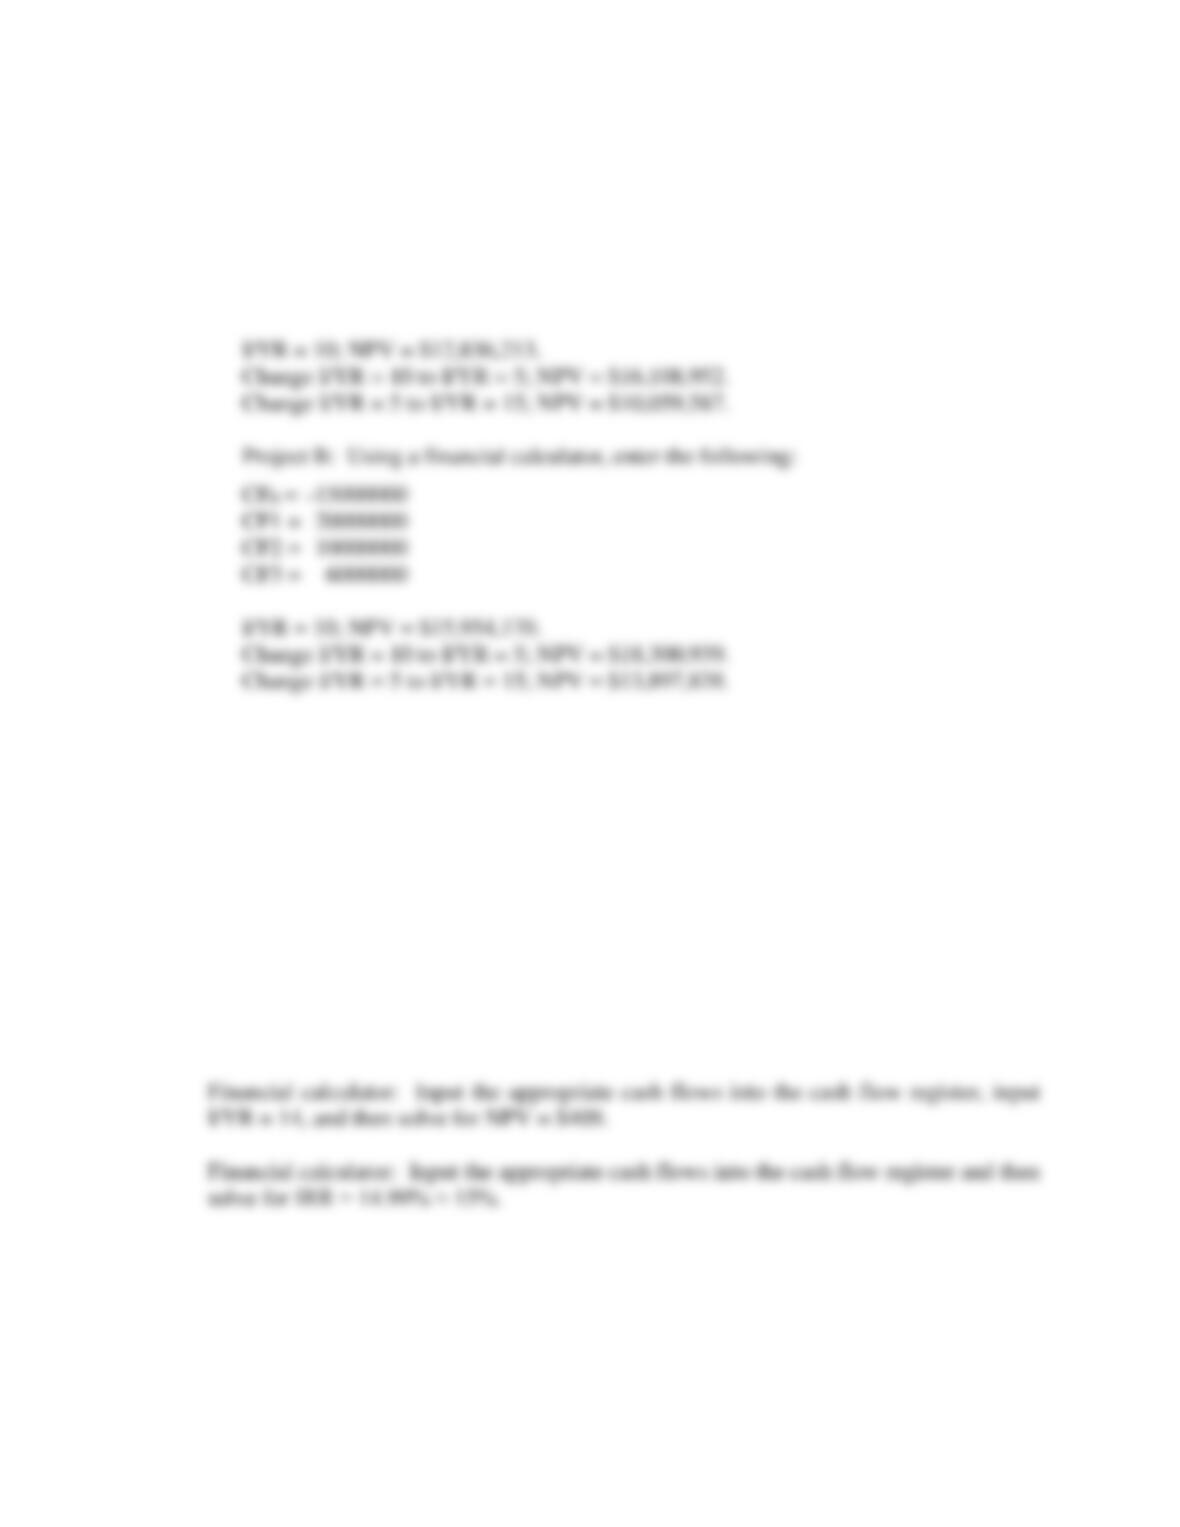
10-7 a. Project A: Using a financial calculator, enter the following:
CF0 = -15000000
CF1 = 5000000
CF2 = 10000000
CF3 = 20000000
b. Using the data for Project A, enter the cash flows into a financial calculator and solve
for IRRA = 43.97%. The IRR is independent of the WACC, so IRR doesn’t change
when the WACC changes.
Using the data for Project B, enter the cash flows into a financial calculator and solve
for IRRB = 82.03%. Again, the IRR is independent of the WACC, so IRR doesn’t
change when the WACC changes.
10-8 Truck:
NPV = -$17,100 + $5,100(PVIFA14%,5)
= -$17,100 + $5,100(3.4331) = -$17,100 + $17,509
= $409. (Accept)
14%
Answers and Solutions: 10 – 6
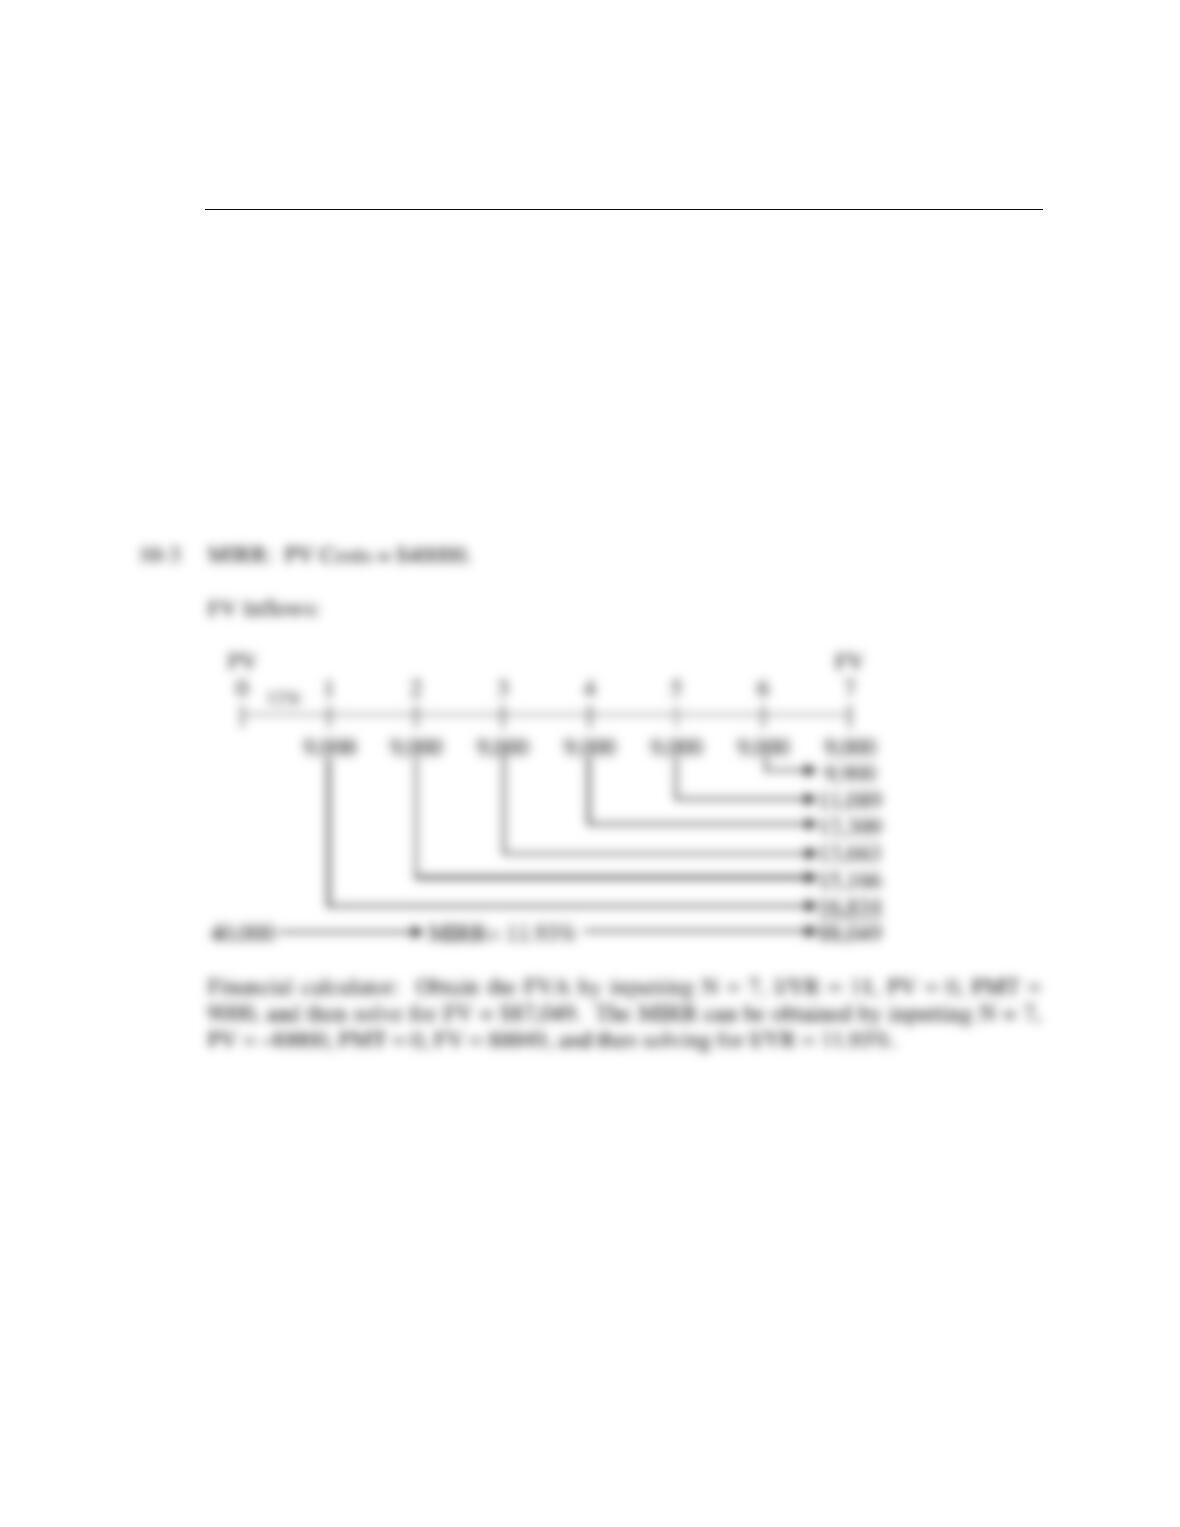
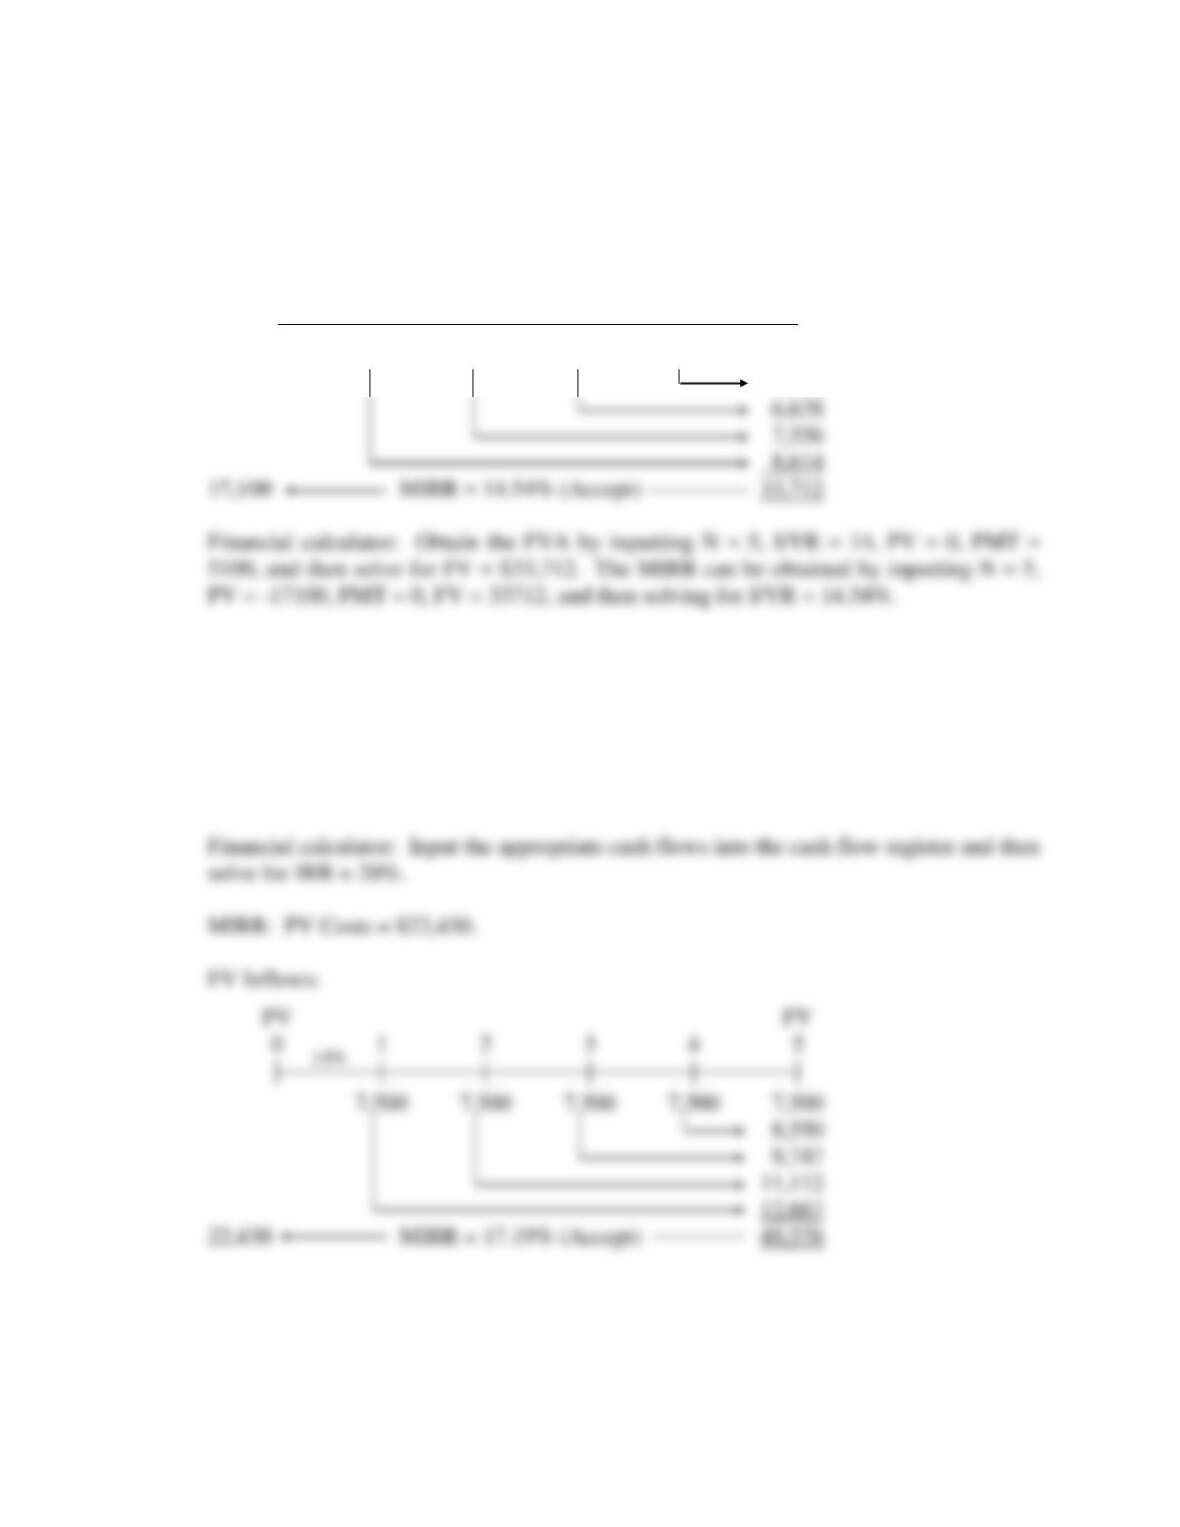
MIRR: PV Costs = $17,100.
FV Inflows:
PV FV
0 1 2 3 4 5
| | | | | |
5,100 5,100 5,100 5,100 5,100
5,814
Pulley:
NPV = -$22,430 + $7,500(3.4331) = -$22,430 + $25,748
= $3,318. (Accept)
Financial calculator: Input the appropriate cash flows into the cash flow register, input
I/YR = 14, and then solve for NPV = $3,318.
14%

Answers and Solutions: 10 – 7
Financial calculator: Obtain the FVA by inputting N = 5, I/YR = 14, PV = 0, PMT =
7500, and then solve for FV = $49,576. The MIRR can be obtained by inputting N = 5,
PV = -22430, PMT = 0, FV = 49576, and then solving for I/YR = 17.19%.
10-9 Electric-powered:
NPVE = -$22,000 + $6,290[(1/i) – (1/(i × (1 + i)n)]
= -$22,000 + $6,290[(1/0.12) – (1/(0.12 × (1 + 0.12)6)]
= -$22,000 + $6,290(4.1114) = -$22,000 + $25,861 = $3,861.
Gas-powered:
NPVG = -$17,500 + $5,000[(1/i) – (1/(i × (1 + i)n)]
= -$17,500 + $5,000[(1/0.12) – (1/(0.12 × (1 + 0.12)6)]
= -$17,500 + $5,000(4.1114) = -$17,500 + $20,557 = $3,057.
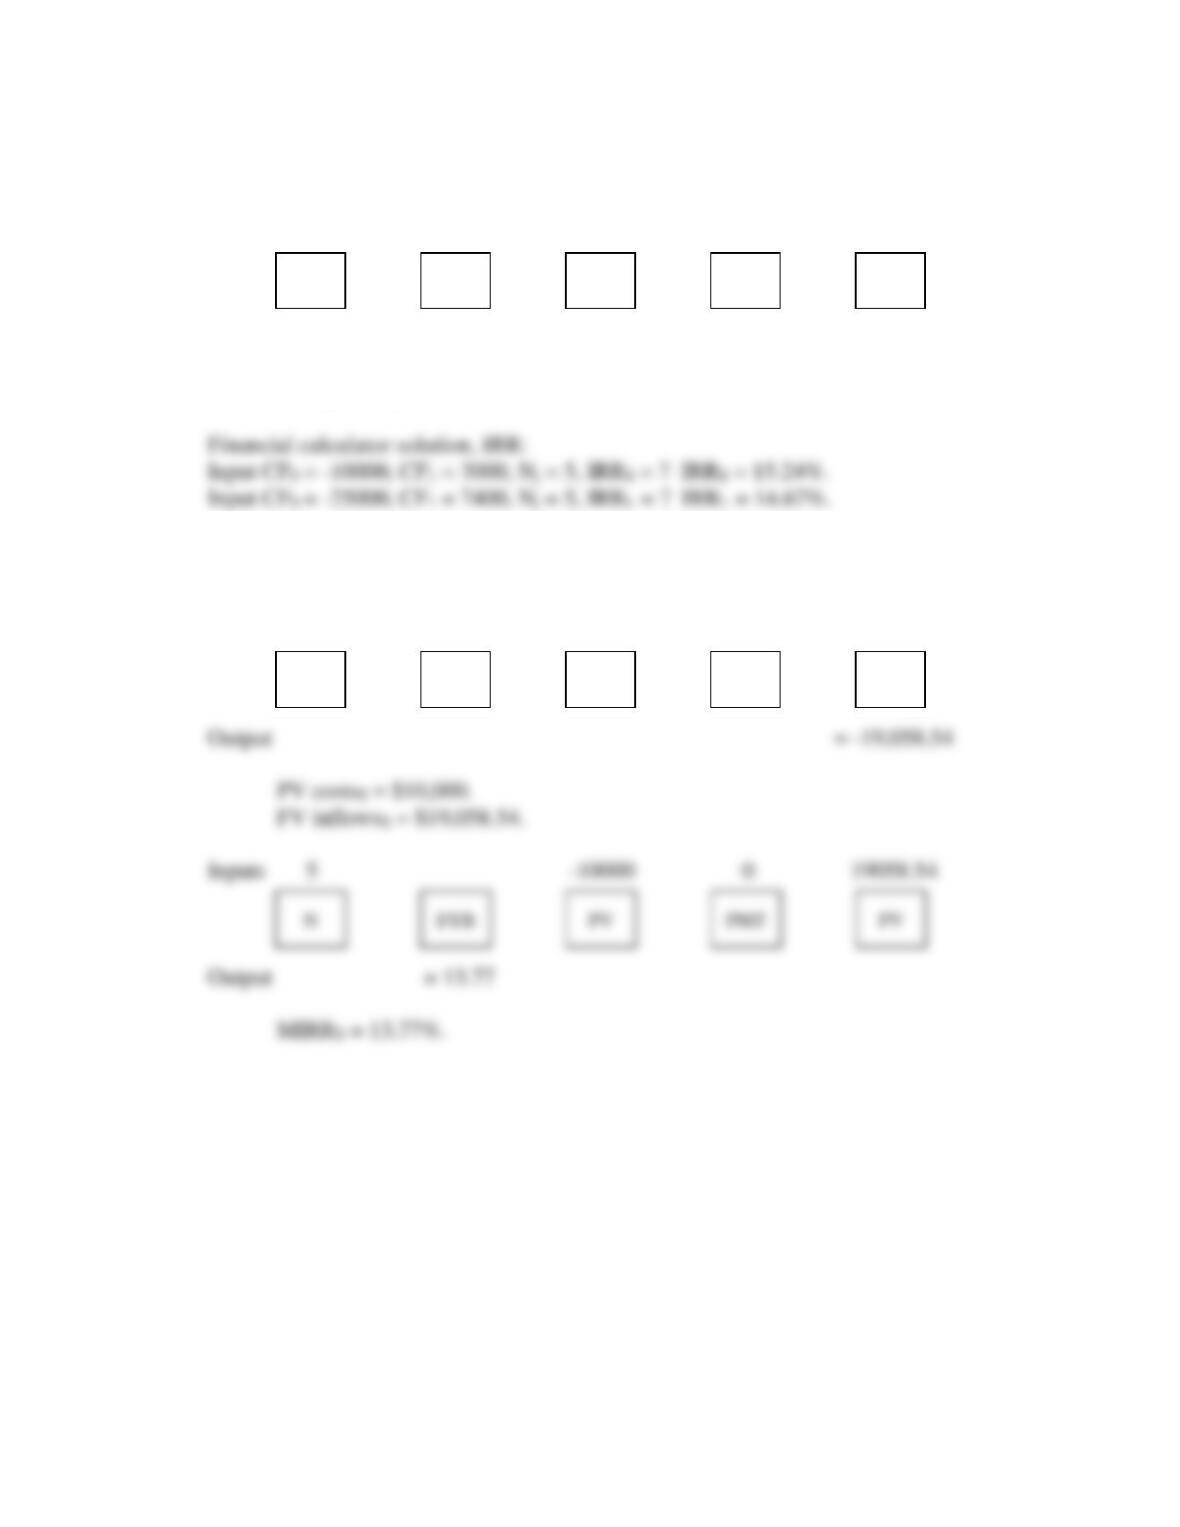
10-10 Financial calculator solution, NPV:
Project S
Inputs 5 12 3000 0
N
I/YR
FV
PMT
PV
N
I/YR
FV
PMT
PV
Answers and Solutions: 10 – 8
Project L
Inputs 5 12 7400 0
Output = -26,675.34
NPVL = $26,675.34 – $25,000 = $1,675.34.
Financial calculator solution, MIRR:
Project S
Inputs 5 12 0 3000
N
I/YR
FV
PMT
PV
N
I/YR
FV
PMT
PV
Answers and Solutions: 10 – 9
Project L
Inputs 5 12 0 7400
Output = 13.46
MIRRL = 13.46%.
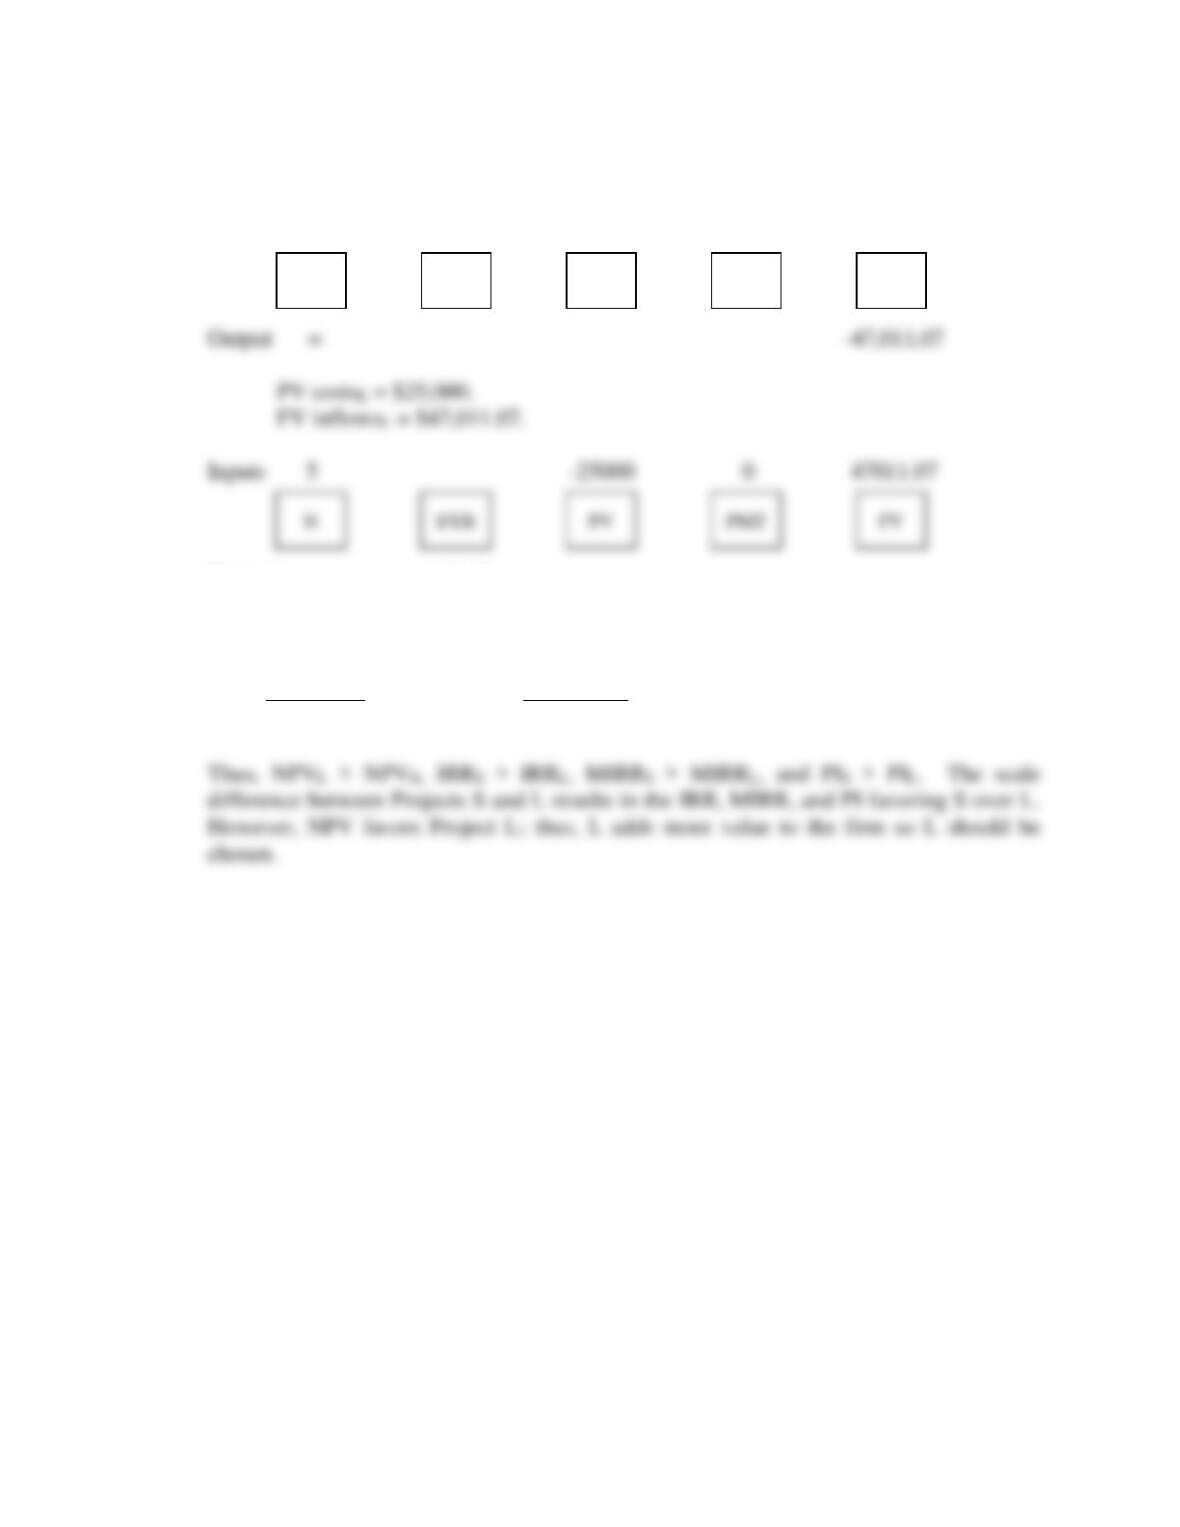
PIS =
000,10$
33.814,10$
= 1.081. PIL =
000,25$
34.675,26$
= 1.067.
N
I/YR
FV
PMT
PV
N
I/YR
FV
PMT
PV
Answers and Solutions: 10 – 10
10-11 Because both projects are the same size you can just calculate each project’s MIRR and
choose the project with the higher MIRR. (Remember, MIRR gives conflicting results
from NPV when there are scale differences between the projects.)
Project X: 0 1 2 3 4
| | | | |
-5,000 1,000 1,500 2,000 4,000.00
Project Y: 0 1 2 3 4
| | | | |
-5,000 4,500 1,500 1,000 500.00
1,120.00
Thus, since MIRRY > MIRRX, Project Y should be chosen.
Alternative step: You could calculate NPVs, see that Project X has the higher NPV, and
just calculate MIRRX.
12%
12%
Answers and Solutions: 10 – 11
10-12 a. Purchase price $ 900,000
Installation 165,000
Initial outlay $1,065,000
CF0 = -1065000; CF1-5 = 350000; I/YR = 14; NPV = ?
NPV = $136,578; IRR = 19.22%.
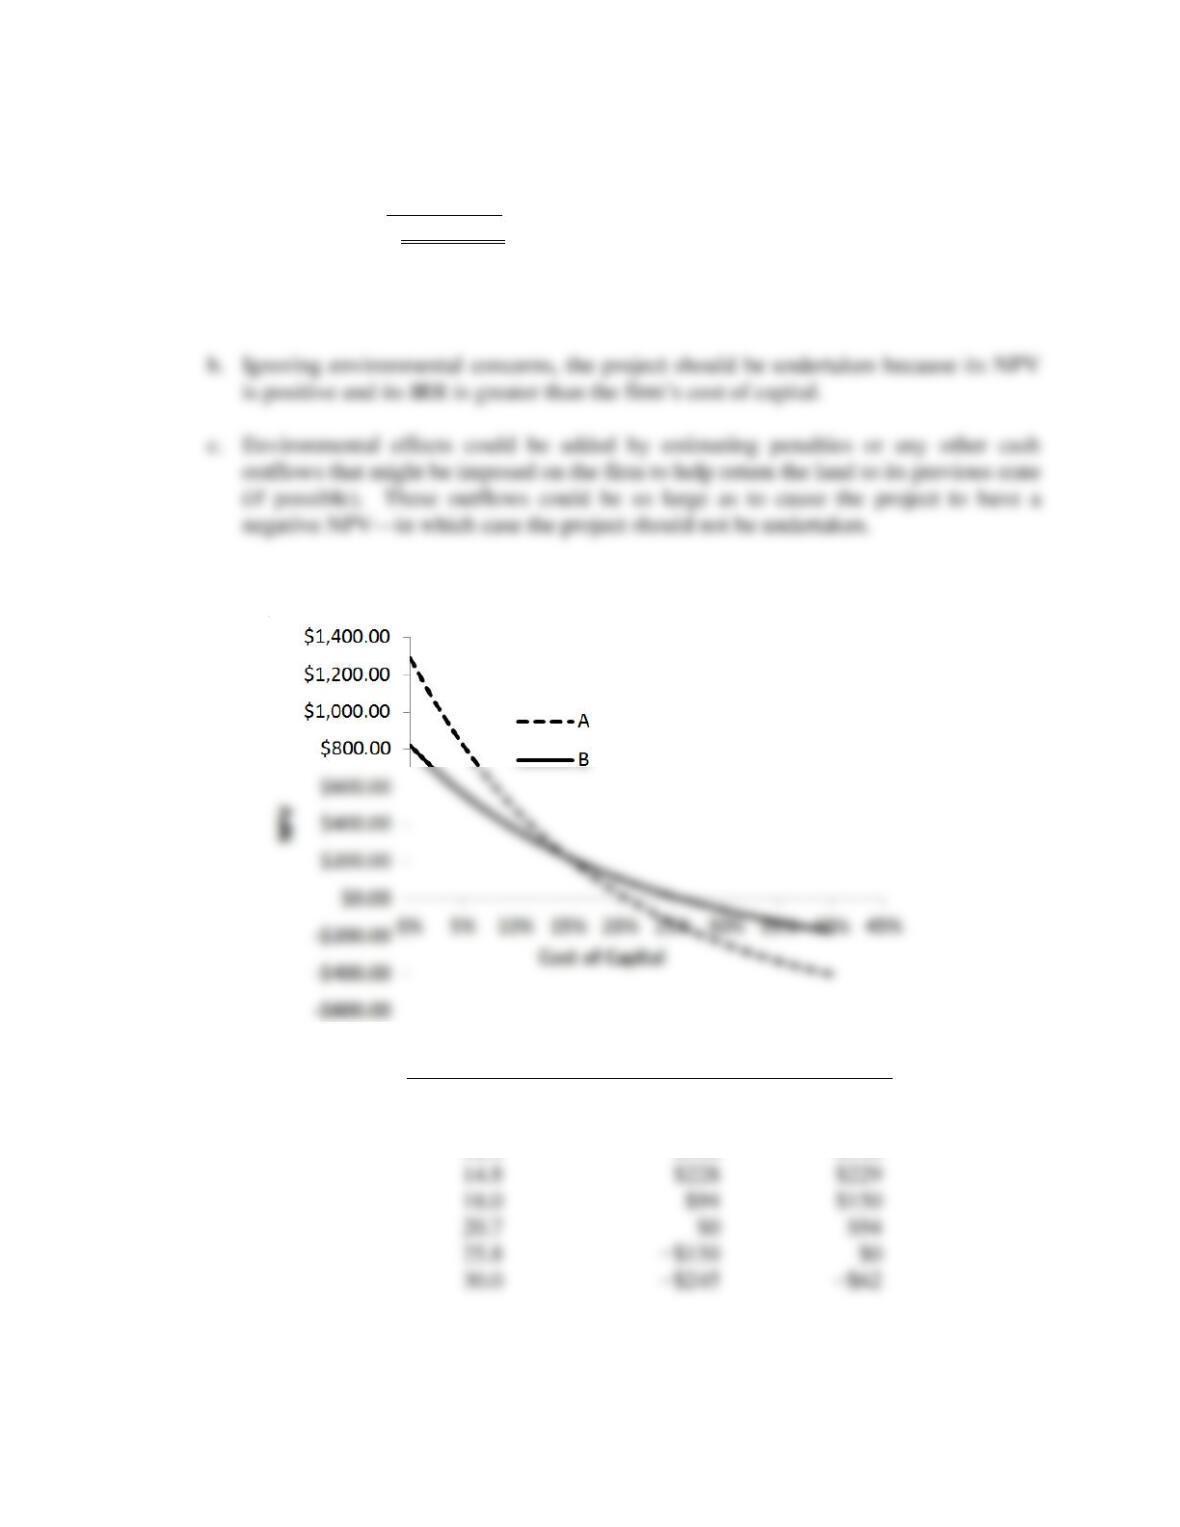
10-13 a.
r
NPVA
NPVB
0.0%
$1,288
$820
10.0
$479
$372
12.0
$366
$308
14.8
$228
$229
18.0
$150
20.7
25.8
30.0
Answers and Solutions: 10 – 12
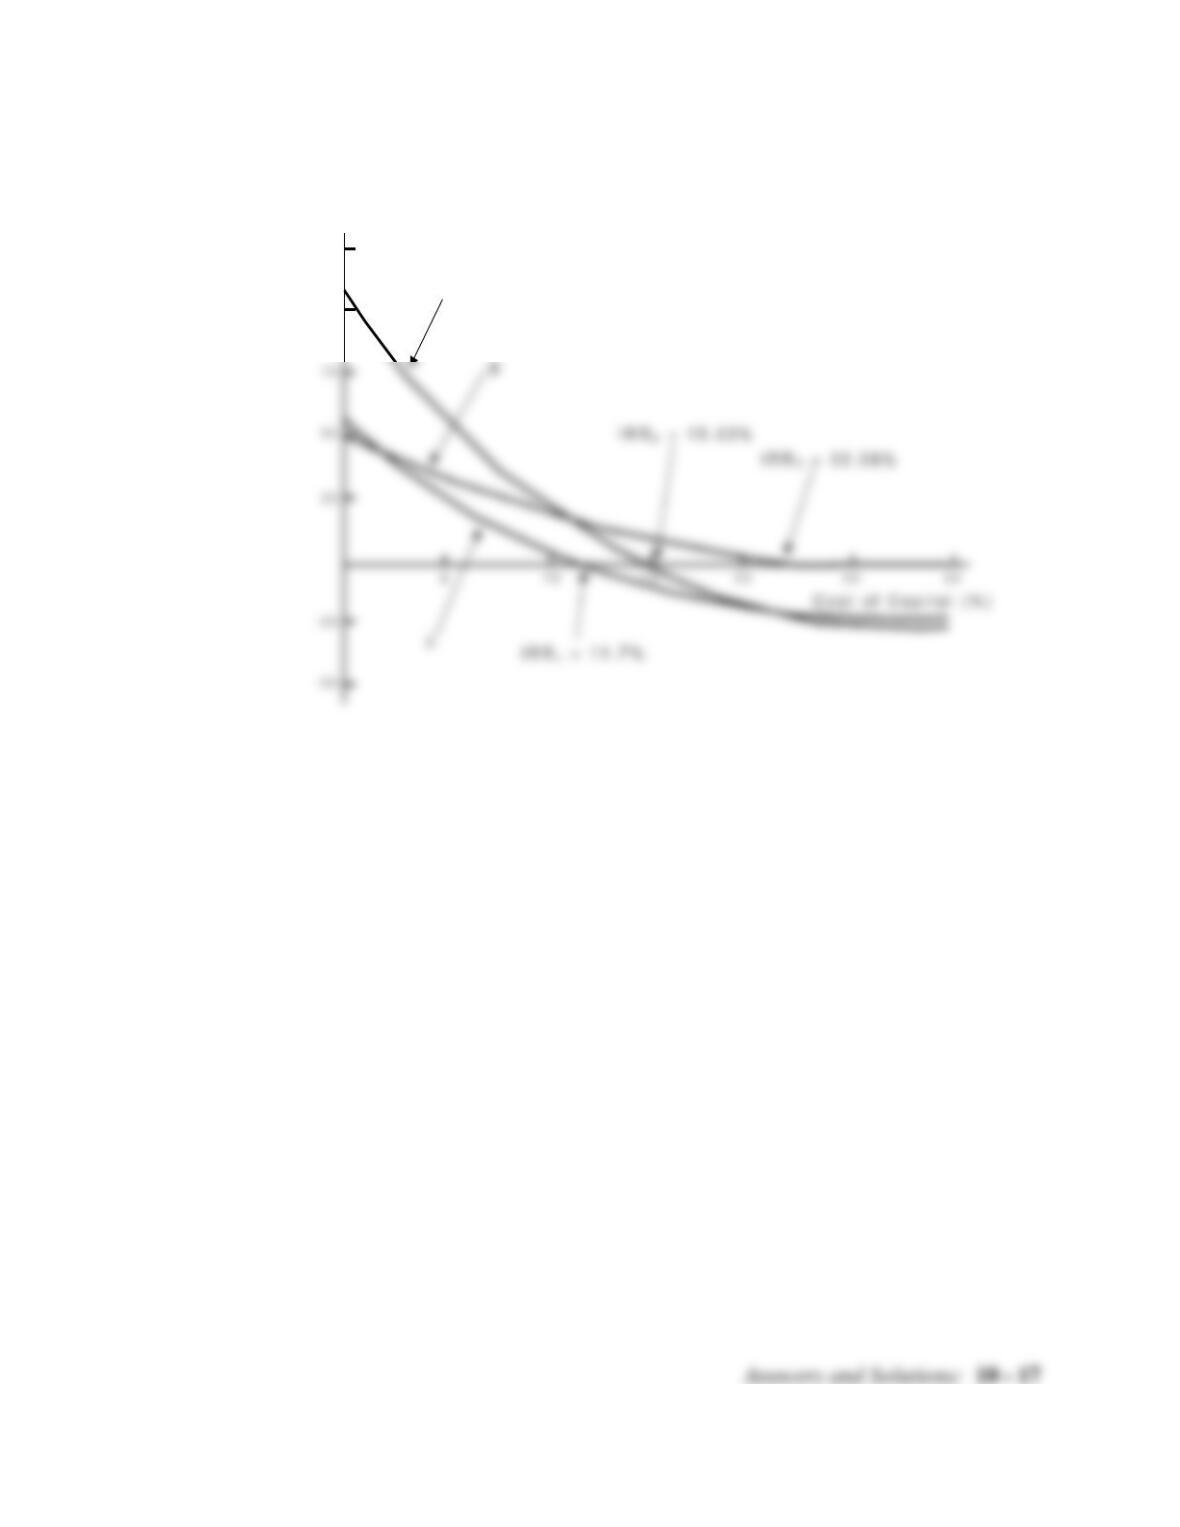
b. IRRA = 20.7%; IRRB = 25.8%.
d. Here is the MIRR for Project A when r = 10%:
PV costs = $400 + $528/(1.10)1 + $219/(1.10)2
+ $150/(1.10)3 + $325/(1.10)7 = $1,340.47
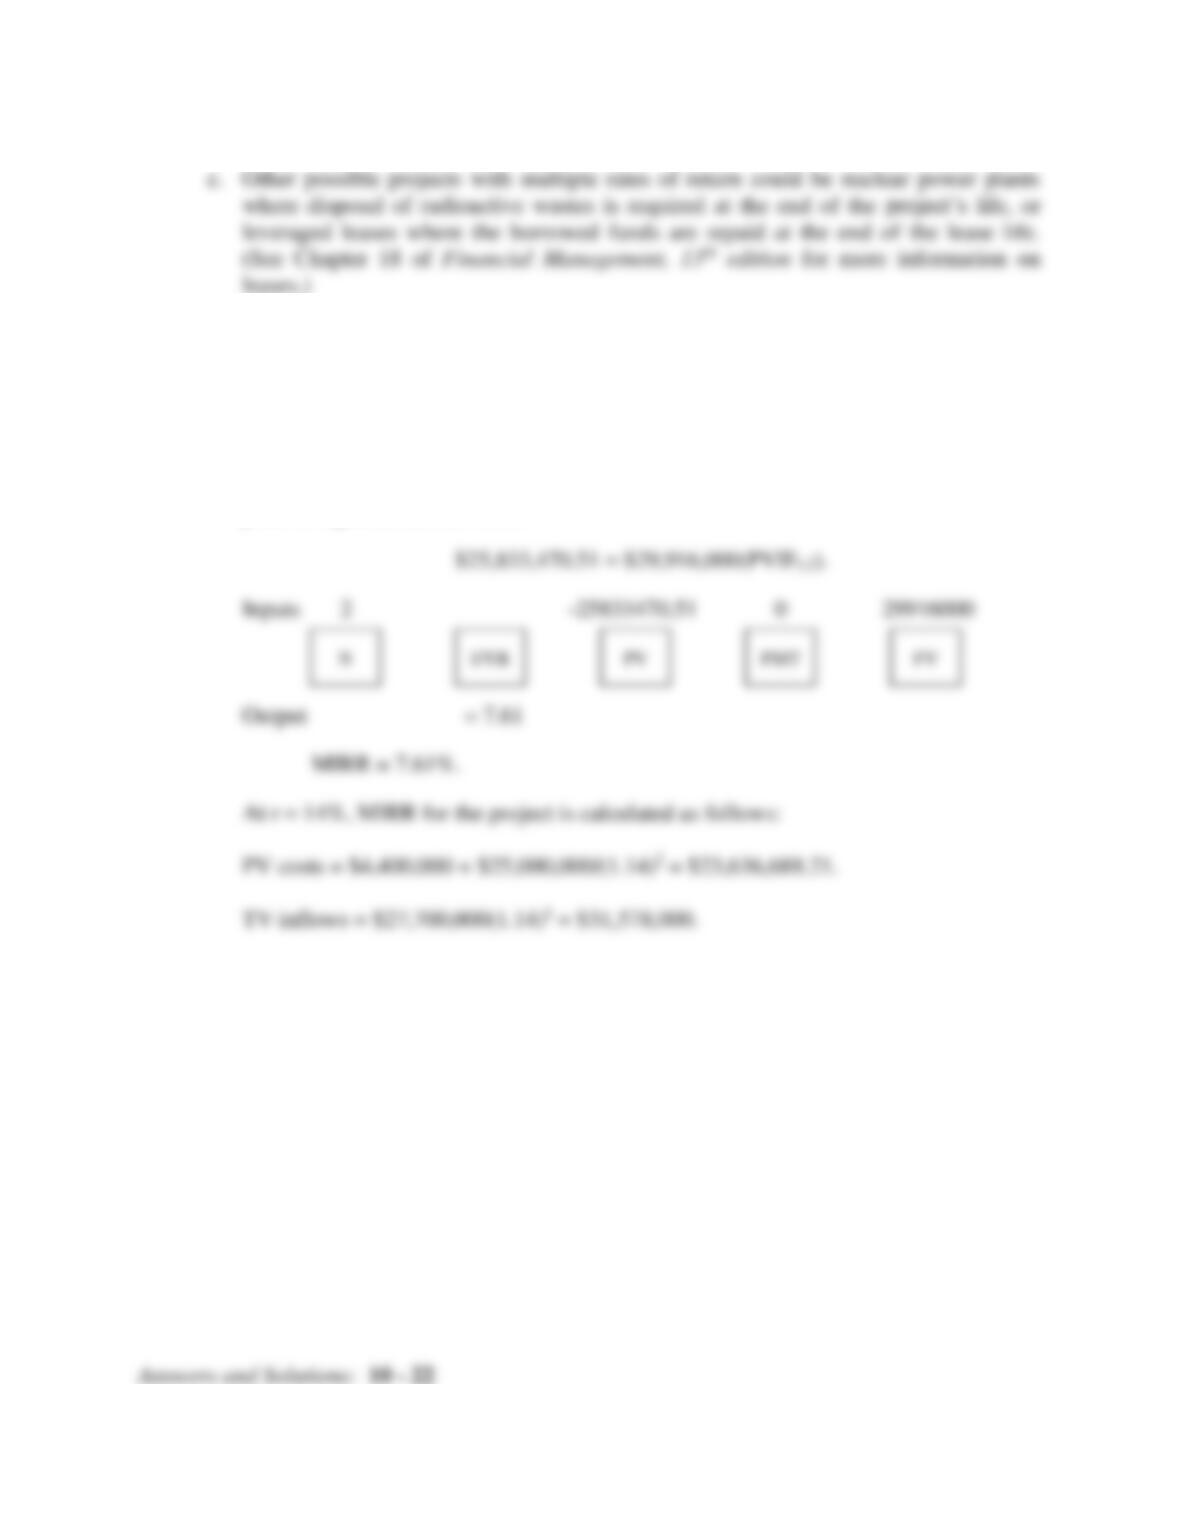
TV inflows = $1,100(1.10)3 + $820(1.10)2 + $990(1.10)1 = $3,545.30.
Similarly, $650 = $1,992.31/(1 + MIRR)7
MIRRB = 17.35%.
At r = 17%,
MIRRA = 18.76%.
MIRRB = 21.03%.
Answers and Solutions: 10 – 13
e. To find the crossover rate, construct a Project ∆ which is the difference in the two
projects’ cash flows:
Year
Project ∆ = CFA – CFB
0
$250
1
−738
2
−429
3
−360
4
890
5
610
6
780
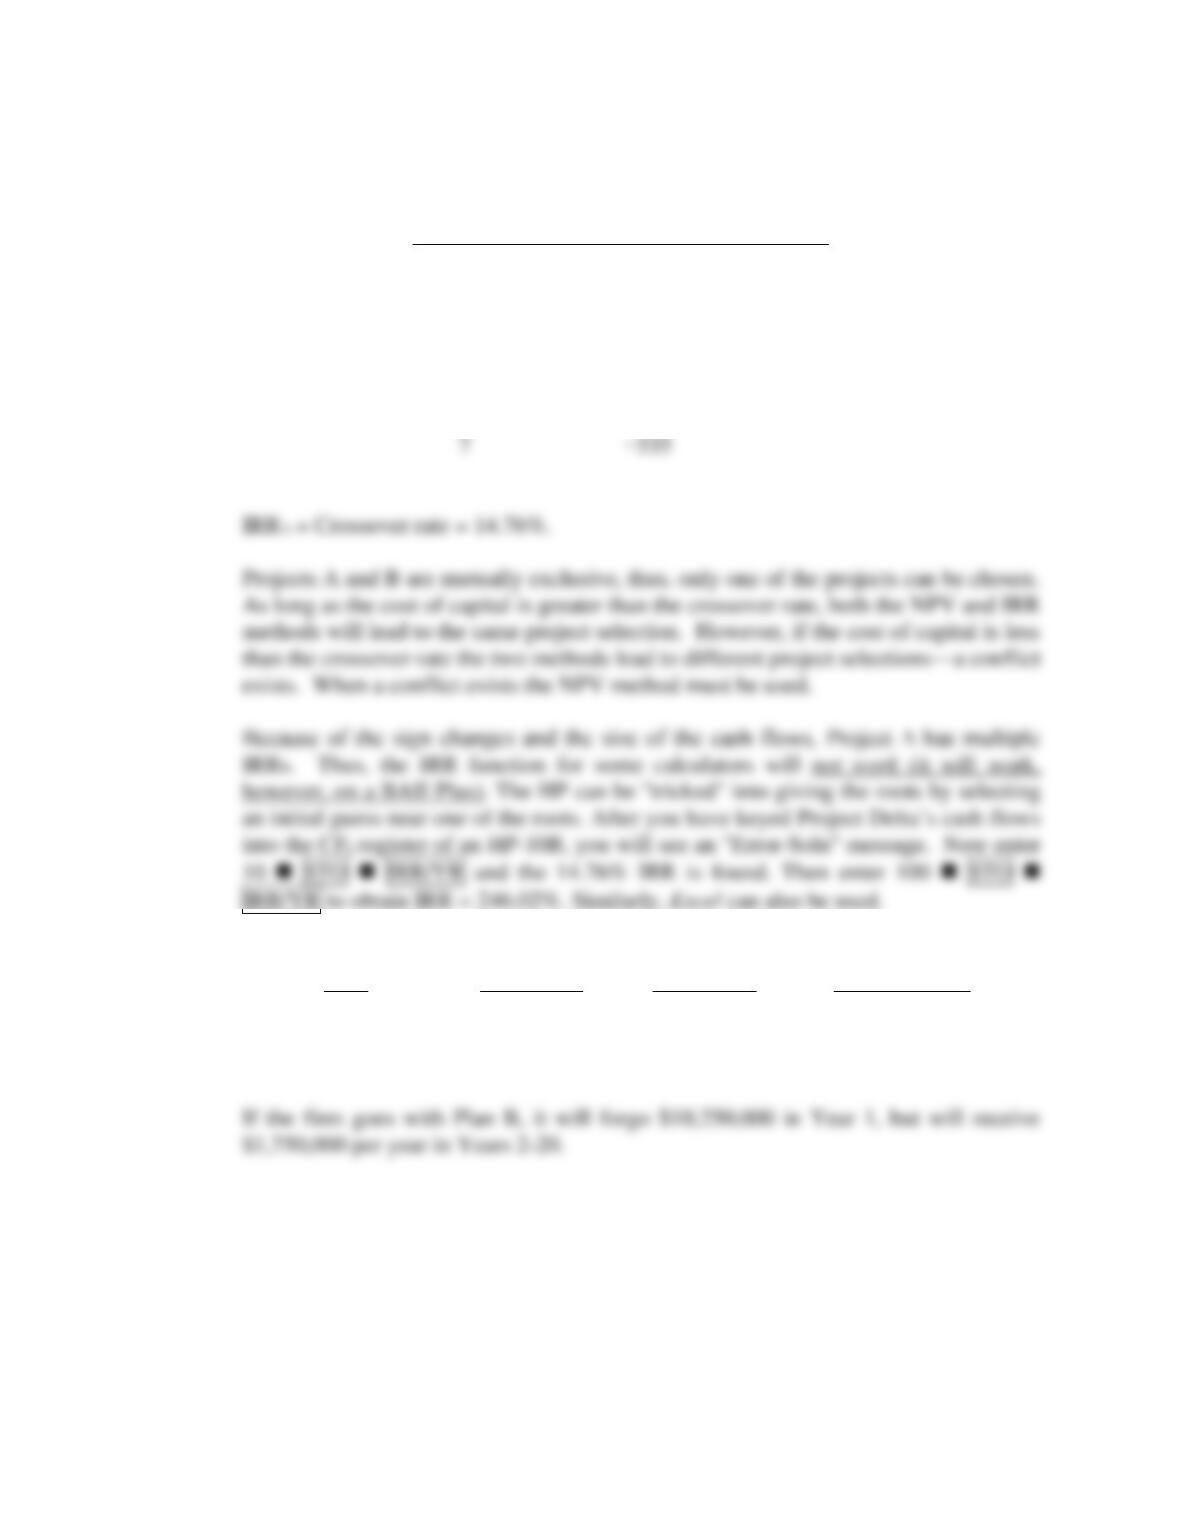
10-14 a. Incremental Cash
Year Plan B Plan A Flow (B – A)
0 ($10,000,000) ($10,000,000) $ 0
1 1,750,000 12,000,000 (10,250,000)
2-20 1,750,0000 0 1,750,000
7
−535
15
Answers and Solutions: 10 – 14
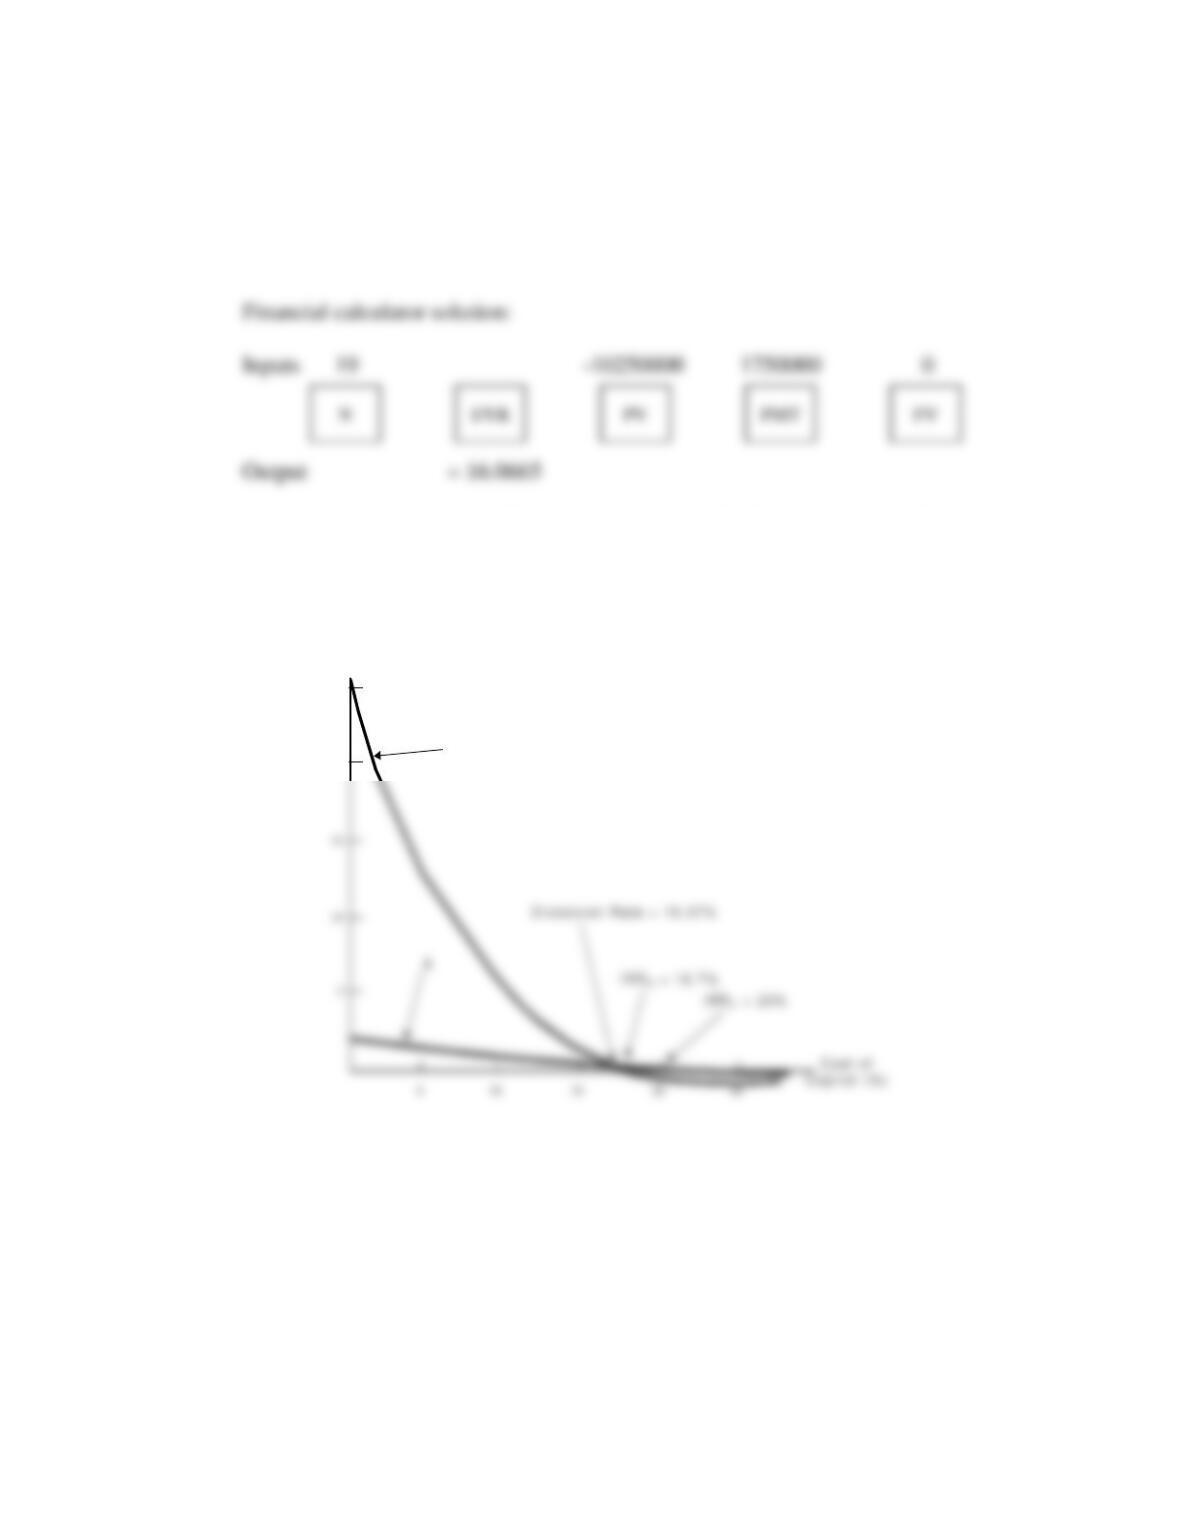
b. If the firm could invest the incremental $10,250,000 at a return of 16.07%, it would
receive cash flows of $1,750,000. If we set up an amortization schedule, we would
find that payments of $1,750,000 per year for 19 years would amortize a loan of
$10,250,000 at 16.0665%.
constant and does not vary with the amount of capital raised.
d. See graph. If the cost of capital is less than 16.07%, then Plan B should be accepted;
if r > 16.07%, then Plan A is preferred.
N P V ( M i l l i o n s o f D o l l a r s )
B
25
20
N
I/YR
FV
PMT
PV
Answers and Solutions: 10 – 15
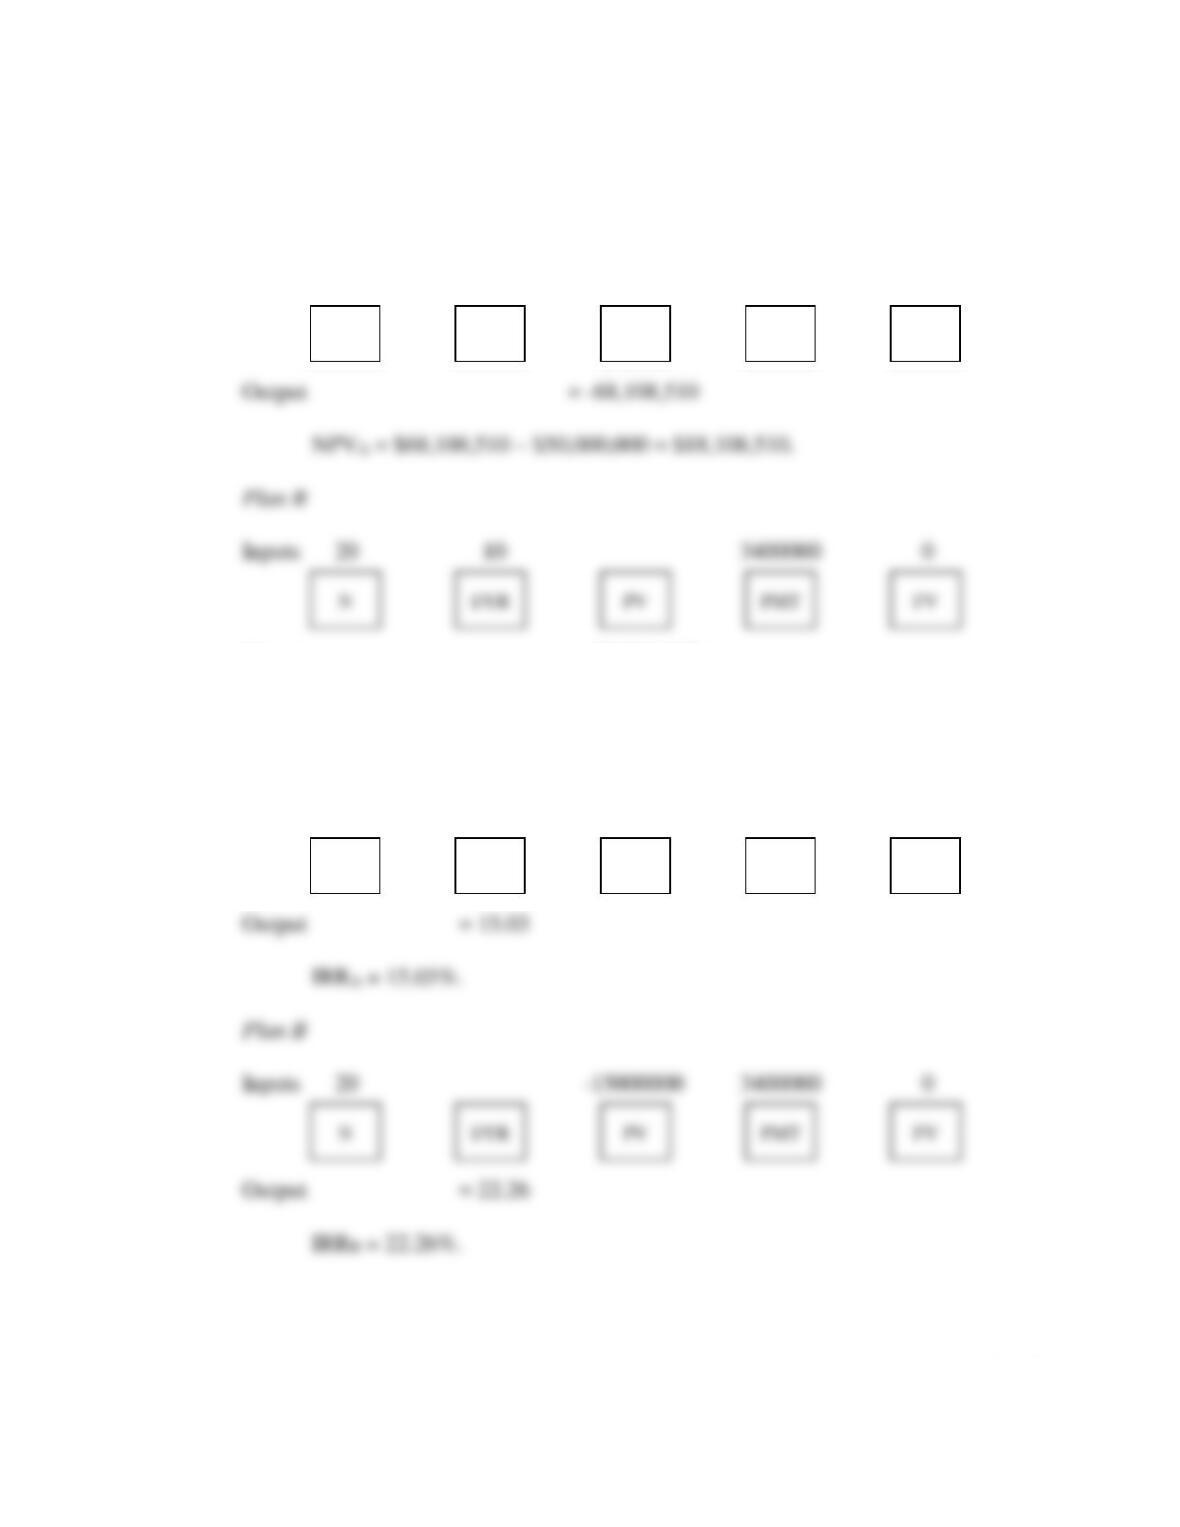
10-15 a. Financial calculator solution:
Plan A
Inputs 20 10 8000000 0
Output = -28,946,117
NPVB = $28,946,117 – $15,000,000 = $13,946,117.
Plan A
Inputs 20 -50000000 8000000 0
N
I/YR
FV
PMT
PV
N
I/YR
FV
PMT
PV
N
I/YR
FV
PMT
PV
Answers and Solutions: 10 – 16
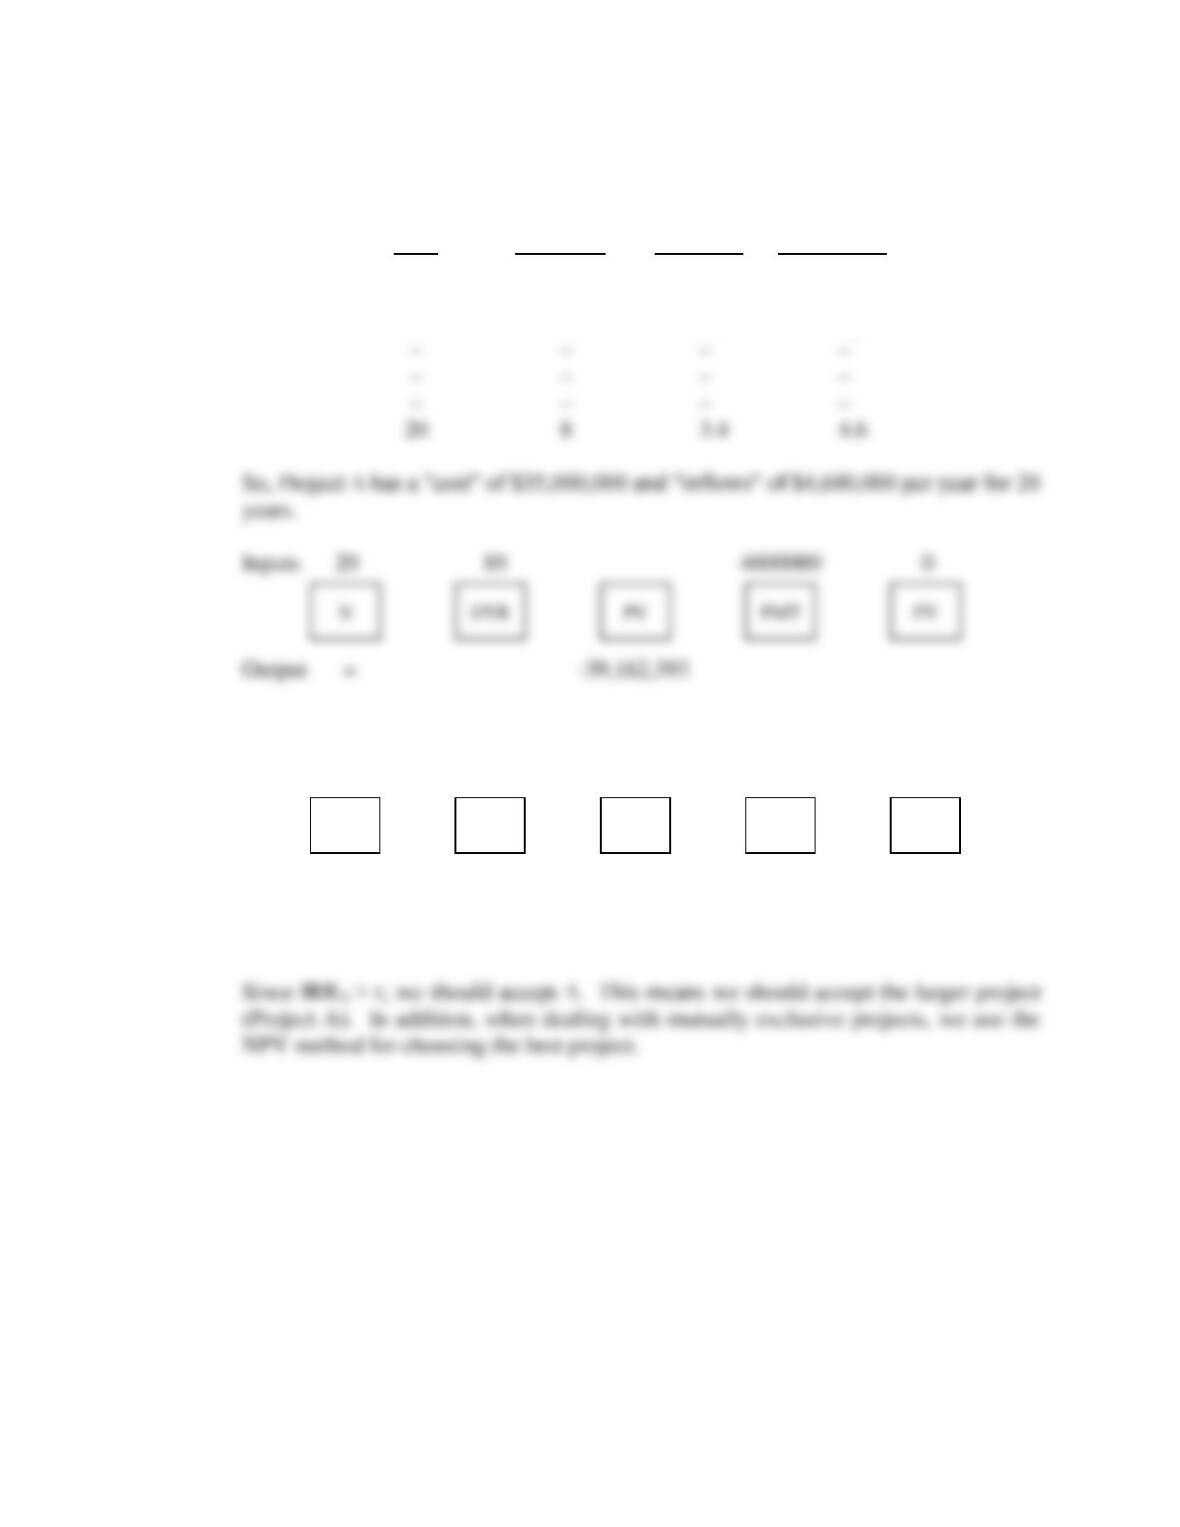
b. If the company takes Plan A rather than B, its cash flows will be (in millions of dollars):
Cash Flows Cash Flows Project ∆
Year from A from B Cash Flows
0 ($50) ($15.0) ($35.0)
1 8 3.4 4.6
2 8 3.4 4.6
NPV = $39,162,393 – $35,000,000 = $4,162,393.
Inputs 20 -35000000 4600000 0
Output = 11.71
IRR = 11.71%.
N
I/YR
FV
PMT
PV
N
I/YR
FV
PMT
PV
c.
N P V ( M i l l i o n s o f D o l l a r s )
C r o s s o v e r R a t e = 1 1 . 7 %
A
1 2 5
1 0 0
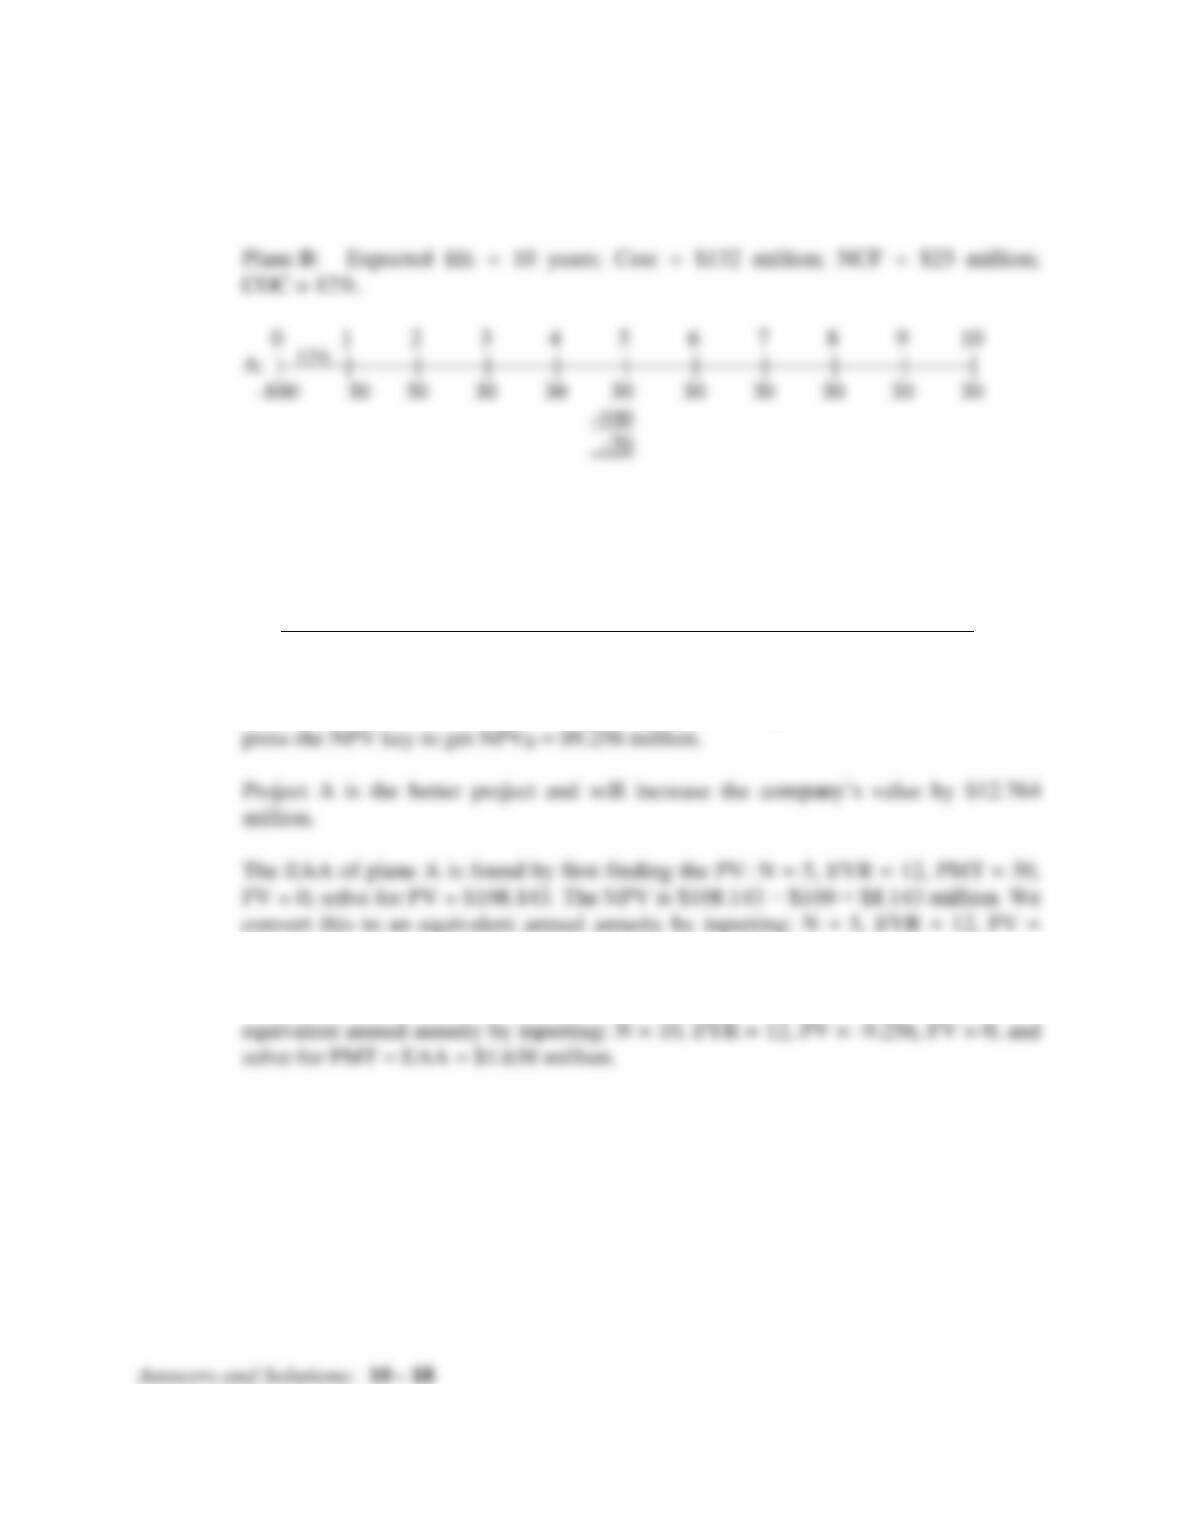
10-16 Plane A: Expected life = 5 years; Cost = $100 million; NCF = $30 million;
COC = 12%.
Enter these values into the cash flow register: CF0 = -100; CF1-4 = 30; CF5 = -70;
CF6-10 = 30. Then enter I/YR = 12, and press the NPV key to get NPVA = $12.764
million.
0 1 2 3 4 5 6 7 8 9 10
B: | | | | | | | | | | |
-132 25 25 25 25 25 25 25 25 25 25
Enter these cash flows into the cash flow register, along with the interest rate, and
-8.143, FV = 0, and solve for PMT = EAA = $2.259 million.
For plane B, we already found the NPV of $9.256 million. We convert this to an
12%
Answers and Solutions: 10 – 19
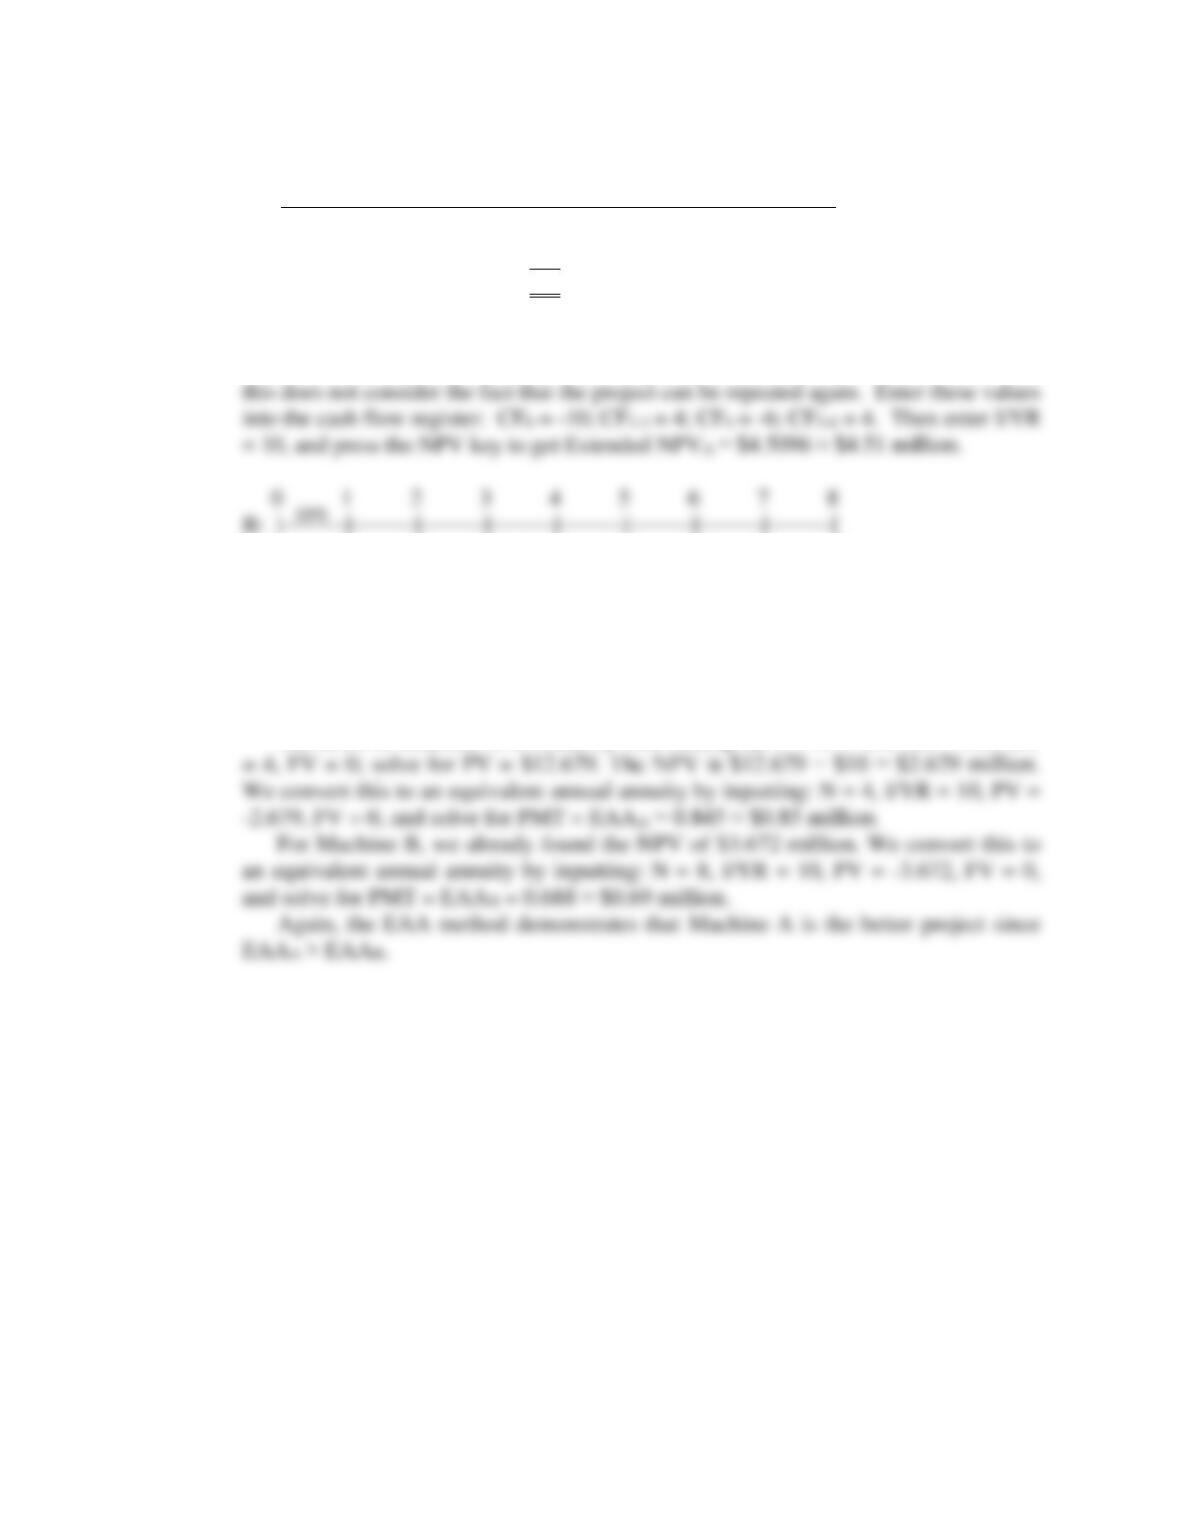
10-17 0 1 2 3 4 5 6 7 8
A: | | | | | | | | |
-10 4 4 4 4 4 4 4 4
-10
-6
Machine A’s simple NPV is calculated as follows: Enter CF0 = -10 and CF1-4 = 4.
Then enter I/YR = 10, and press the NPV key to get NPVA = $2.679 million. However,
-15 3.5 3.5 3.5 3.5 3.5 3.5 3.5 3.5
For Machine B’s NPV, enter these cash flows into the cash flow register, along with
the interest rate, and press the NPV key to get NPVB = $3.672 ≈ $3.67 million.
Machine A is the better project and will increase the company’s value by $4.51
million.
The EAA of Machine A is found by first finding the PV: N = 4, I/YR = 10, PMT
10%
14%
Answers and Solutions: 10 – 20
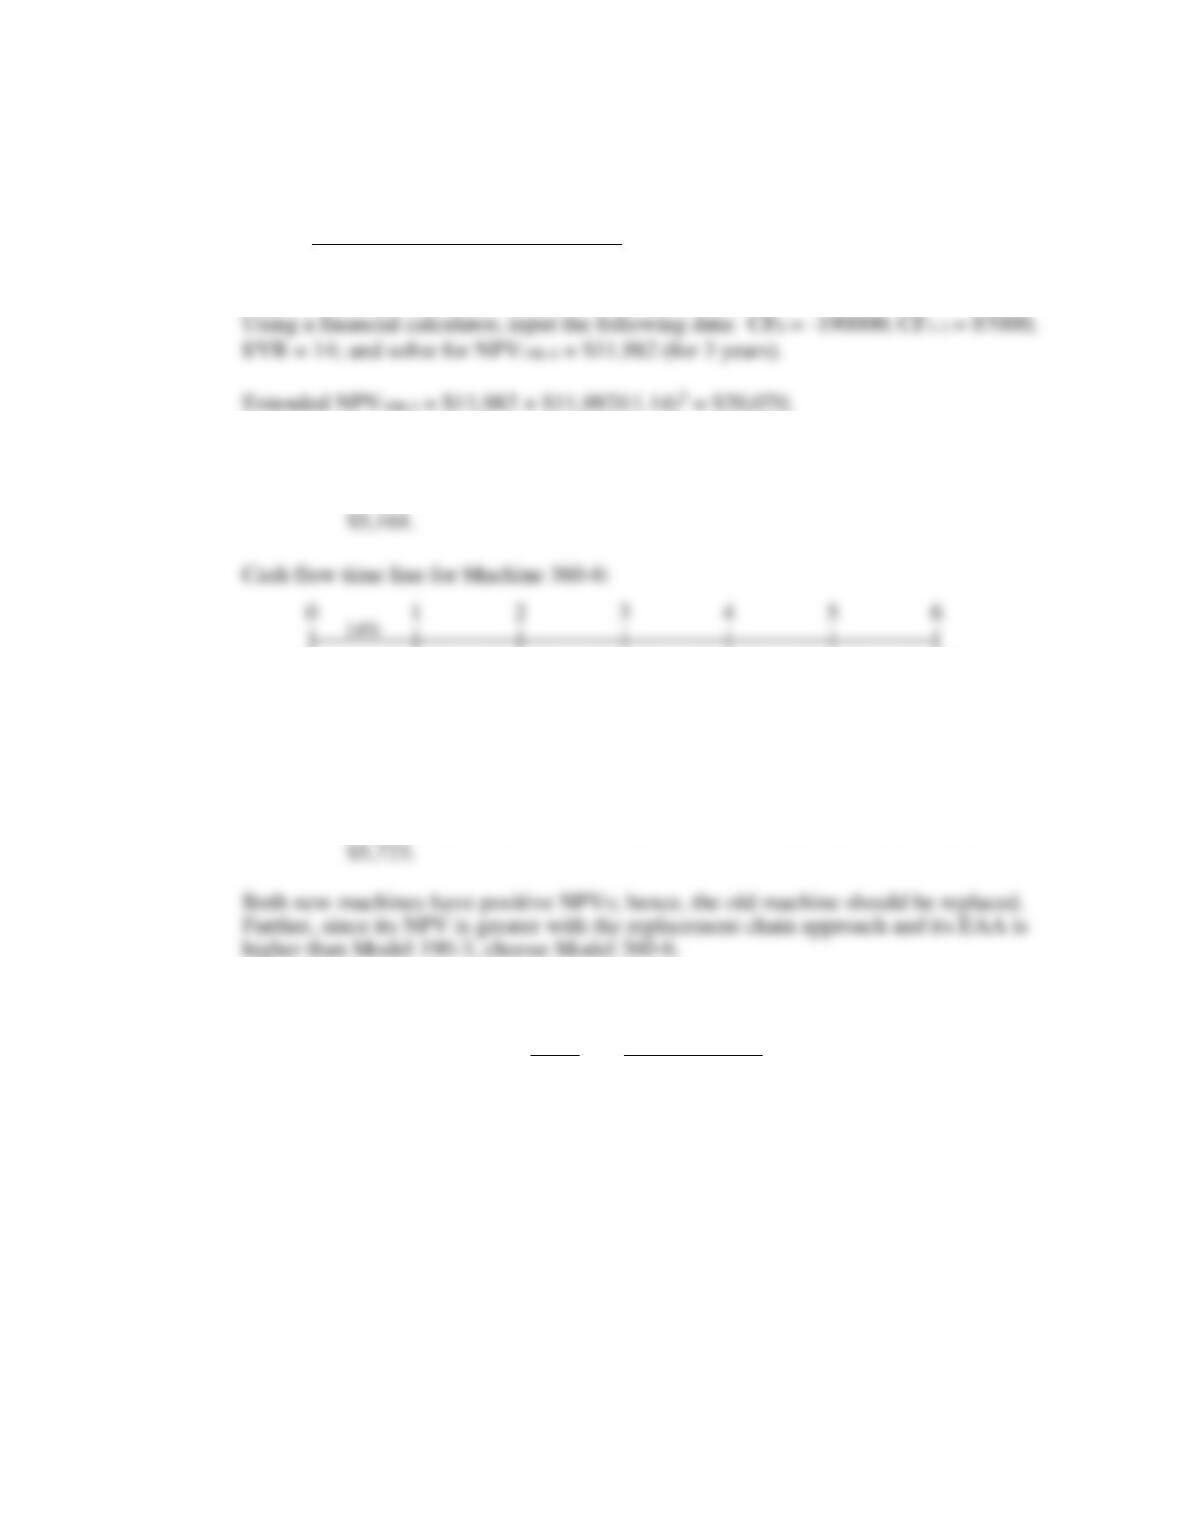
10-18 Cash flow time line for Machine 190-3:
0 1 2 3
| | | |
-190,000 87,000 87,000 87,000
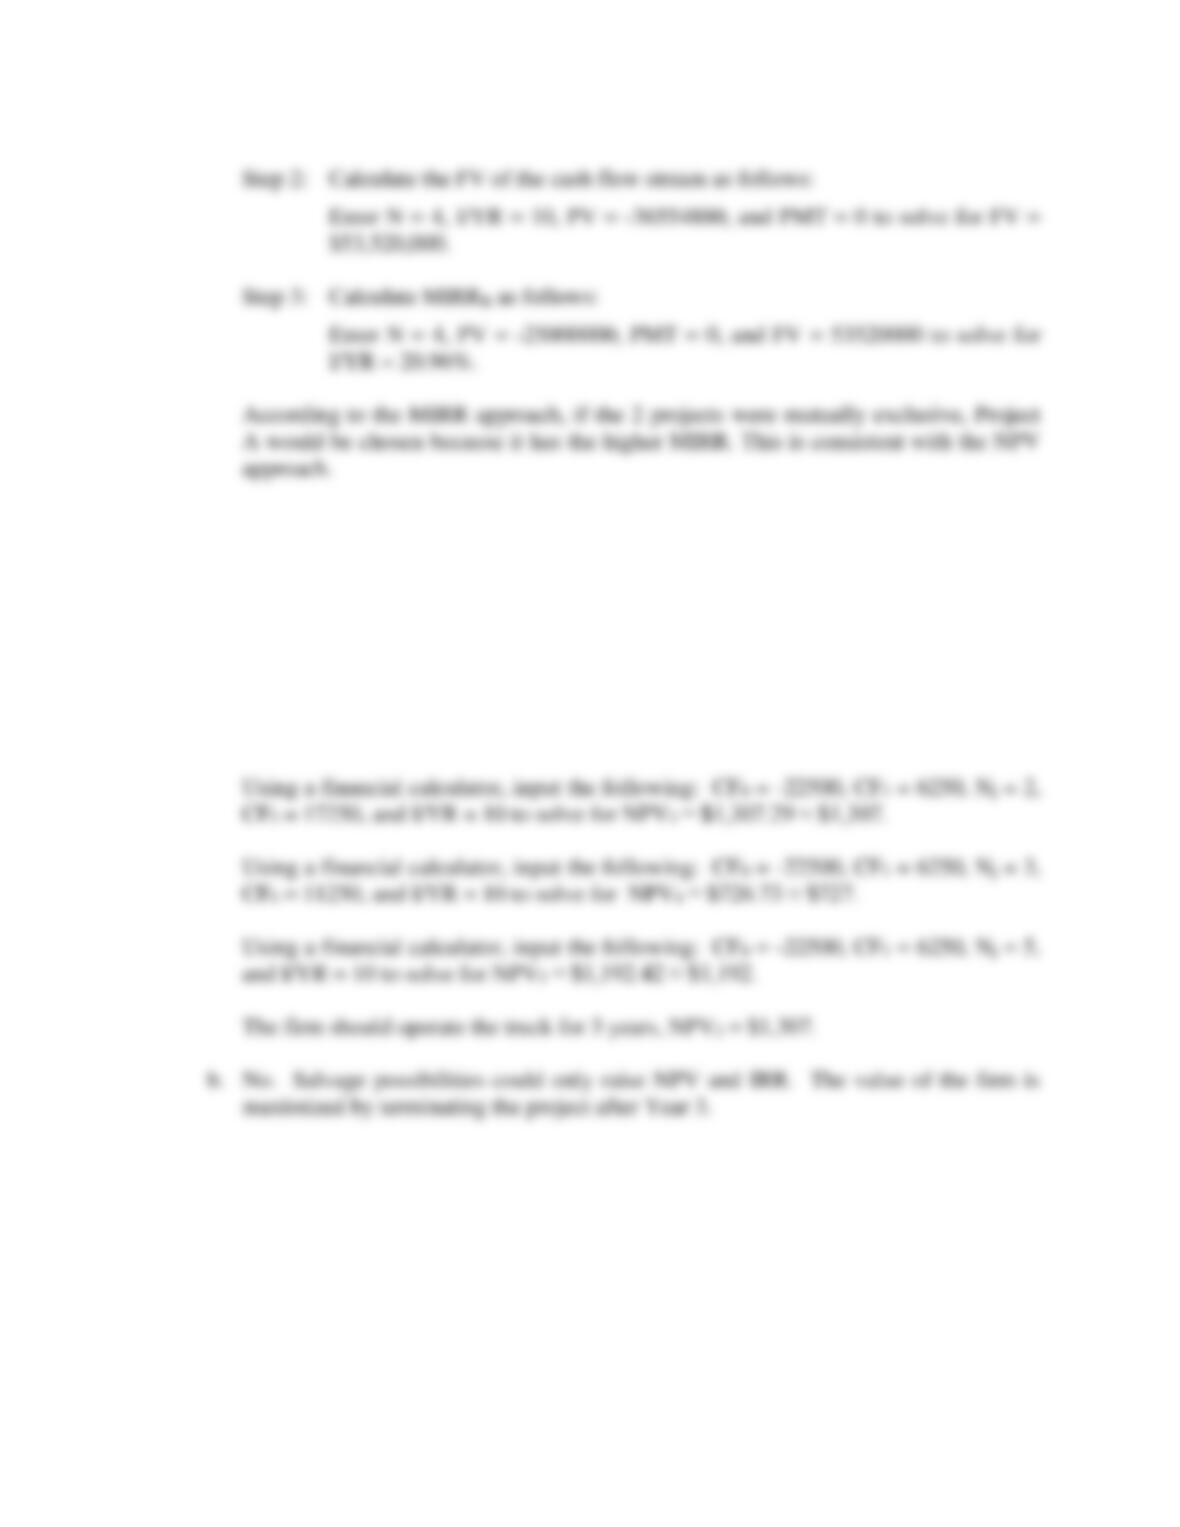
EAA190-3: Using a financial calculator, input the following data:
N = 3; I/YR = 14; PV = -11982; and FV = 0. Solve for PMT = EAA =
-360,000 98,300 98,300 98,300 98,300 98,300 98,300
Using a financial calculator, input the following data: CF0 = -360000; CF1-6 = 98300;
I/YR = 14; and solve for NPV360-6 = $22,256 (for 6 years).
EAA360-6: Using a financial calculator, input the following data:
N = 6; I/YR = 14; PV = -22256; and FV = 0. Solve for PMT = EAA =
10-19 a. The project’s expected cash flows are as follows (in millions of dollars):
Time Net Cash Flow
0 ($ 4.4)
1 27.7
2 (25.0)
14%
Answers and Solutions: 10 – 21
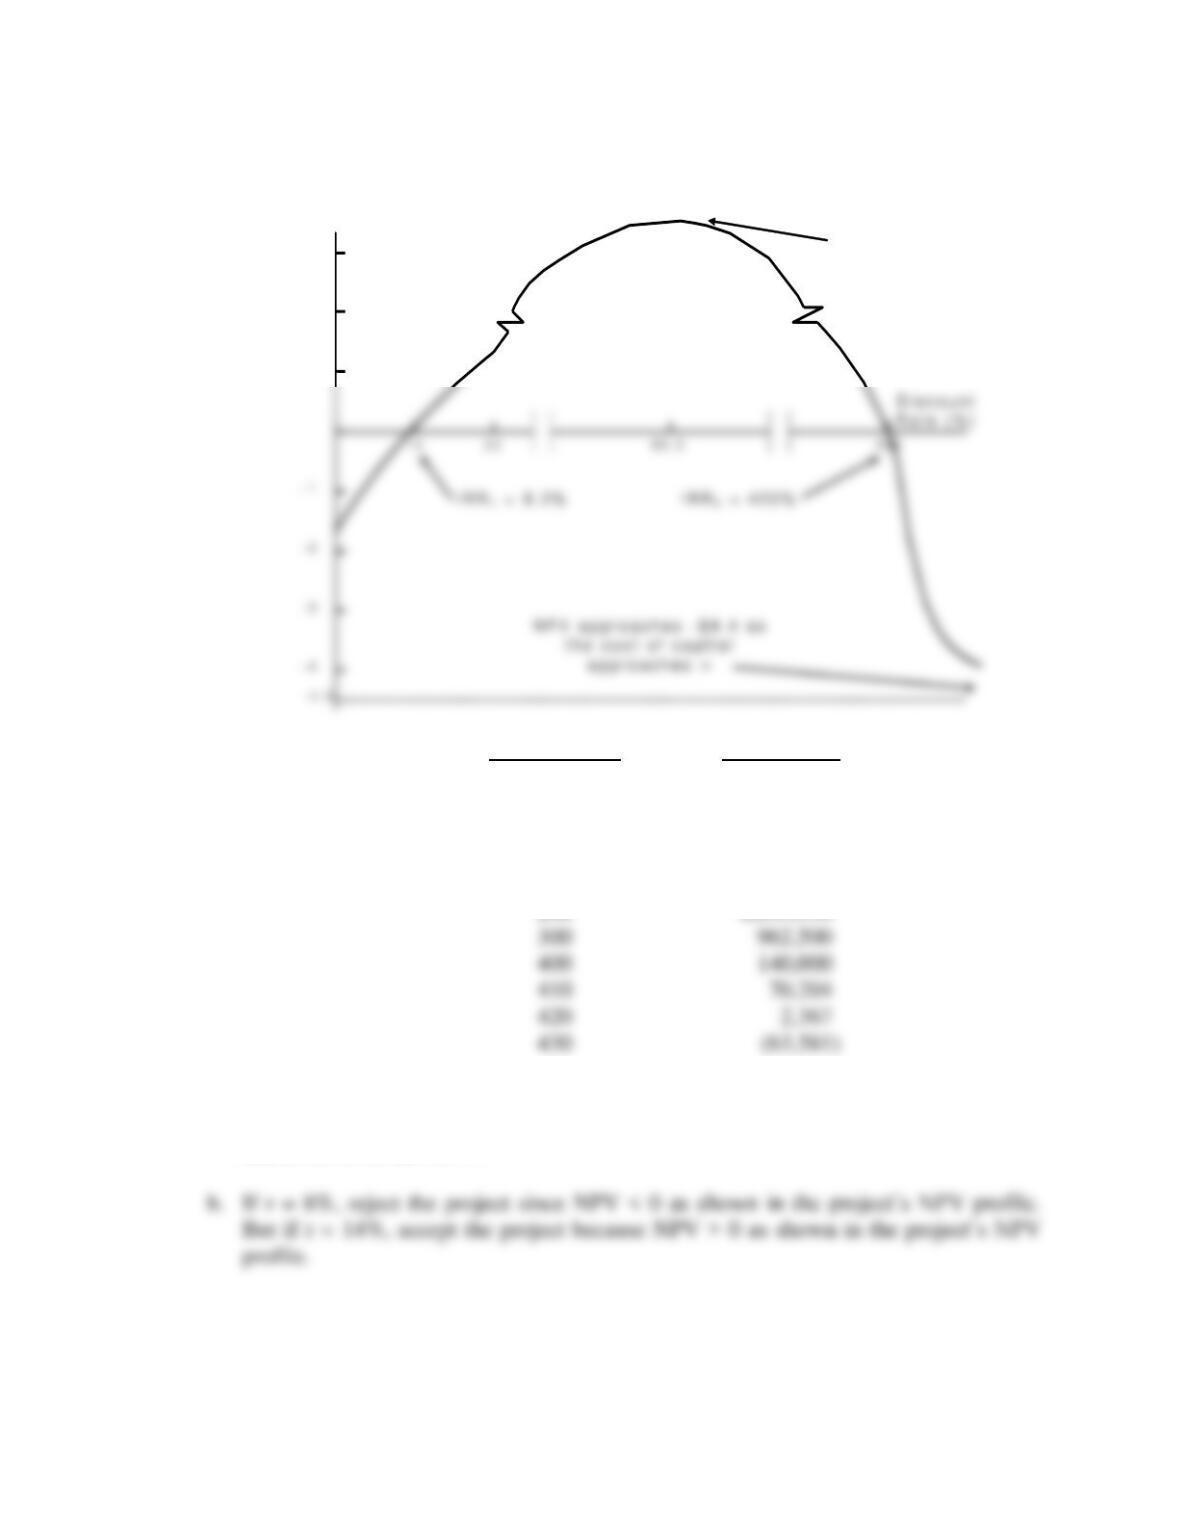
We can construct the following NPV profile:
Discount Rate NPV
0% ($1,700,000)
9 (29,156)
10 120,661
50 2,955,556
100 3,200,000
The table above was constructed using a financial calculator with the following
inputs: CF0 = -4400000, CF1 = 27700000, CF2 = -25000000, and I/YR = discount
rate to solve for the NPV.
N P V ( M i l l i o n s o f D o l l a r s )
M a x i m u m
N P V a t 8 0 . 5 %
3
2
1
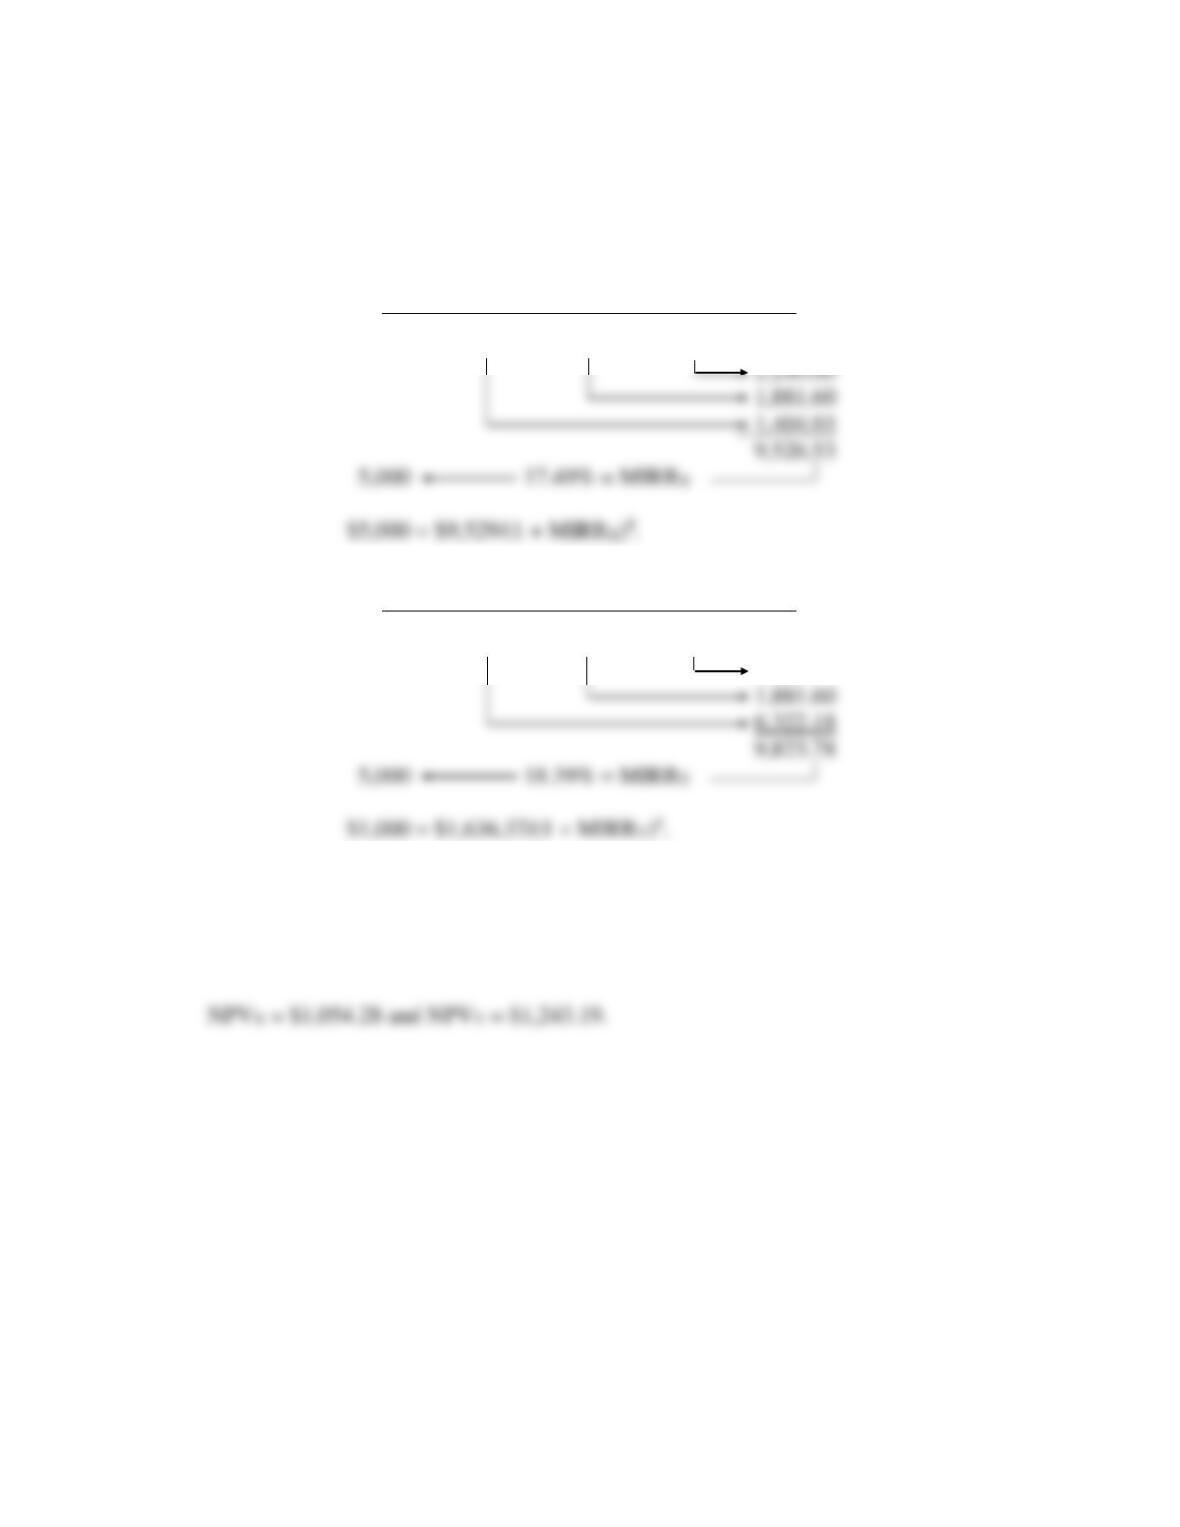
d. Here is the MIRR for the project when r = 8%:
PV costs = $4,400,000 + $25,000,000/(1.08)2 = $25,833,470.51.
TV inflows = $27,700,000(1.08)1 = $29,916,000.00.
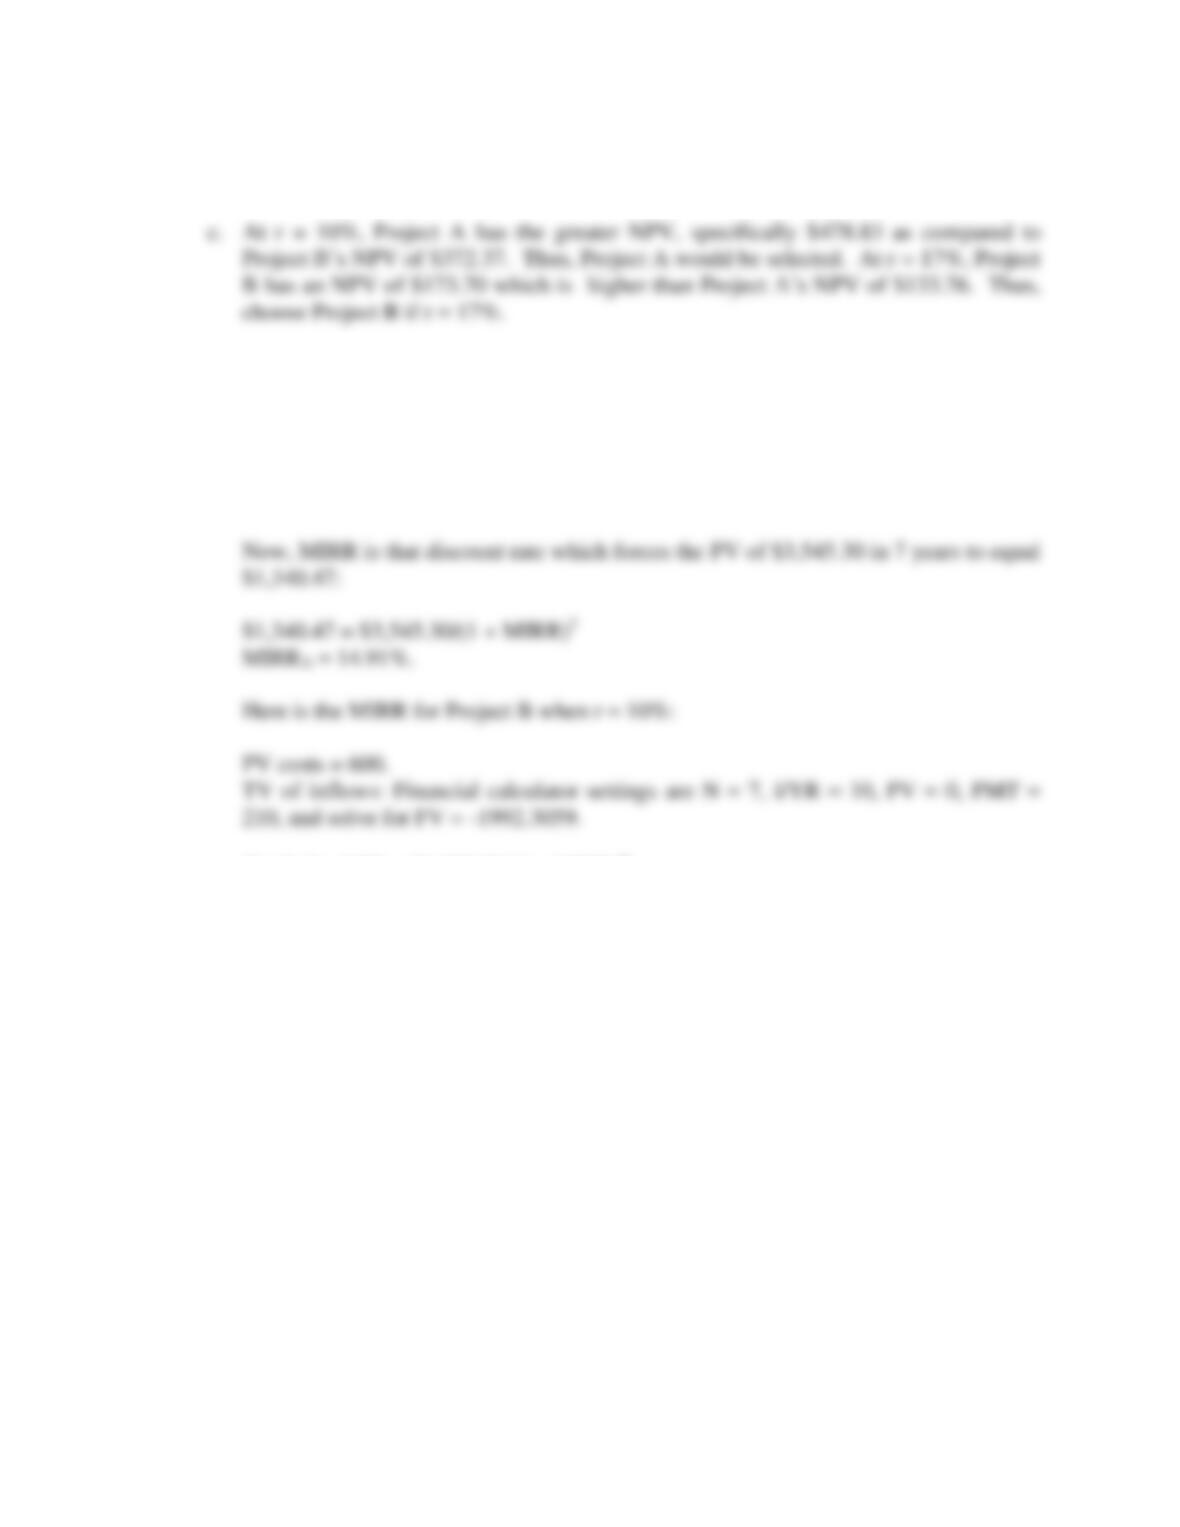
Now, MIRR is the discount rate that forces the PV of the TV of $29,916,000 over 2
years to equal $25,833,470.51:
Now, MIRR is that discount rate which forces the PV of the TV of $31,578,000 over
2 years to equal $23,636,688.21:
$23,636,688.21 = $31,578,000(PVIFr,2).
Inputs 2 -23636688.21 0 31578000
Output = 15.58
10-20 a. The IRRs of the two alternatives are undefined. To calculate an IRR, the cash flow
stream must include both cash inflows and outflows.
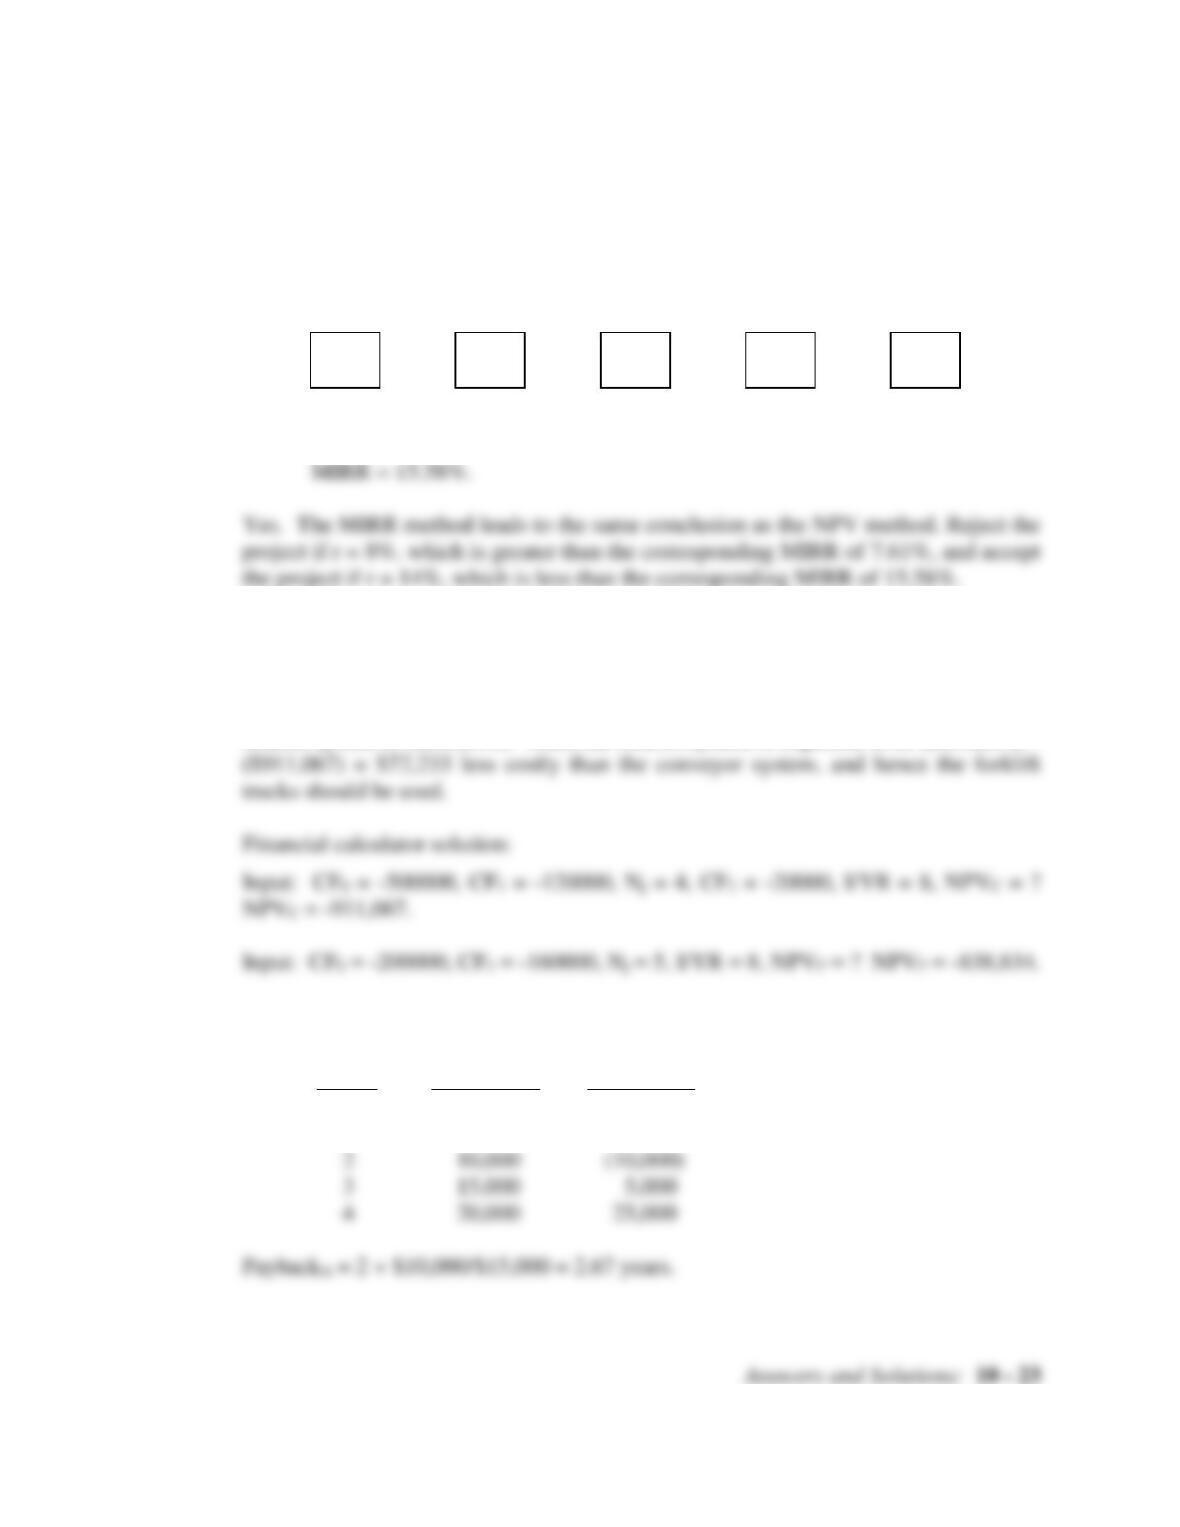
b. The PV of costs for the conveyor system is ($911,067), while the PV of costs for the
forklift system is ($838,834). Thus, the forklift system is expected to be ($838,834) –
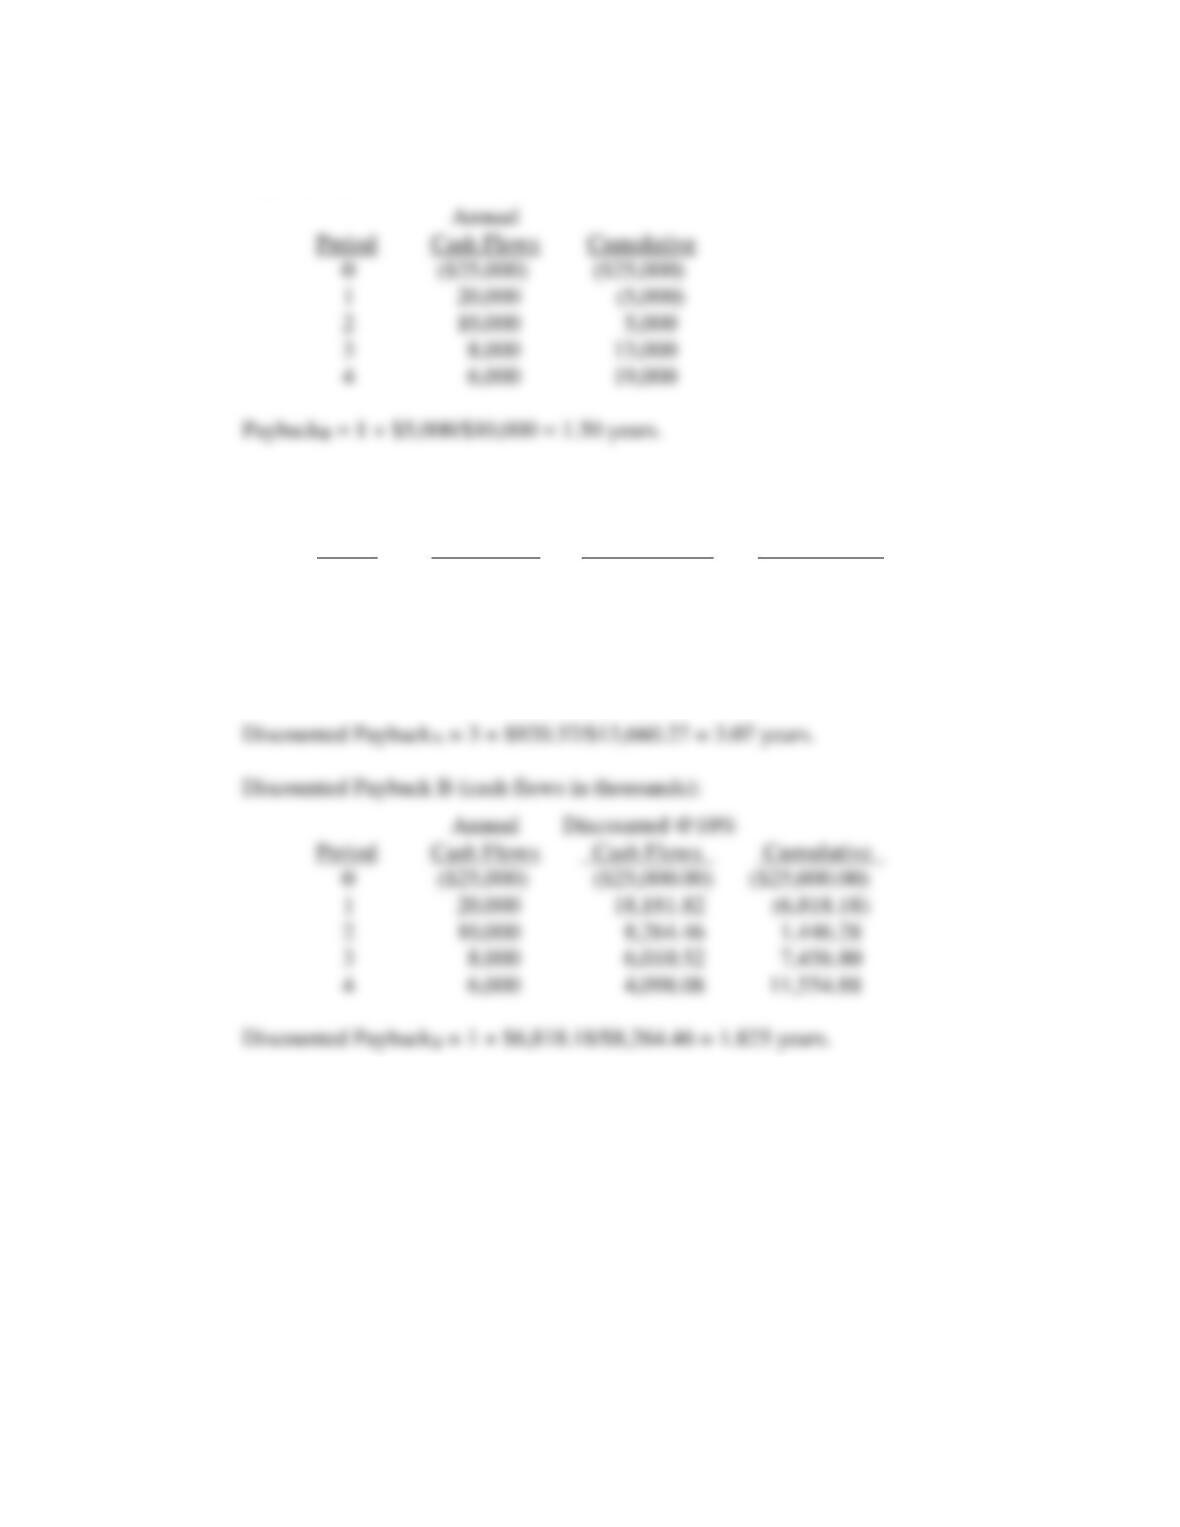
10-21 a. Payback A (cash flows in thousands):
Annual
Period Cash Flows Cumulative
0 ($25,000) ($25,000)
1 5,000 (20,000)
N
I/YR
FV
PMT
PV
Answers and Solutions: 10 – 24
Payback B (cash flows in thousands):
b. Discounted Payback A (cash flows in thousands):
Annual Discounted @10%
Period Cash Flows Cash Flows Cumulative
0 ($25,000) ($25,000.00) ($25,000.00)
1 5,000 4,545.45 (20,454.55)
2 10,000 8,264.46 (12,190.09)
3 15,000 11,269.72 (920.37)
4 20,000 13,660.27 12,739.90
Discounted PaybackA = 3 + $920.37/$13,660.27 = 3.07 years.
c. NPVA = $12,739,908; IRRA = 27.27%.
NPVB = $11,554,880; IRRB = 36.15%.
Both projects have positive NPVs, so both projects should be undertaken.
Answers and Solutions: 10 – 25
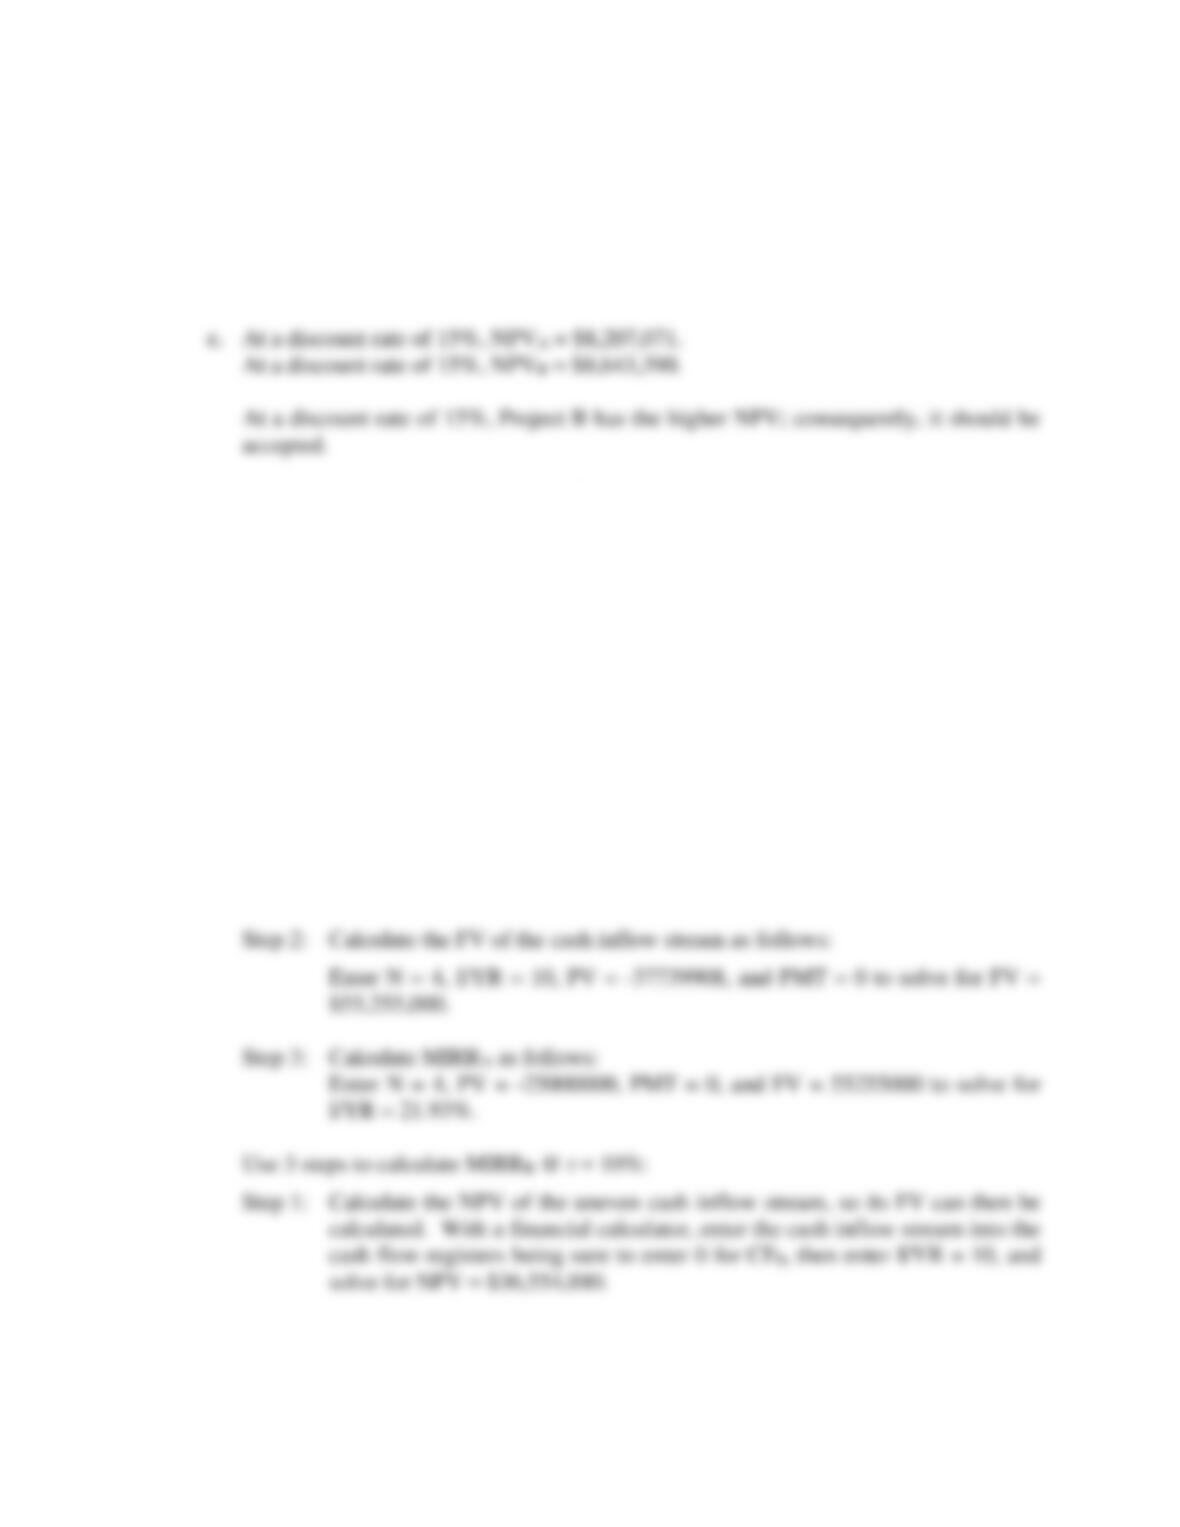
d. At a discount rate of 5%, NPVA = $18,243,813.
At a discount rate of 5%, NPVB = $14,964,829.
At a discount rate of 5%, Project A has the higher NPV; consequently, it should be
accepted.
Year CFA – CFB
0 $ 0
1 (15)
2 0
3 7
4 14
IRR∆ = Crossover rate = 13.5254% ≈ 13.53%.
g. Use 3 steps to calculate MIRRA @ r = 10%:
Step 1: Calculate the NPV of the uneven cash inflow stream, so its FV can then be
calculated. With a financial calculator, enter the cash inflow stream into the
cash flow registers being sure to enter 0 for CF0, then enter I/YR = 10, and
solve for NPV = $37,739,908.
Answers and Solutions: 10 – 26
10-22 a. NPV of termination after Year t:
NPV0 = -$22,500 + $22,500 = 0.
Using a financial calculator, input the following: CF0 = -22500, CF1 = 23750, and
I/YR = 10 to solve for NPV1 = –$909.09 ≈ -$909.
Using a financial calculator, input the following: CF0 = -22500, CF1 = 6250, CF2 =
20250, and I/YR = 10 to solve for NPV2 = –$82.64 ≈ -$83.

Answers and Solutions: 10 – 27
SOLUTION TO SPREADSHEET PROBLEM
10-23 The detailed solution for the problem is available in the file Solution for Ch10 P23 Build
a Model.xls at the textbook’s Web site.
Mini Case: 10 – 28
MINI CASE
You have just graduated from the MBA program of a large university, and one of your
favorite courses was “Today’s Entrepreneurs.” In fact, you enjoyed it so much you have
decided you want to “be your own boss.” While you were in the master’s program, your
grandfather died and left you $1 million to do with as you please. You are not an inventor
and you do not have a trade skill that you can market; however, you have decided that you
would like to purchase at least one established franchise in the fast-foods area, maybe two
(if profitable). The problem is that you have never been one to stay with any project for
too long, so you figure that your time frame is three years. After three years you will sell
off your investment and go on to something else.
Here are the net cash flows (in thousands of dollars):
Expected Net Cash Flows
Year Franchise L Franchise S
0 ($100) ($100)
1 10 70
2 60 50
3 80 20
Depreciation, salvage values, net working capital requirements, and tax effects are all
included in these cash flows.
Mini Case: 10 – 29
a. What is capital budgeting?
Answer: Capital budgeting is the process of analyzing additions to fixed assets. Capital
b. What is the difference between independent and mutually exclusive projects?
Answer: Projects are independent if the cash flows of one are not affected by the acceptance of
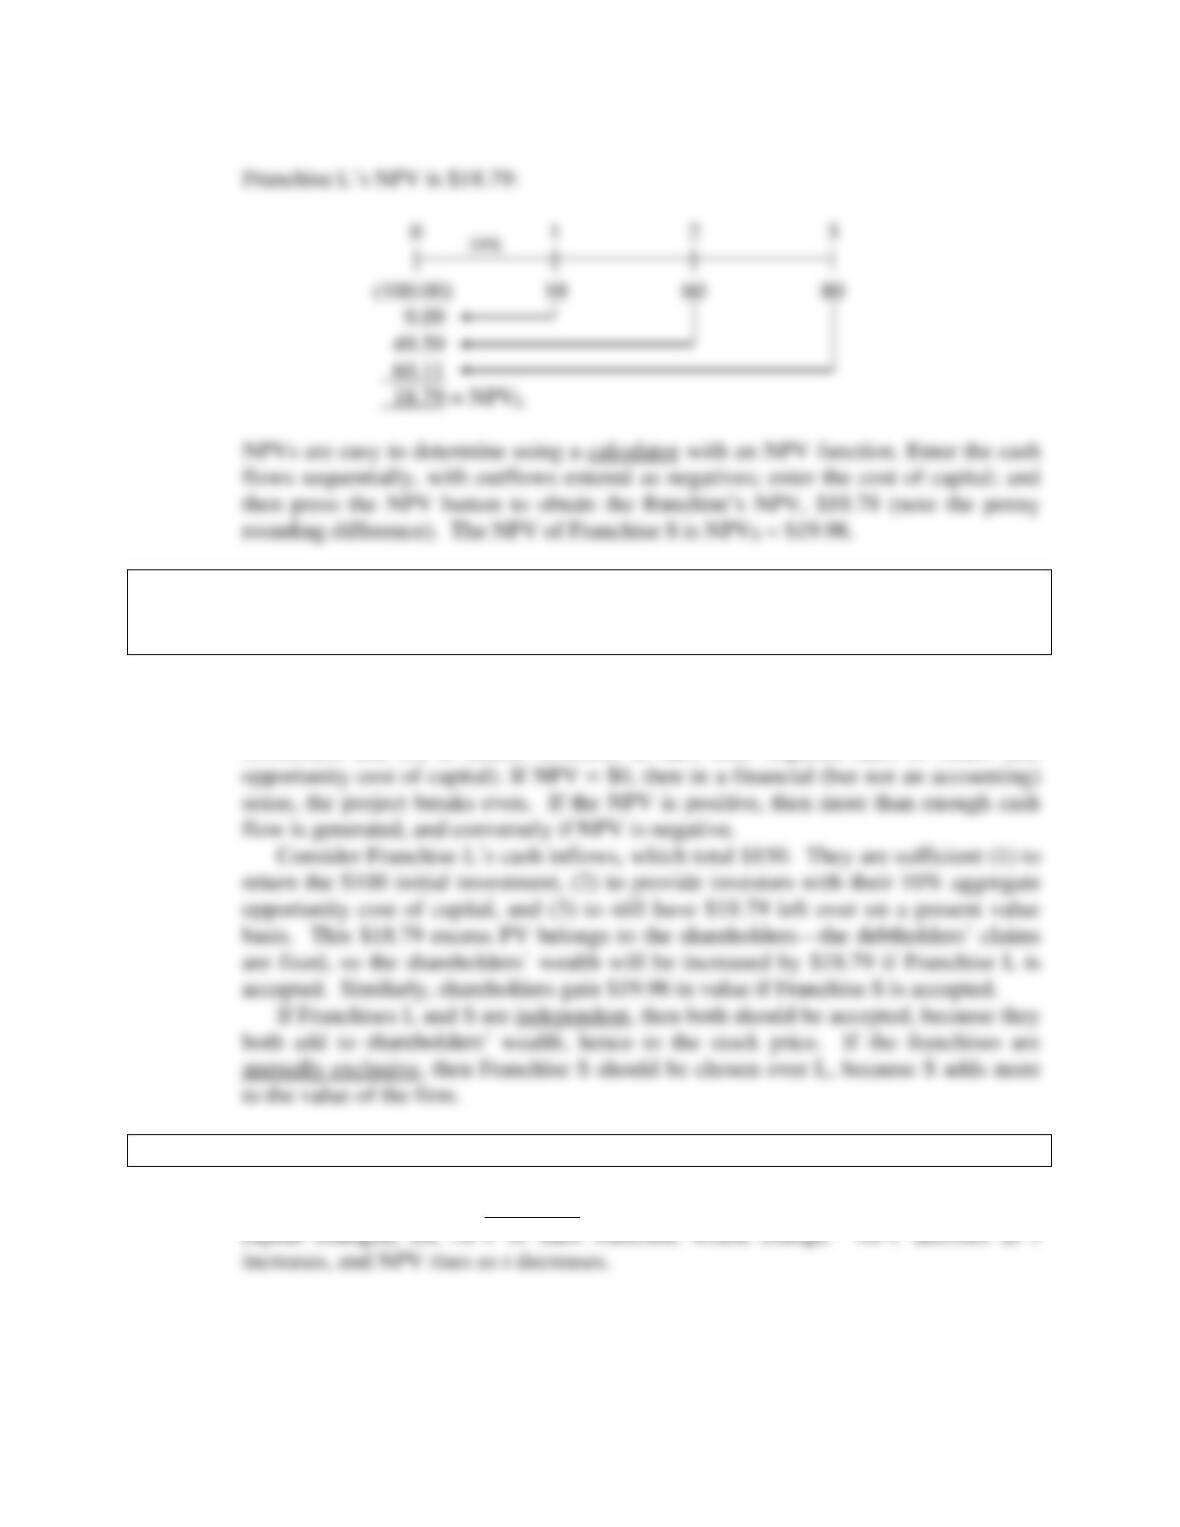
c. 1. Define the term net present value (NPV). What is each franchise’s NPV?
Answer: The net present value (NPV) is simply the sum of the present values of a project’s
cash flows:
Mini Case: 10 – 30
c. 2. What is the rationale behind the NPV method? According to NPV, which
franchise or franchises should be accepted if they are independent? Mutually
exclusive?
Answer: The rationale behind the NPV method is straightforward: if a project has NPV = $0,
then the project generates exactly enough cash flows (1) to recover the cost of the
investment and (2) to enable investors to earn their required rates of return (the
c. 3. Would the NPVs change if the cost of capital changed?
Answer: The NPV of a project is dependent on the cost of capital used. Thus, if the cost of
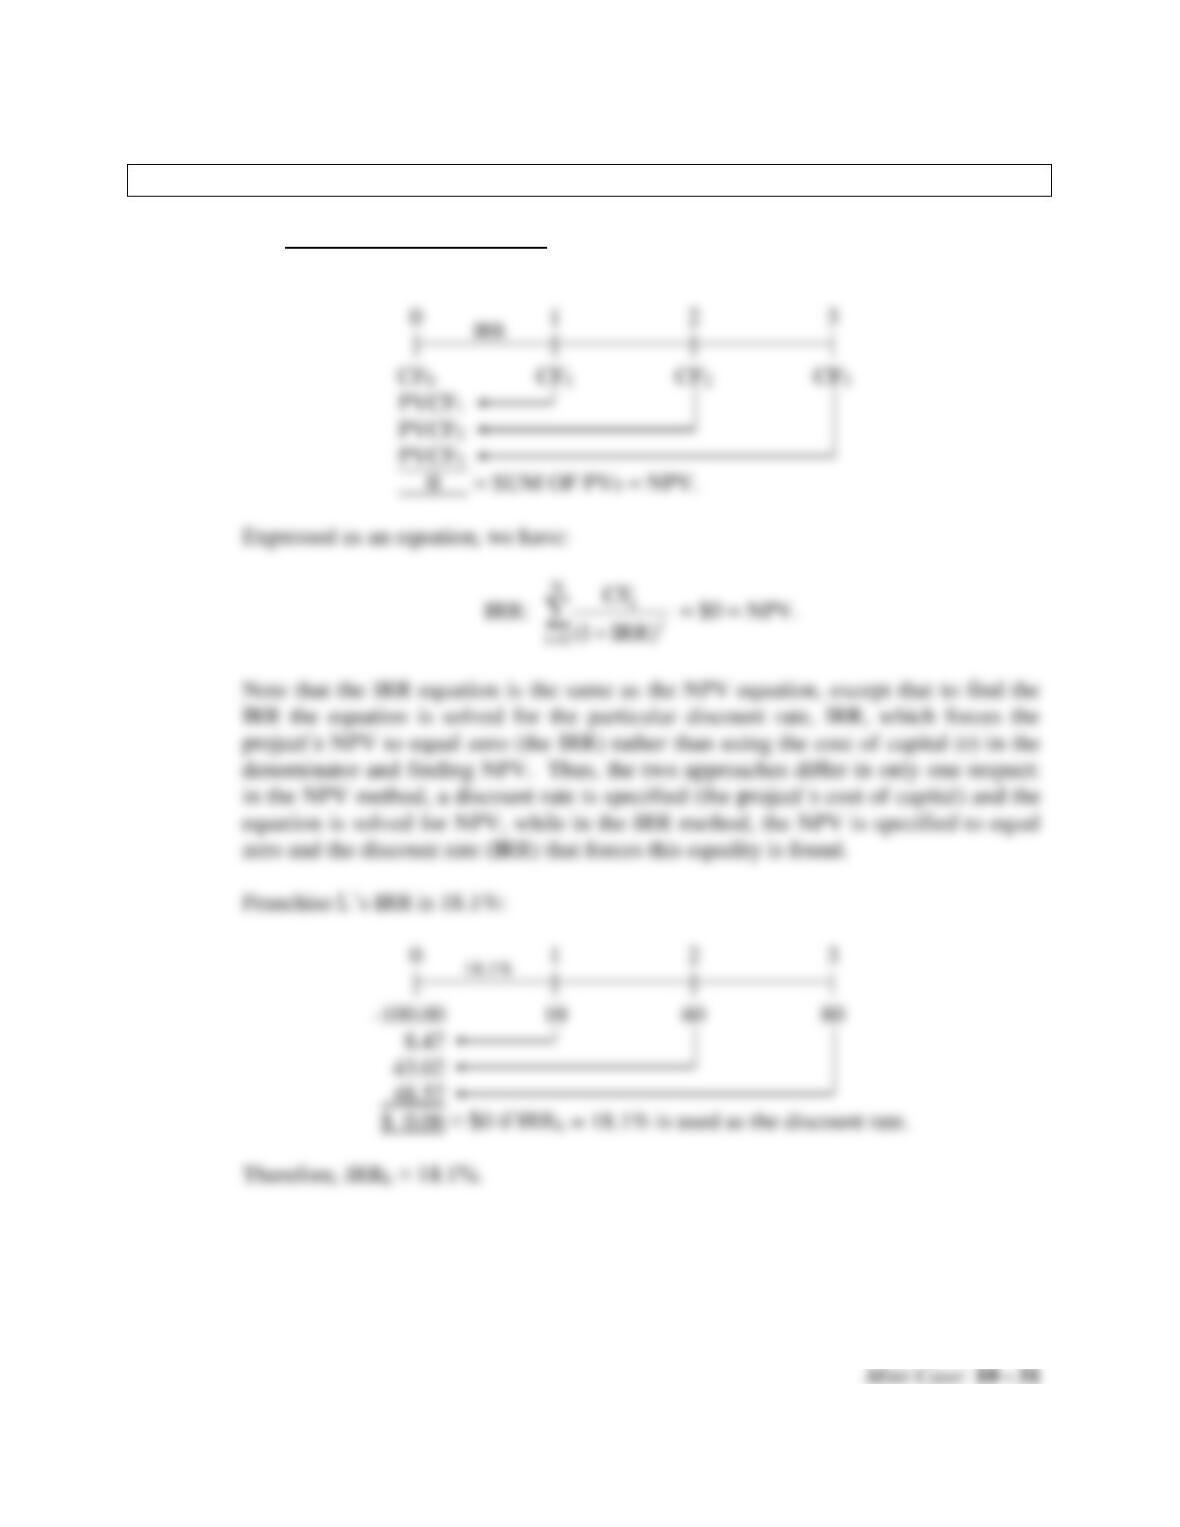
d. 1. Define the term internal rate of return (IRR). What is each franchise’s IRR?
Answer: The internal rate of return (IRR) is the discount rate that forces the NPV of a project
to equal zero:
Mini Case: 10 – 32
d. 2. How is the IRR on a project related to the YTM on a bond?
Answer: The IRR is to a capital project what the YTM is to a bond. It is the expected rate of
return on the project, just as the YTM is the promised rate of return on a bond.
d. 3. What is the logic behind the IRR method? According to IRR, which franchises
should be accepted if they are independent? Mutually exclusive?
Answer: IRR measures a project’s profitability in the rate of return sense: If a project’s IRR
equals its cost of capital, then its cash flows are just sufficient to provide investors
d. 4. Would the franchises’ IRRs change if the cost of capital changed?
Answer: IRRs are independent of the cost of capital. Therefore, neither IRRS nor IRRL would
Mini Case: 10 – 33
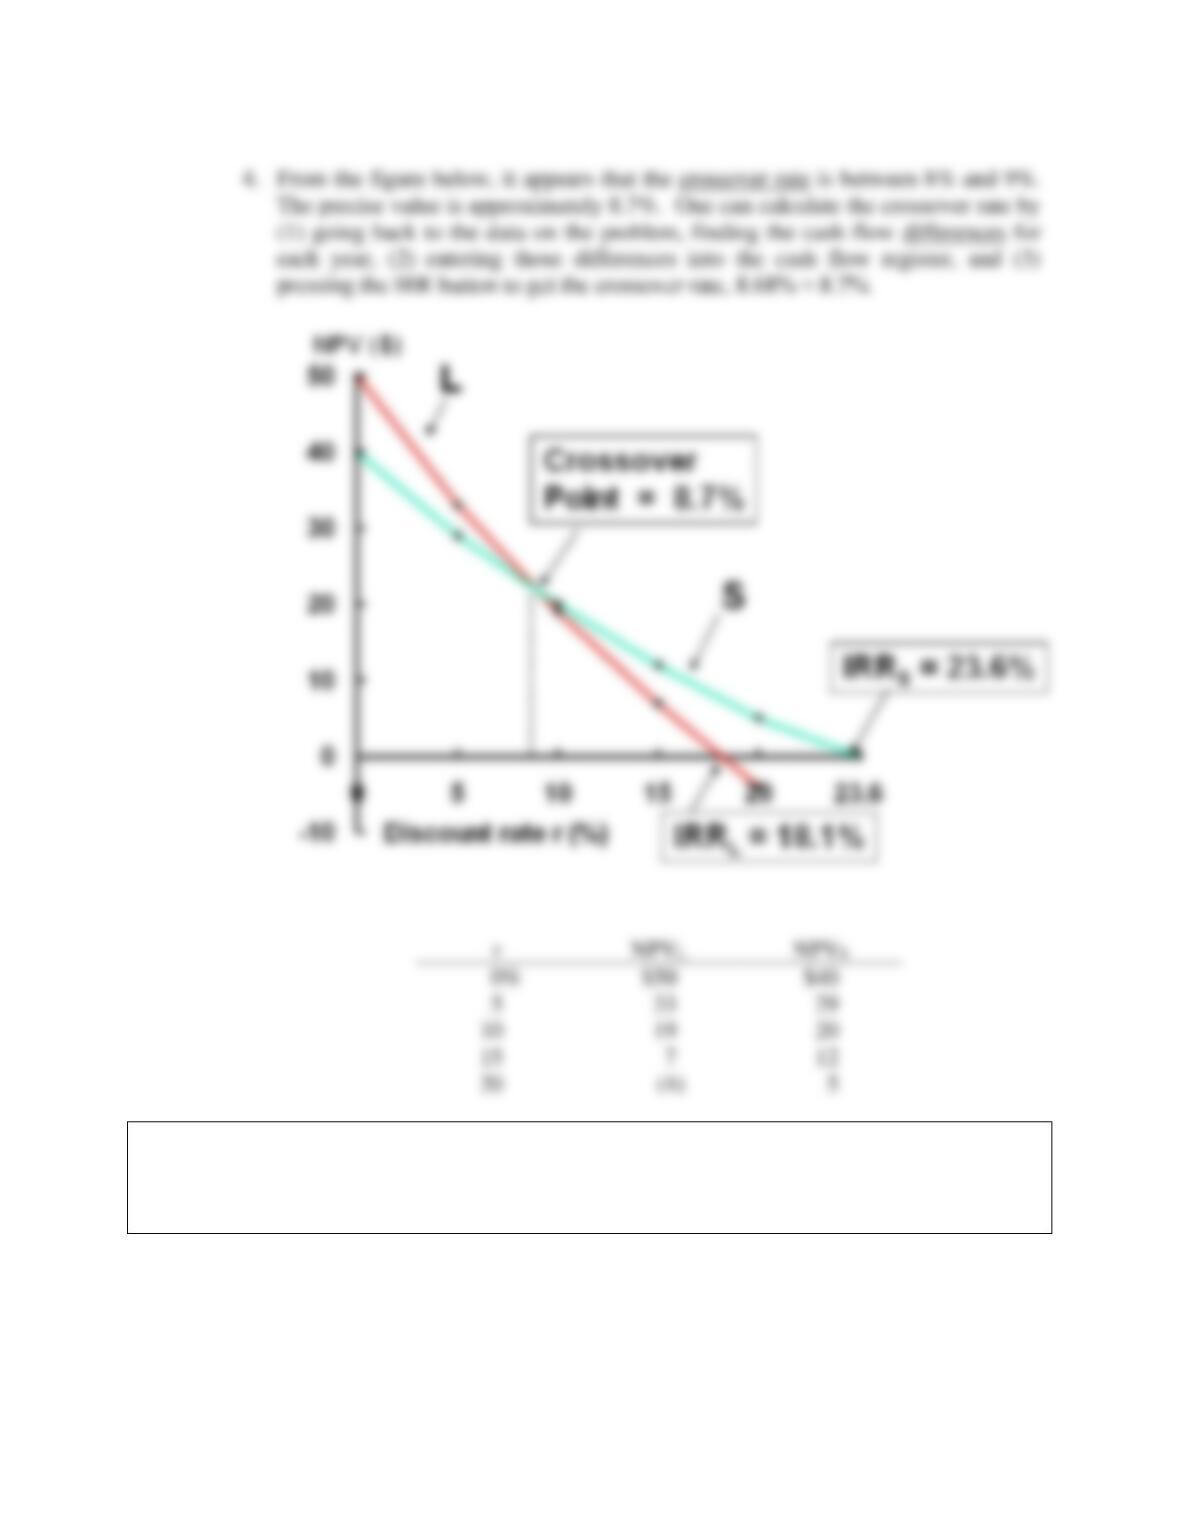
e. 1. Draw NPV profiles for Franchises L and S. At what discount rate do the profiles
cross?
Answer: The NPV profiles are plotted in the figure below.
Mini Case: 10 – 34
e. 2. Look at your NPV profile graph without referring to the actual NPVs and IRRs.
Which franchise or franchises should be accepted if they are independent?
Mutually exclusive? Explain. Are your answers correct at any cost of capital
less than 23.6%?
Mini Case: 10 – 35
Answer: The NPV profiles show that the IRR and NPV criteria lead to the same accept/reject
decision for any independent project. Consider Franchise L. It intersects the X-axis
f. What is the underlying cause of ranking conflicts between NPV and IRR?
Answer: For normal projects’ NPV profiles to cross, one project must have both a higher
vertical axis intercept and a steeper slope than the other. A project’s vertical axis
Mini Case: 10 – 36
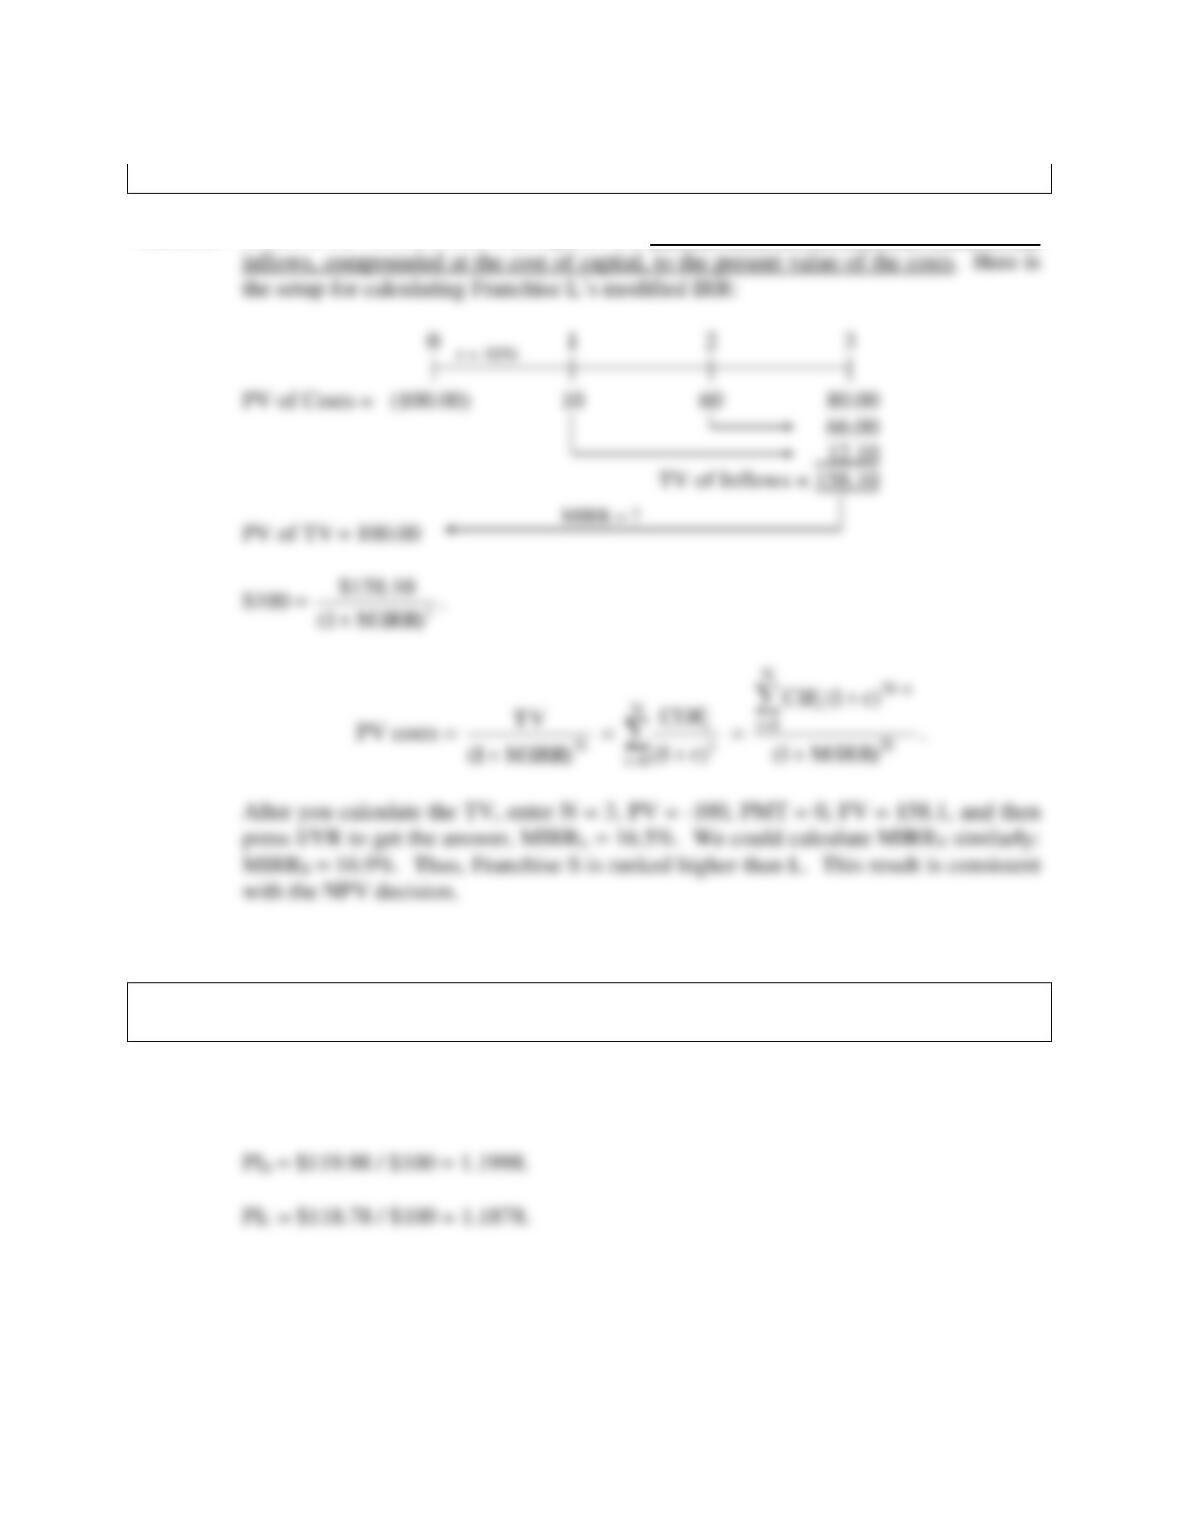
g. Define the term modified IRR (MIRR). Find the MIRRs for Franchises L and S.
Answer: MIRR is the discount rate that equates the present value of the terminal value of the
h. What does the profitability index (PI) measure? What are the PI’s for
Franchises S and L?
Answer: The PI is equal to the present value of all future cash flows divided by the initial cost.
It measures the “bang for the buck.”
Mini Case: 10 – 37
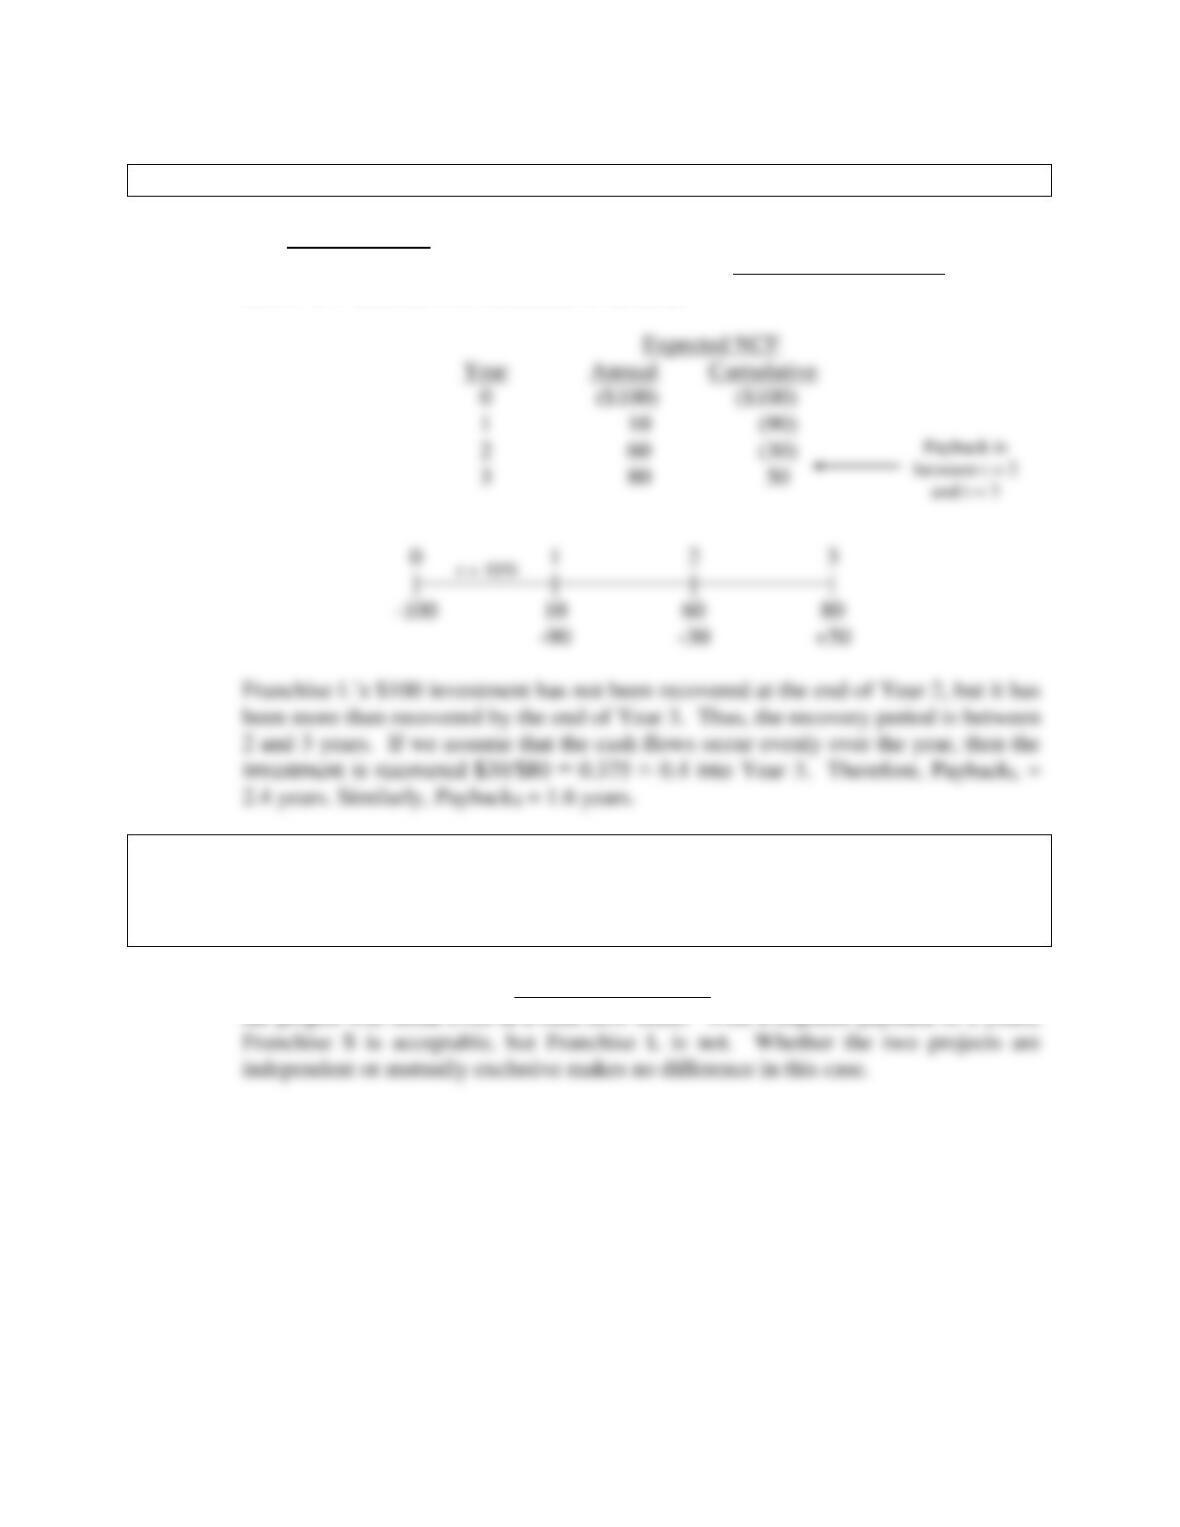
i. 1. What is the payback period? Find the paybacks for Franchises L and S.
Answer: The payback period is the expected number of years required to recover a project’s
cost. We calculate the payback by developing the cumulative cash flows as shown
below for Franchise L (in thousands of dollars):
i. 2. What is the rationale for the payback method? According to the payback
criterion, which franchise or franchises should be accepted if the firm’s
maximum acceptable payback is 2 years, and if Franchises L and S are
independent? If they are mutually exclusive?
Answer: Payback represents a type of “breakeven” analysis: The payback period tells us when
the project will break even in a cash flow sense. With a required payback of 2 years,
Mini Case: 10 – 38
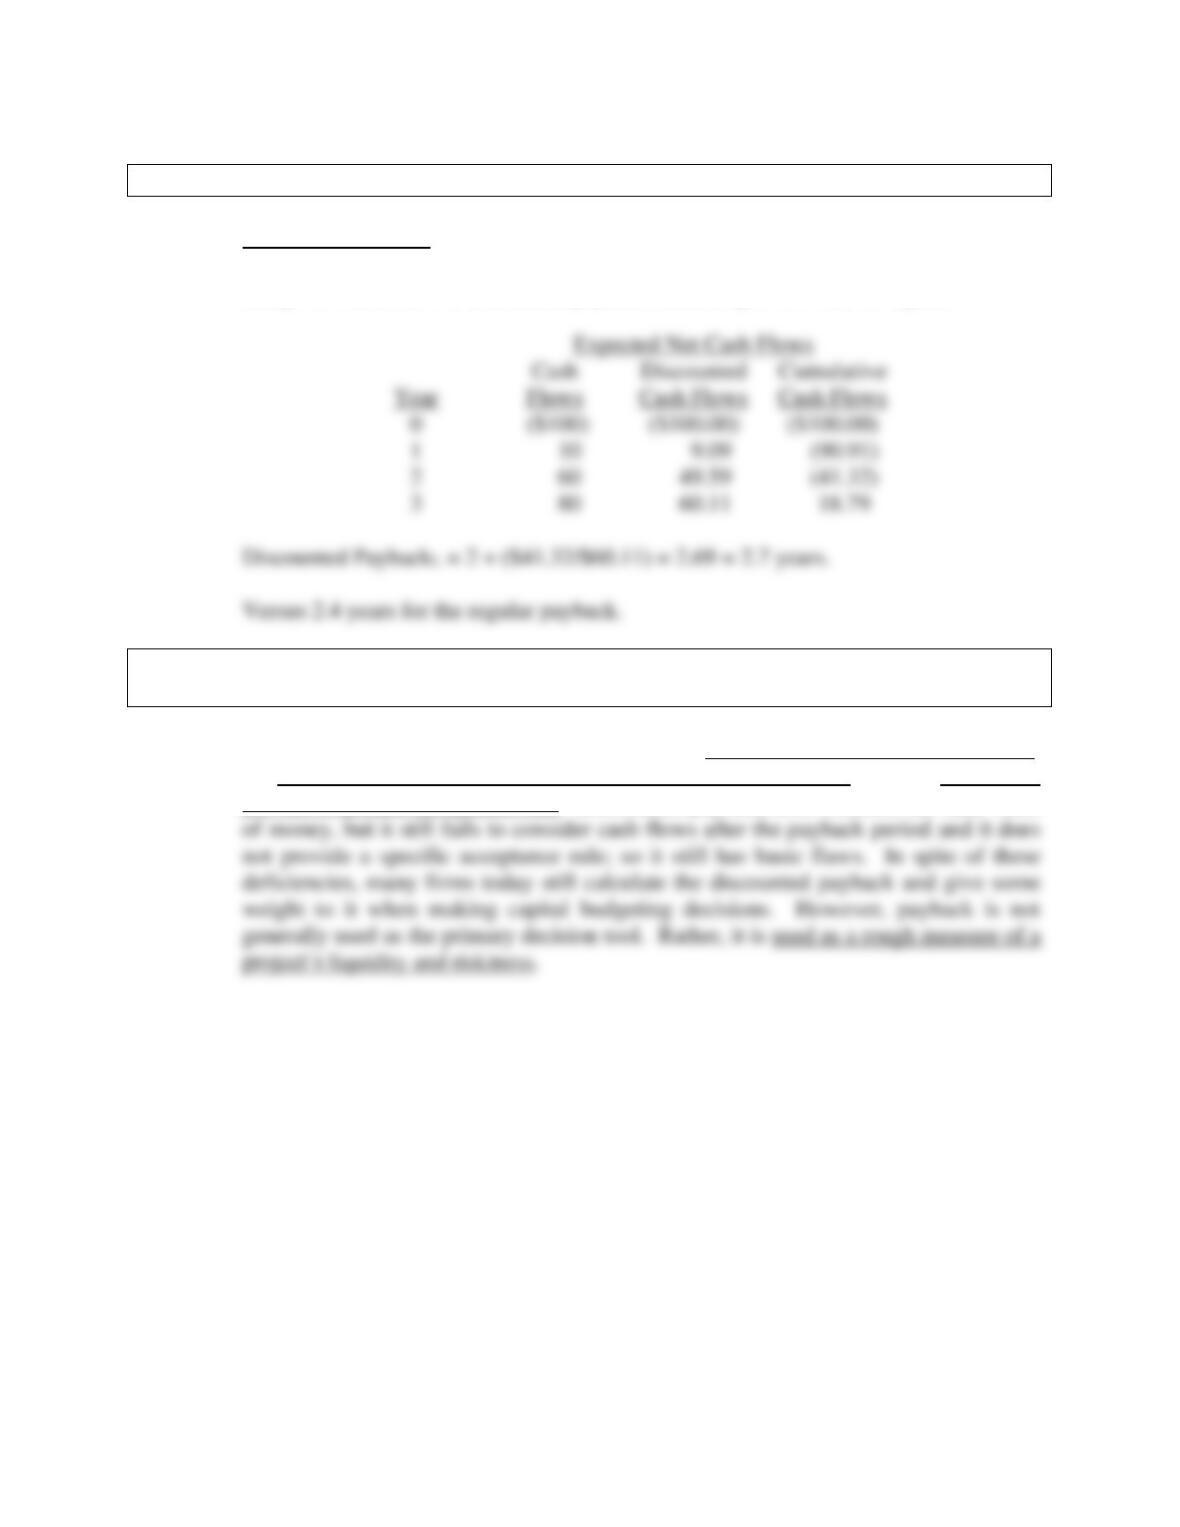
i. 3. What is the difference between the regular and discounted payback periods?
Answer: Discounted payback is similar to payback except that discounted cash flows are used.
Setup for Franchise L’s discounted payback, assuming a 10% cost of capital:
i. 4. What is the main disadvantage of discounted payback? Is the payback method
of any real usefulness in capital budgeting decisions?
Answer: Regular payback has 3 critical deficiencies: (1) It ignores the time value of money,
(2) it ignores the cash flows that occur after the payback period, and (3) it does not
provide a specific acceptance rule. Discounted payback does consider the time value
Mini Case: 10 – 39
j. As a separate project (Project P), you are considering sponsoring a pavilion at
the upcoming World’s Fair. The pavilion would cost $800,000, and it is expected
to result in $5 million of incremental cash inflows during its 1 year of operation.
However, it would then take another year, and $5 million of costs, to demolish
the site and return it to its original condition. Thus, Project P’s expected net
cash flows look like this (in millions of dollars):
Year Net Cash Flows
0 ($0.8)
1 5.0
2 (5.0)
The project is estimated to be of average risk, so its cost of capital is 10%.
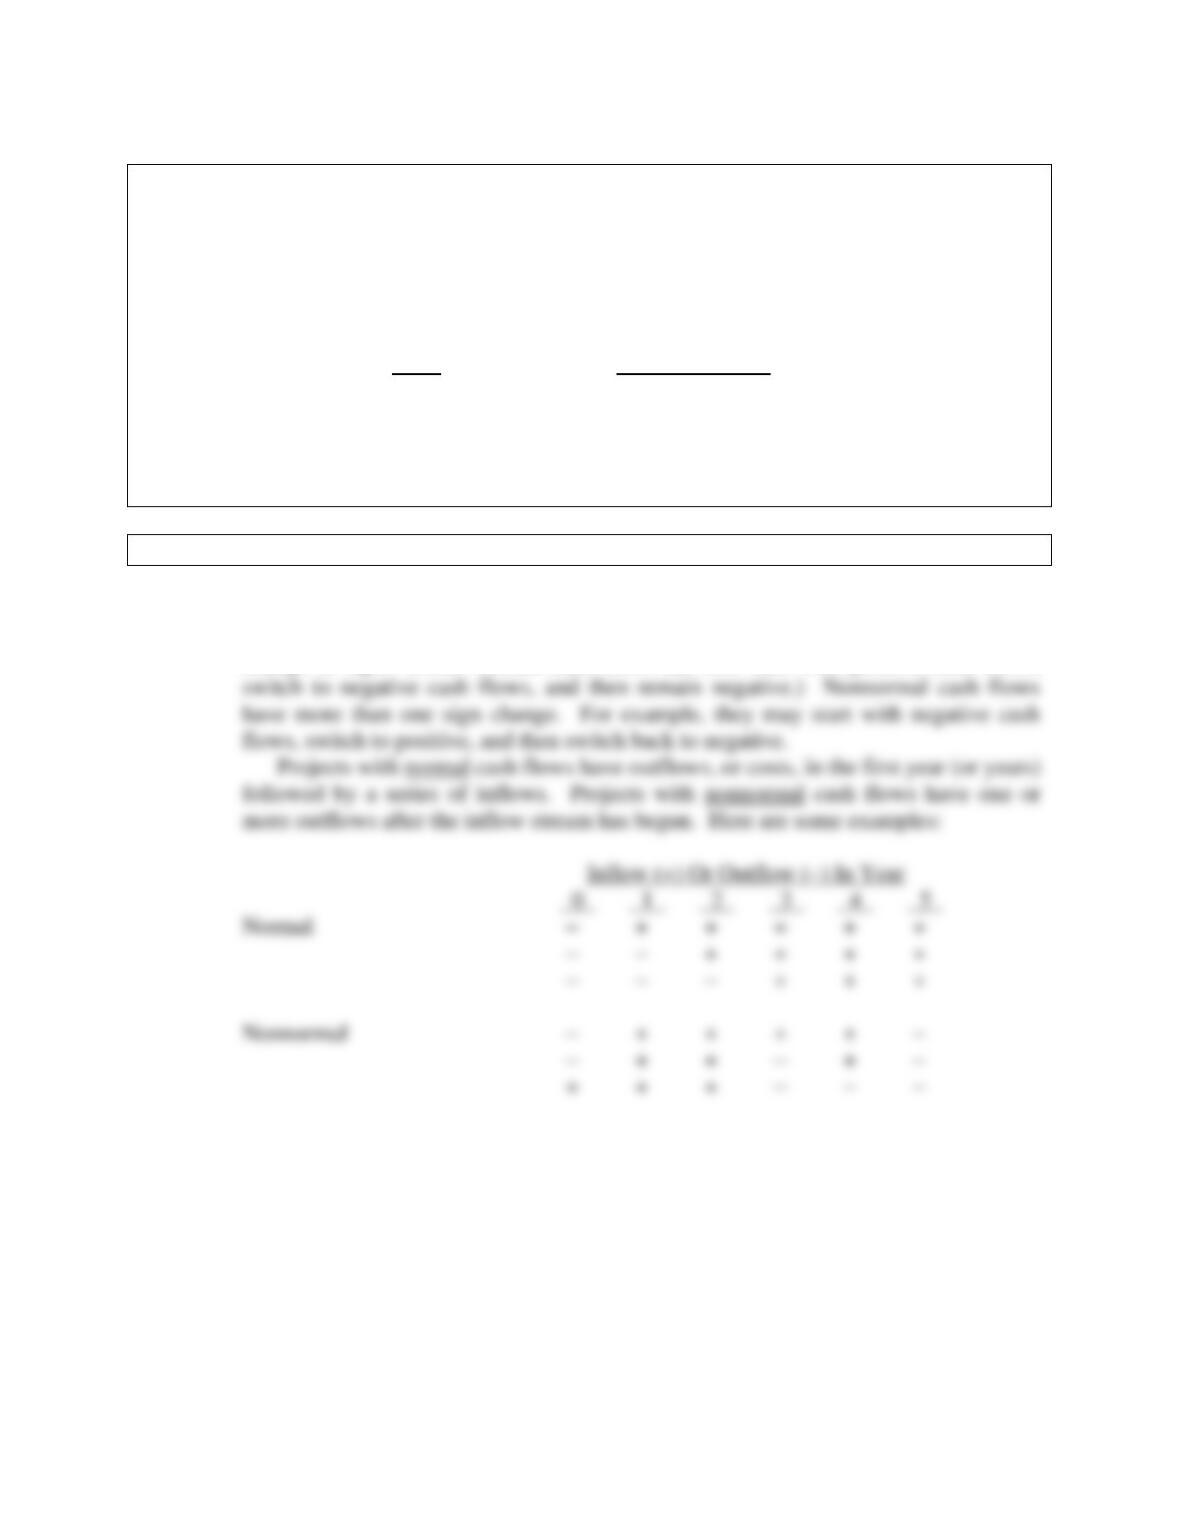
j. 1. What are normal and nonnormal cash flows?
Answer: Normal cash flows begin with a negative cash flow (or a series of negative cash
flows), switch to positive cash flows, and then remain positive. They have only one
change in sign. (Note: normal cash flows can also start with positive cash flows,
Mini Case: 10 – 40
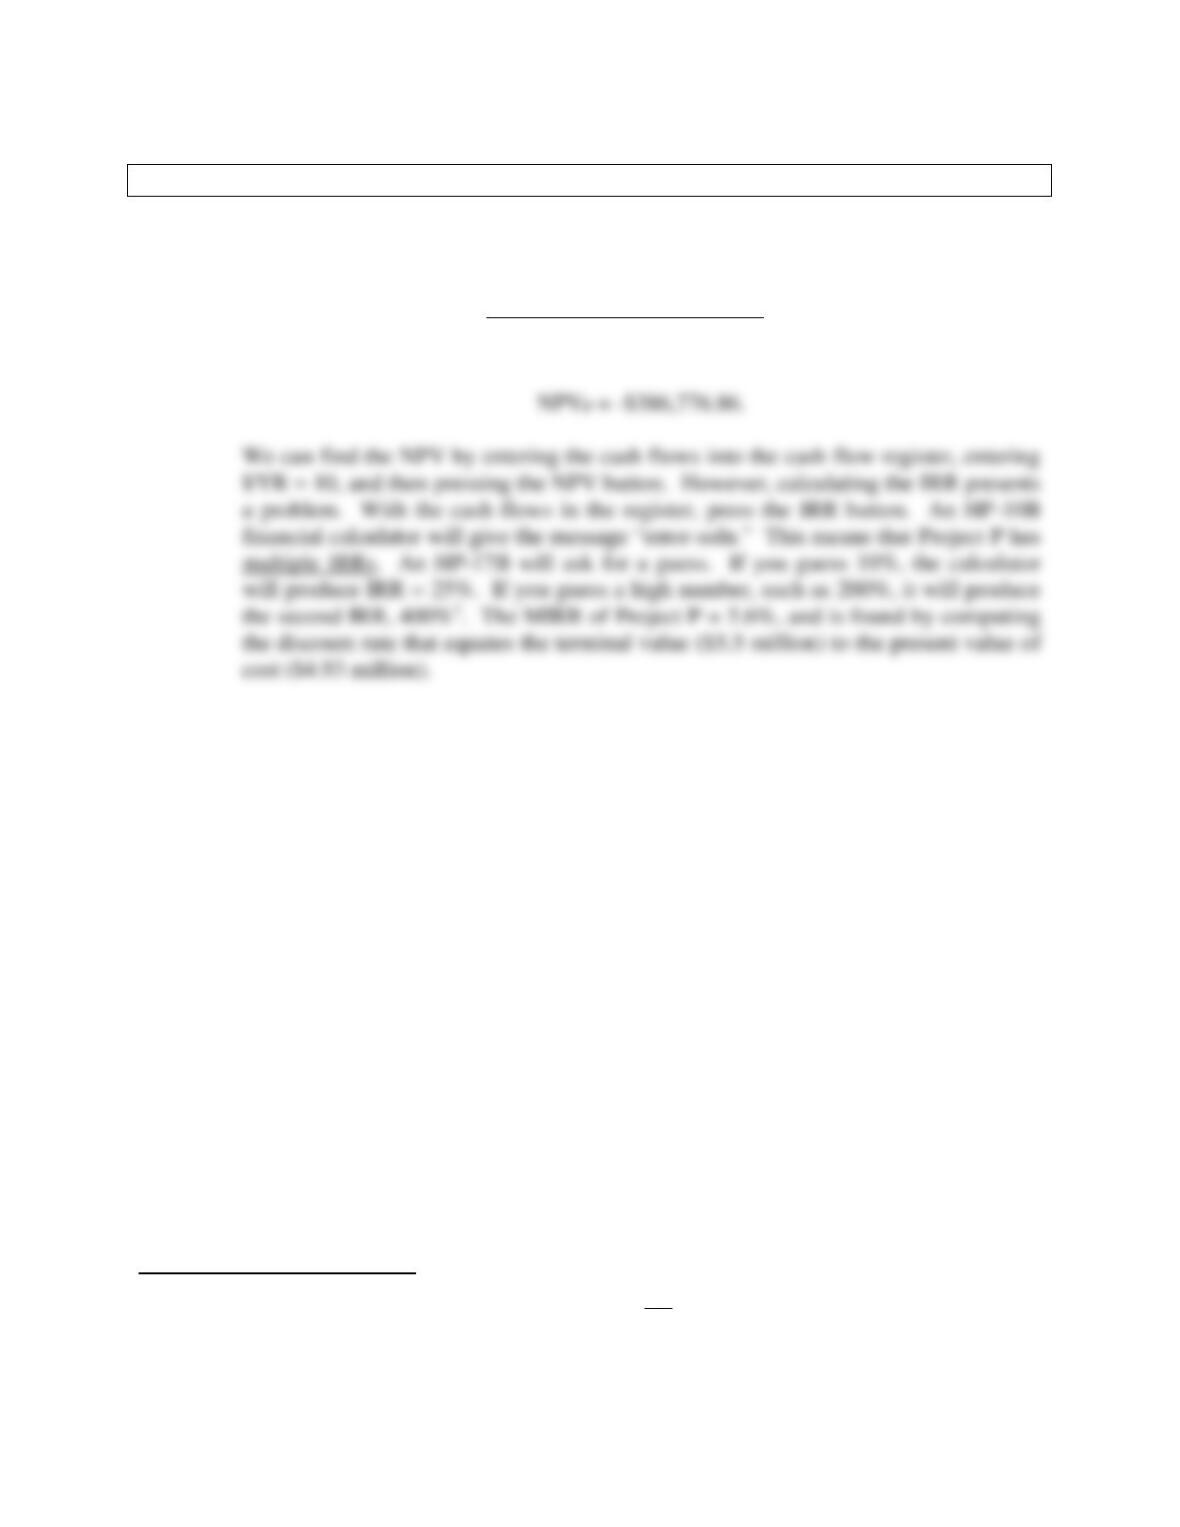
j. 2. What is Project P’s NPV? What is its IRR? Its MIRR?
Answer: Here is the time line for the cash flows, and the NPV:
0 1 2
| | |
-800,000 5,000,000 -5,000,000
1
Looking at the figure below, if you guess an IRR to the left of the peak NPV rate, the lower IRR will
appear. If you guess IRR > peak NPV rate, the higher IRR will appear.
10%
Mini Case: 10 – 41
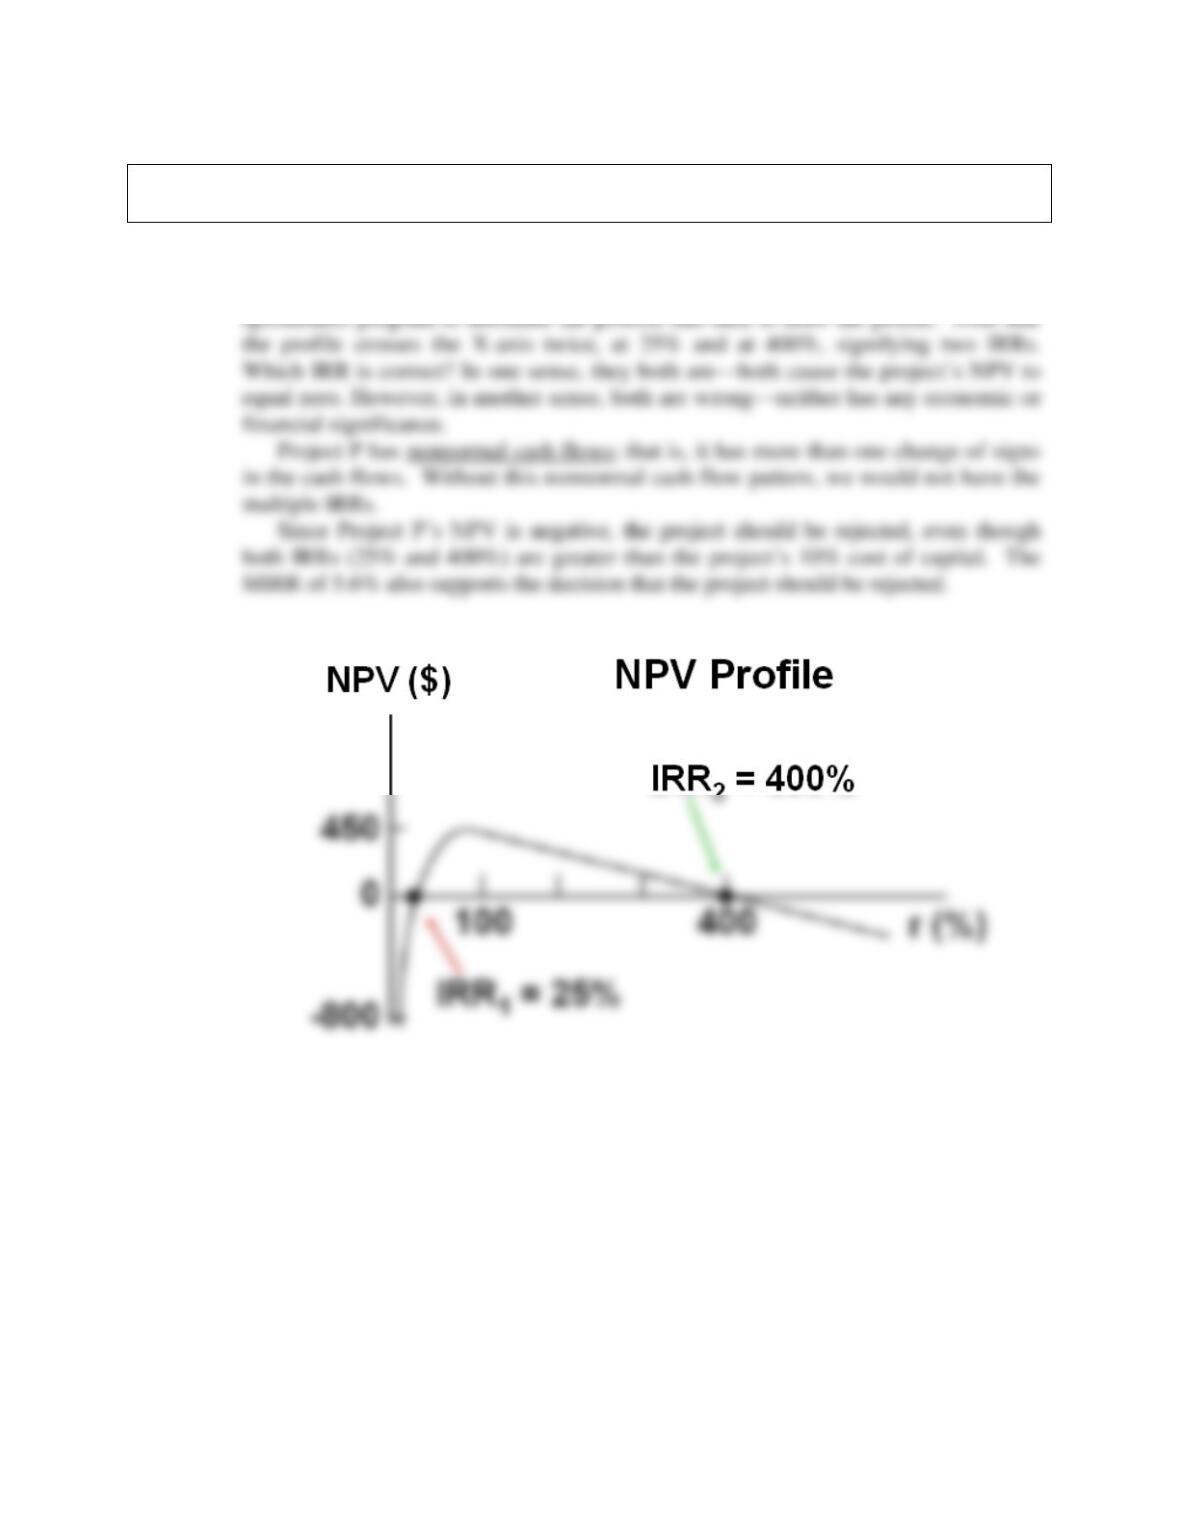
j. 3. Draw Project P’s NPV profile. Does Project P have normal or nonnormal cash
flows? Should this project be accepted?
Answer: You could put the cash flows in your calculator and then enter a series of r values, get
an NPV for each, and then plot the points to construct the NPV profile. We used a
Mini Case: 10 – 42
k. In an unrelated analysis, you have the opportunity to choose between the
following two mutually exclusive projects, Project T (which lasts for two years)
and Project F (which lasts for four years):
Expected Net Cash Flows
Year Project T Project F
0 ($100,000) ($100,000)
1 60,000 33,500
2 60,000 33,500
3 — 33,500
4 — 33,500
The projects provide a necessary service, so whichever one is selected is expected
to be repeated into the foreseeable future. Both projects have a 10% cost of
capital.
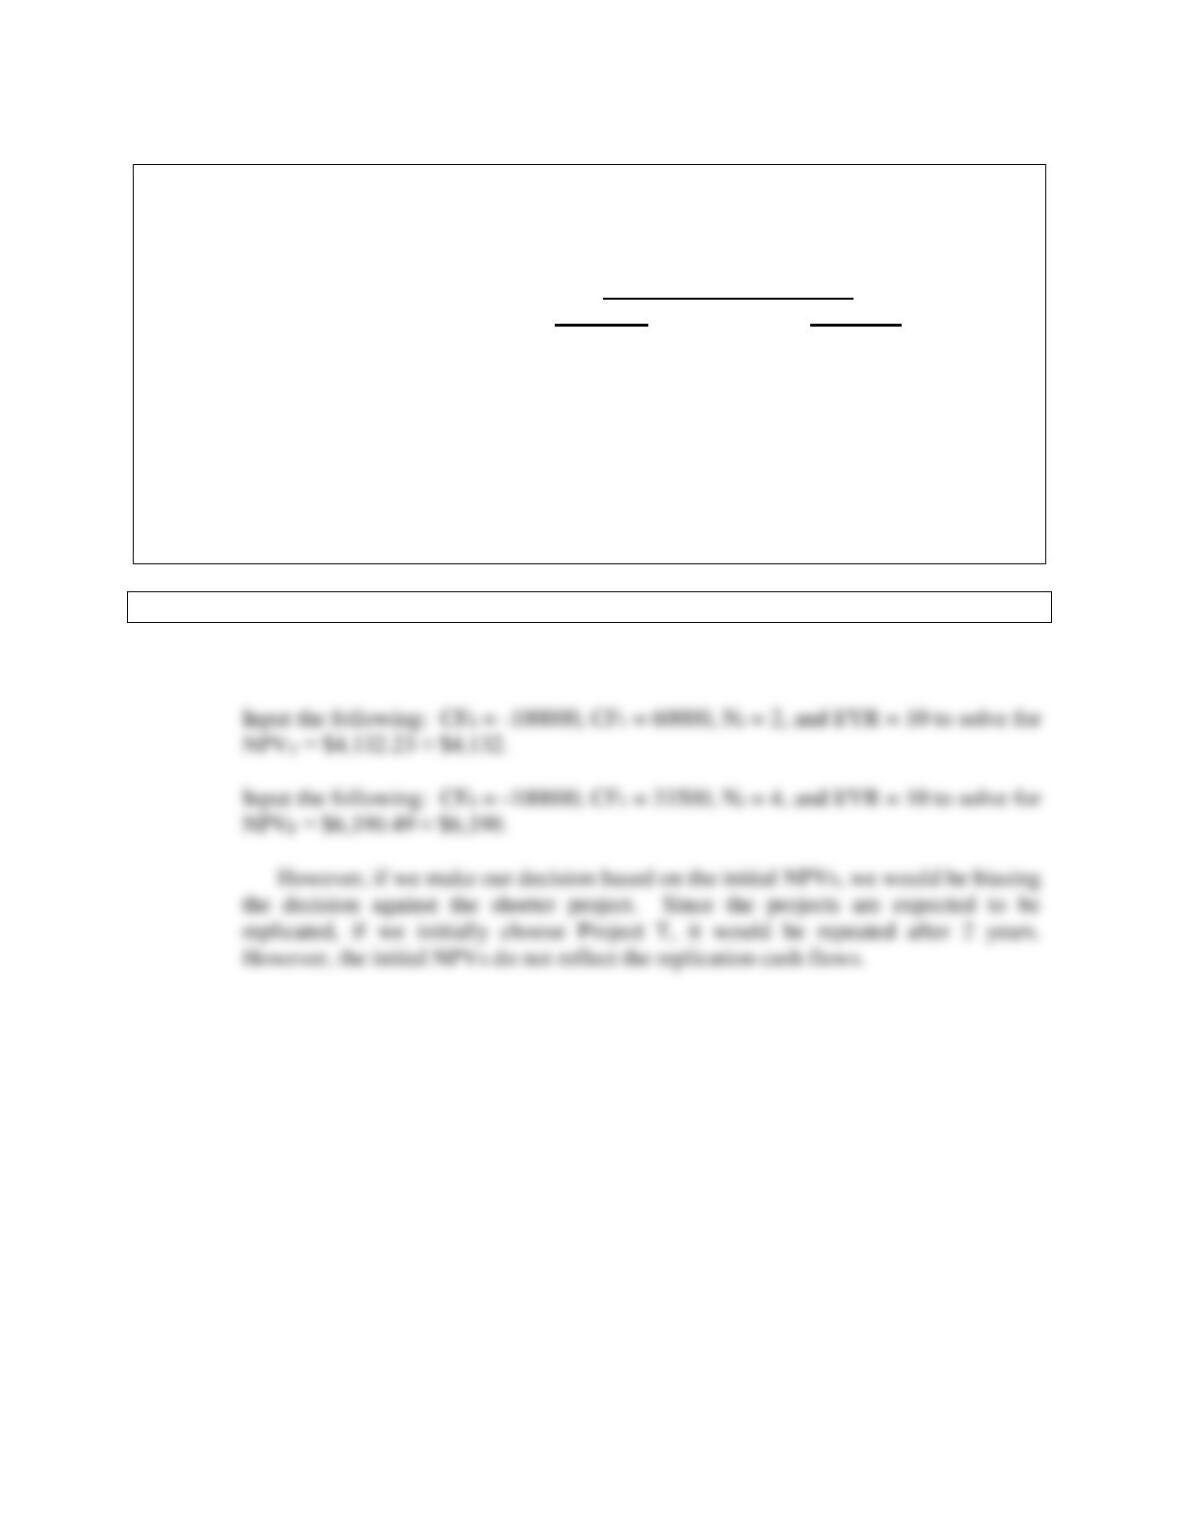
k. 1. What is each project’s initial NPV without replication?
Answer: The NPVs, found with a financial calculator, are calculated as follows:
Mini Case: 10 – 43
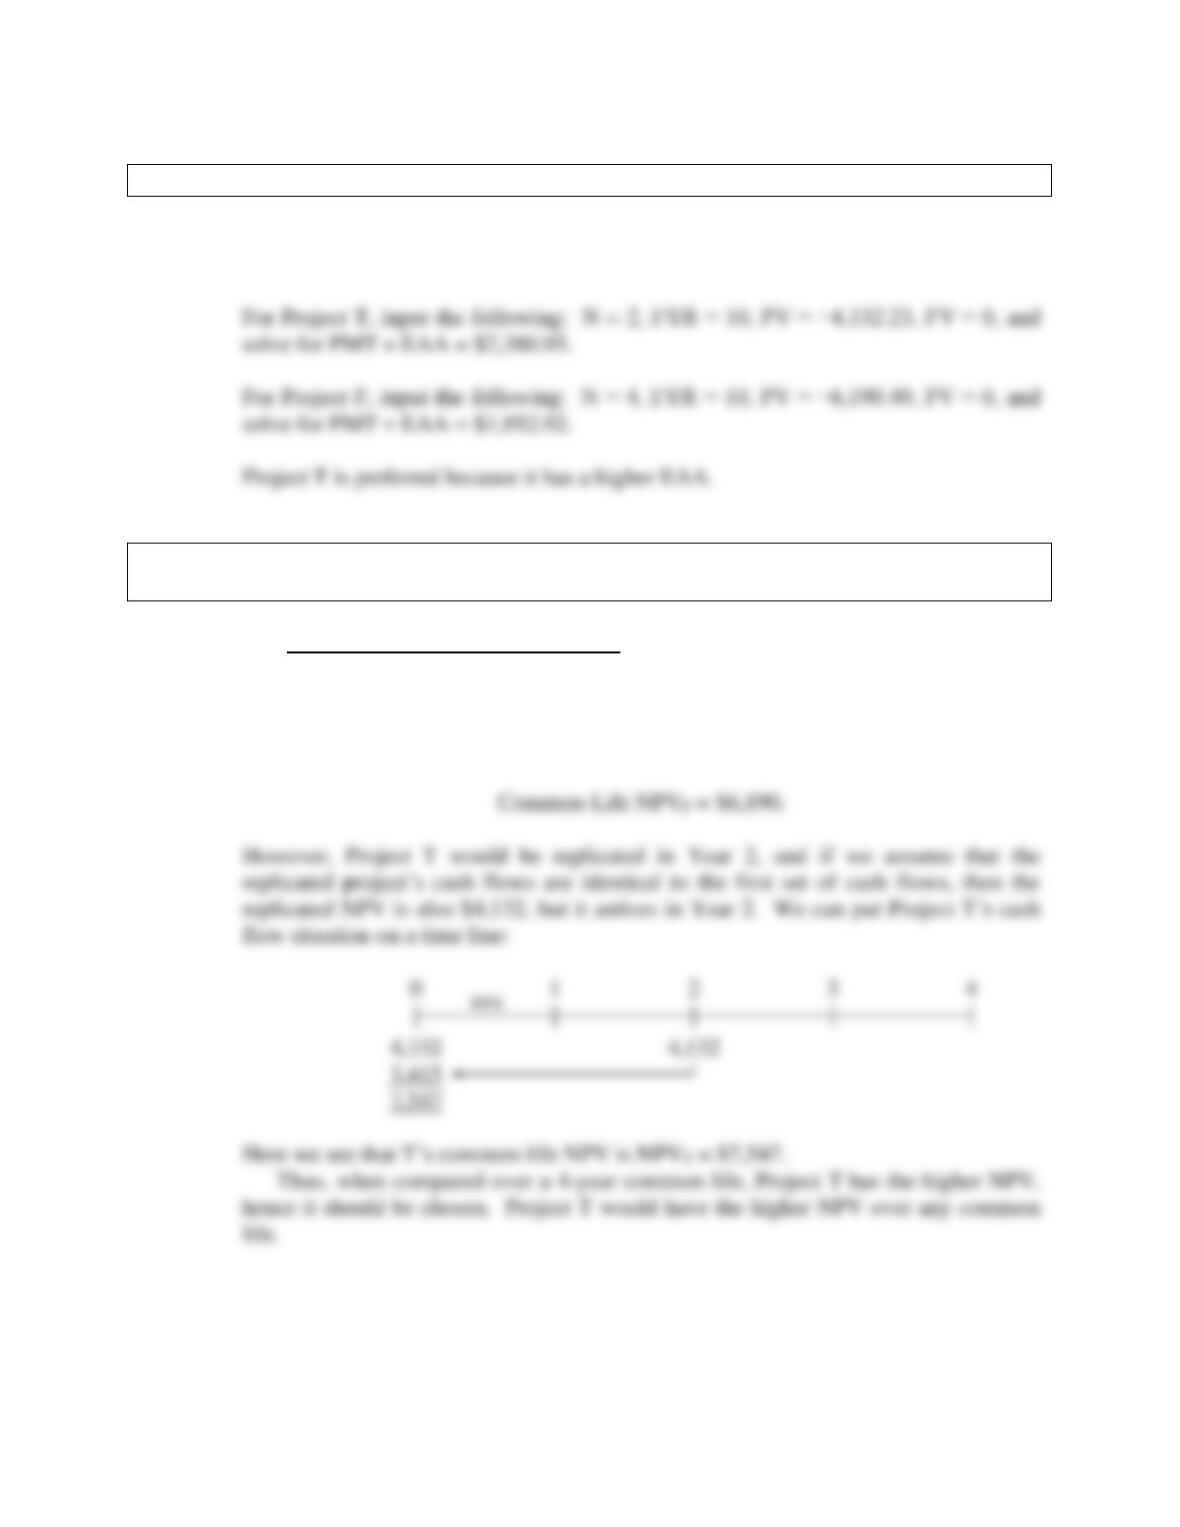
k. 2. What is each project’s equivalent annual annuity?
Answer: We begin with the NPVs found in the previous step. We then find the annuity
payment stream that has the same present value as follows:
k. 3. Now apply the replacement chain approach to determine the projects’ extended
NPVs. Which project should be chosen?
Answer: The simple replacement chain approach assumes that the projects will be replicated
out to a common life. Since Project T has a 2-year life and F has a 4-year life, the
shortest common life is 4 years.
Project F’s common-life NPV is its initial NPV:
Mini Case: 10 – 44
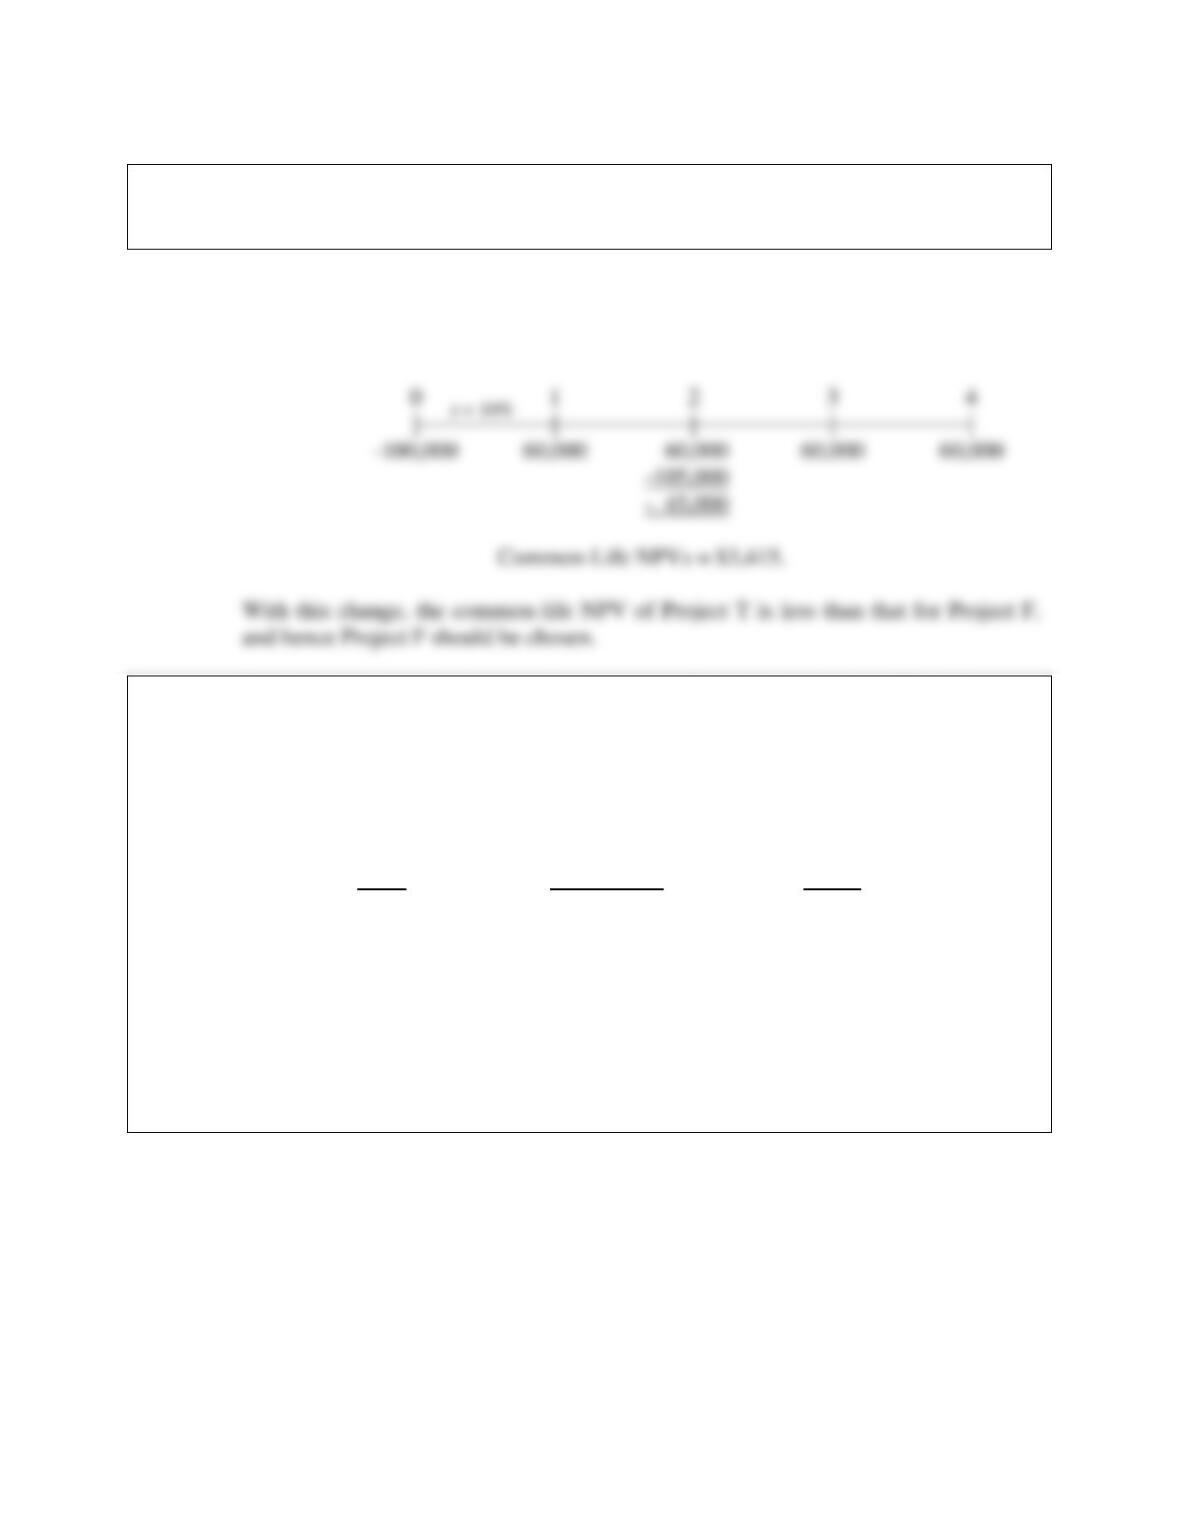
k. 4. Now assume that the cost to replicate Project T in 2 years will increase to
$105,000 because of inflationary pressures. How should the analysis be handled
now, and which project should be chosen?
Answer: If the cost of Project T is expected to increase, the replication project is not identical
to the original, and the EAA approach cannot be used. In this situation, we would put
the cash flows on a time line as follows:
l. You are also considering another project which has a physical life of 3 years;
that is, the machinery will be totally worn out after 3 years. However, if the
project were terminated prior to the end of 3 years, the machinery would have a
positive salvage value. Here are the project’s estimated cash flows:
Initial Investment End-of-Year
And Operating Net Salvage
Year Cash Flows Value
0 ($5,000) $5,000
1 2,100 3,100
2 2,000 2,000
3 1,750 0
Using the 10% cost of capital, what is the project’s NPV if it is operated for the
full 3 years? Would the NPV change if the company planned to terminate the
project at the end of Year 2? At the end of Year 1? What is the project’s
optimal (economic) life?
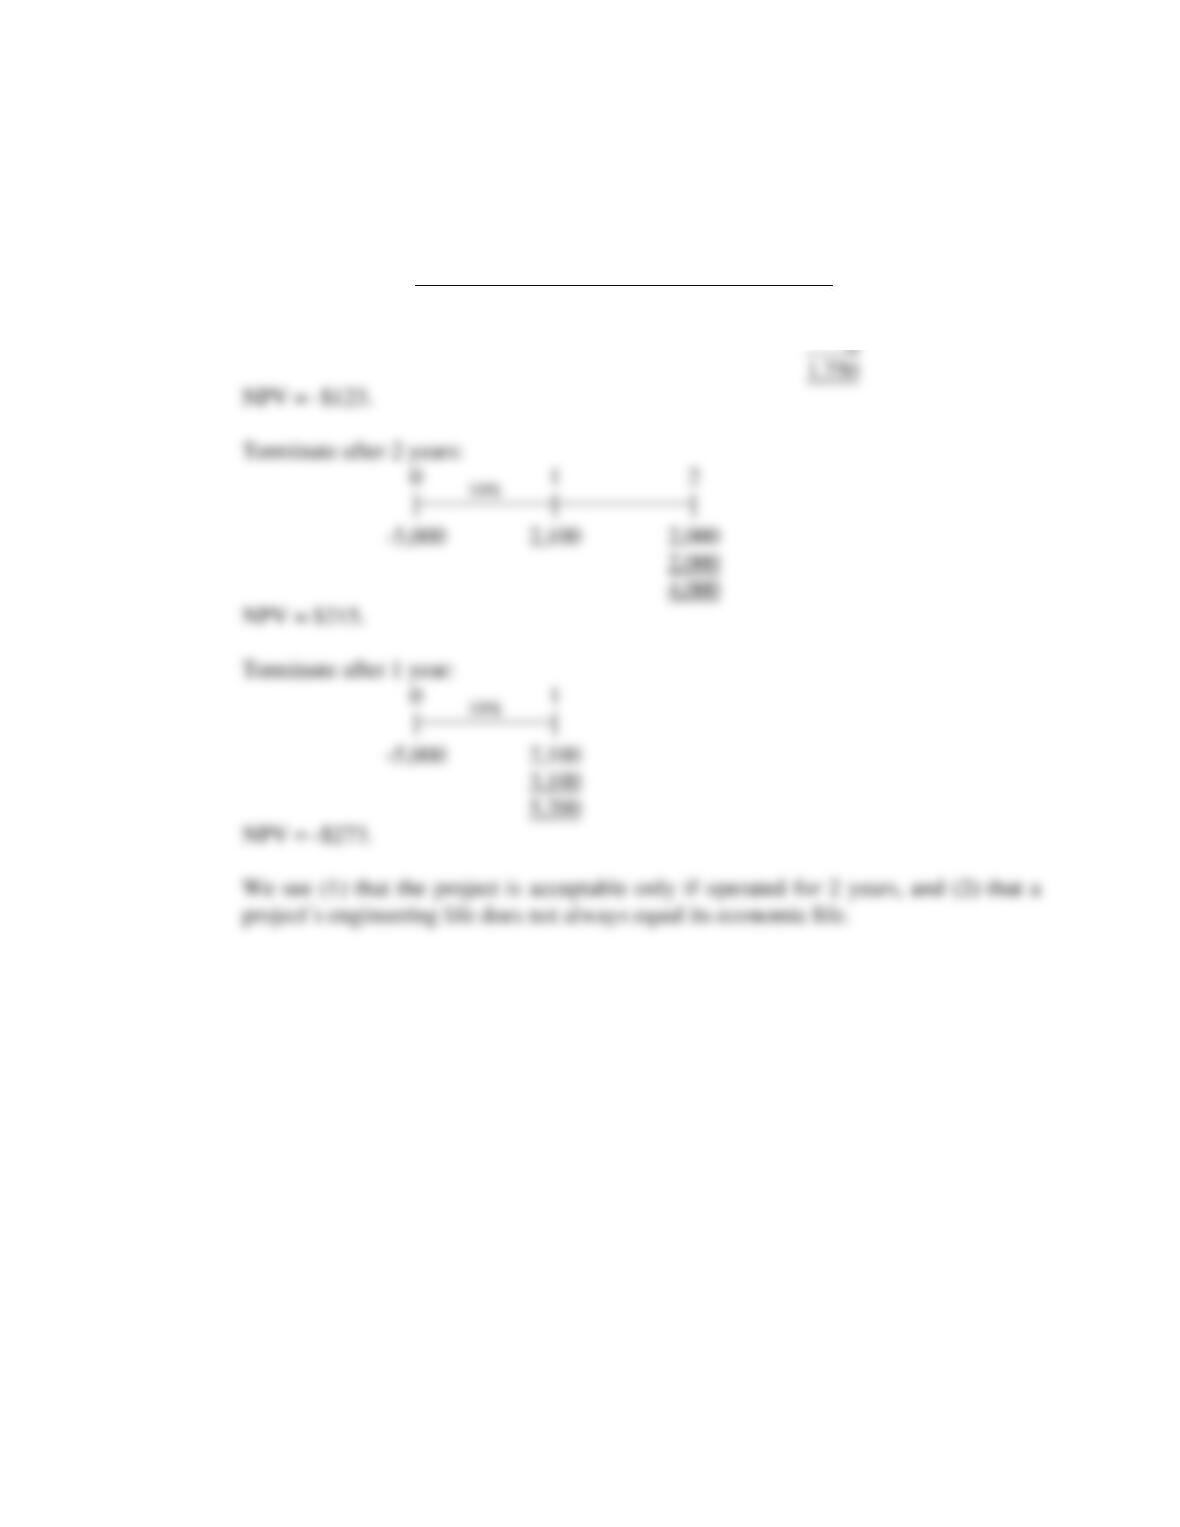
Mini Case: 10 – 45
Answer: Here are the time lines for the 3 alternative lives:
No termination:
0 1 2 3
| | | |
-5,000 2,100 2,000 1,750
10%
10%
10%