$60
$70
$80
$90
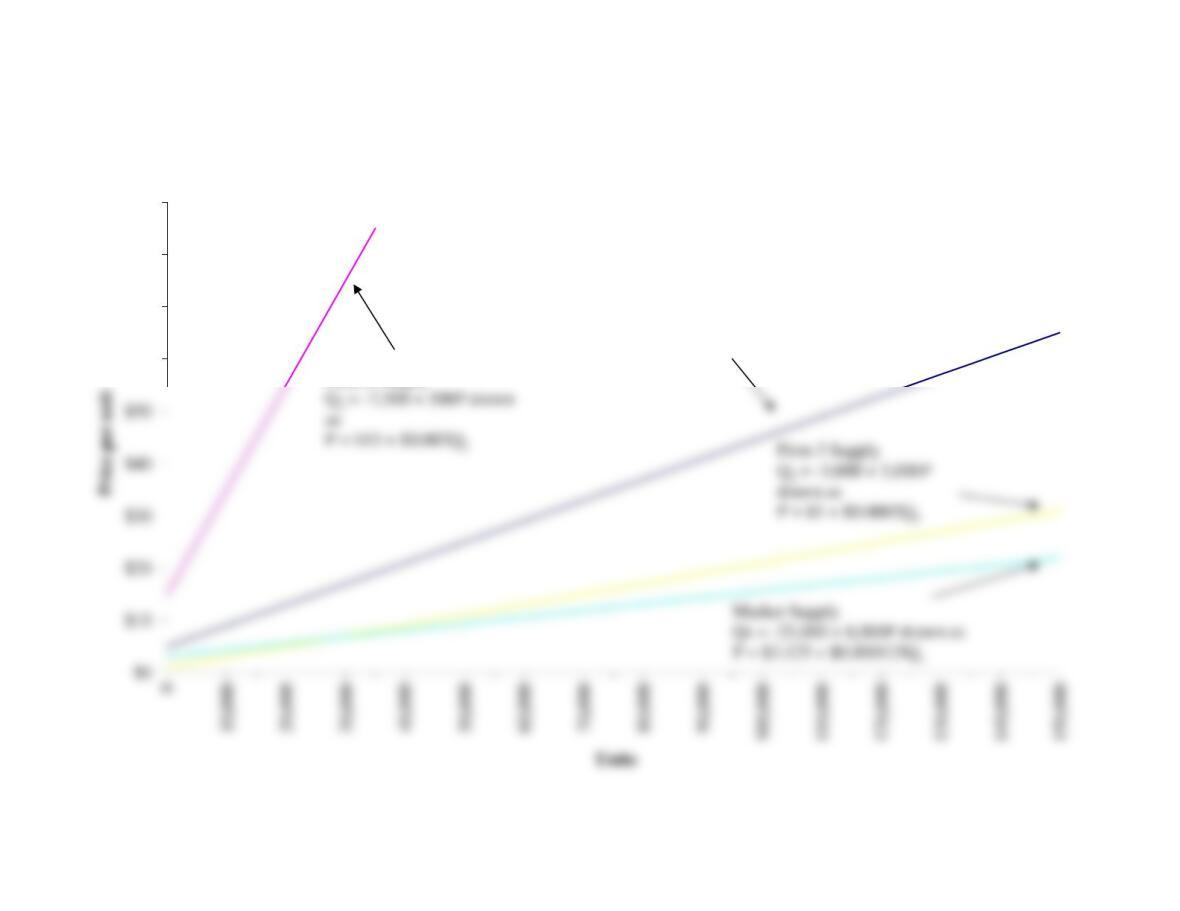
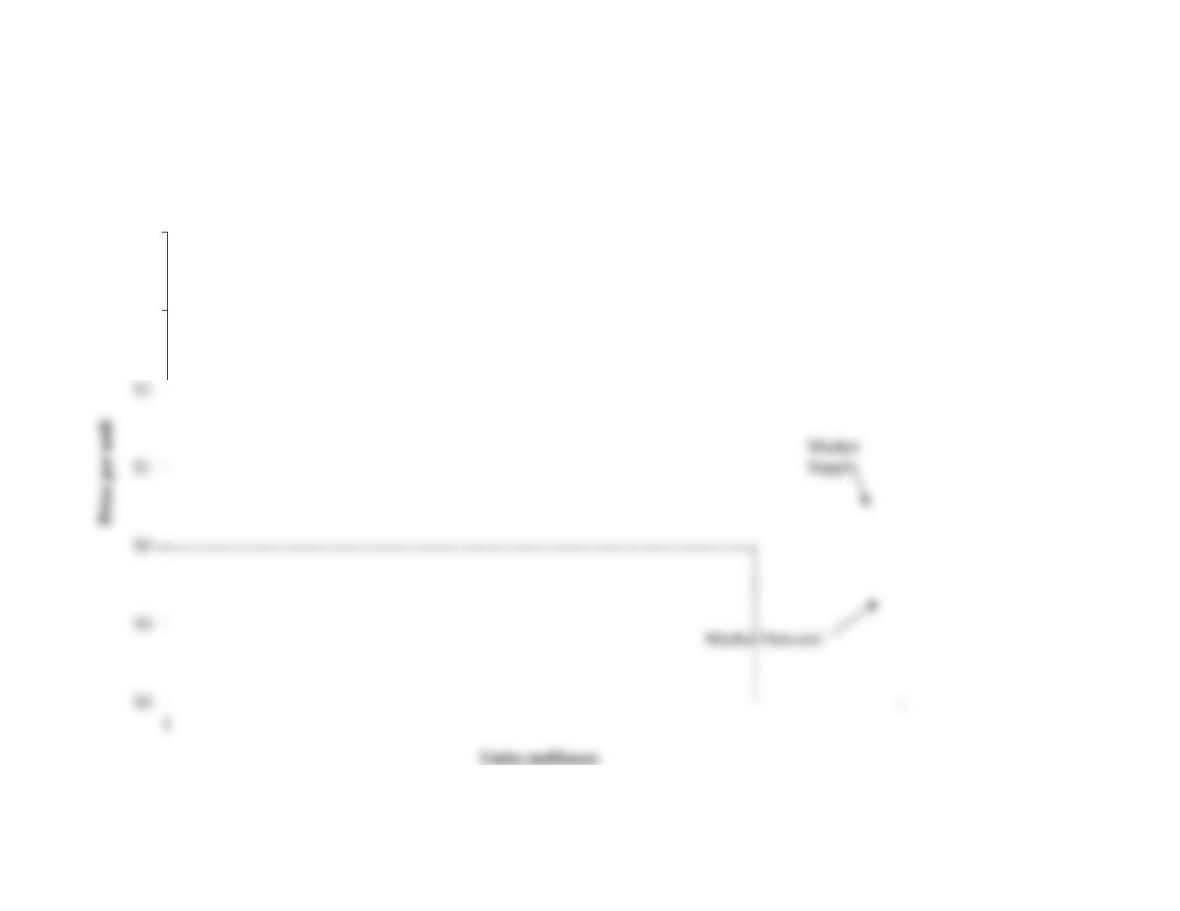
Market Supply is the Sum of Firm Supply Across all Competitors
Firm 2 Supply
Firm 1 Supply
Q1= -12,500 + 2,500P drawn as
P = $5 + $0.0004Q1
Market supply is the total amount supplied by all
competitors.
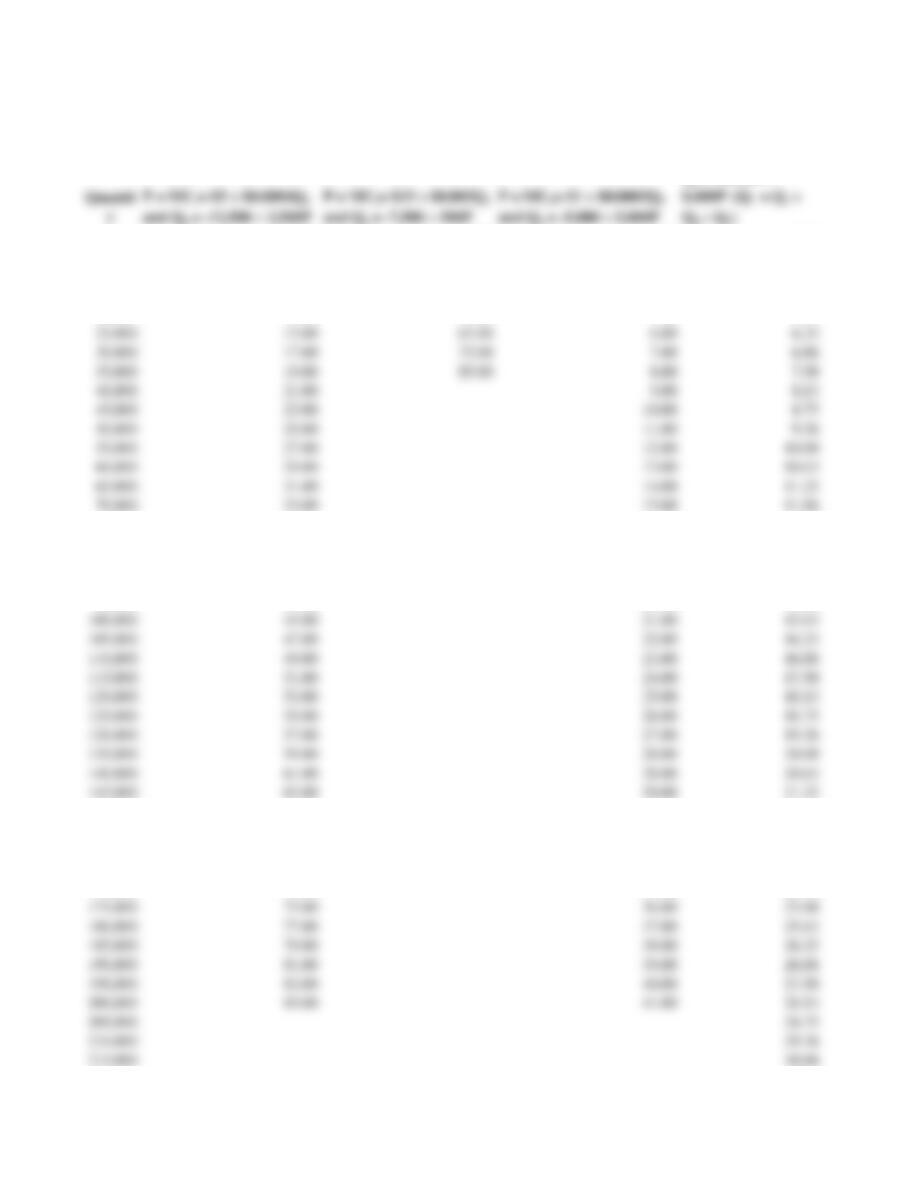
Table 9.2 Industry Supply is the Sum of Firm Supply Across all Competitors
Firm One Supply Firm Two Supply Firm Three Supply Industry Supply
QI = -25,000 +
0 5.00 15.00 1.00 3.13
5,000 7.00 25.00 2.00 3.75
10,000 9.00 35.00 3.00 4.38
15,000 11.00 45.00 4.00 5.00
20,000 13.00 55.00 5.00 5.63
75,000 35.00 16.00 12.50
80,000 37.00 17.00 13.13
85,000 39.00 18.00 13.75
90,000 41.00 19.00 14.38
95,000 43.00 20.00 15.00
150,000 65.00 31.00 21.88
155,000 67.00 32.00 22.50
160,000 69.00 33.00 23.13
165,000 71.00 34.00 23.75
170,000 73.00 35.00 24.38
225,000 31.25
230,000 31.88
235,000 32.50
240,000 33.13
245,000 33.75
300,000 40.63
305,000 41.25
310,000 41.88
315,000 42.50
320,000 43.13
375,000 50.00
380,000 50.63
385,000 51.25
390,000 51.88
395,000 52.50
450,000 59.38
455,000 60.00
460,000 60.63
465,000 61.25
470,000 61.88
525,000 68.75
530,000 69.38
535,000 70.00
540,000 70.63
545,000 71.25
600,000 78.13
605,000 78.75
610,000 79.38
615,000 80.00
620,000 80.63
675,000
680,000
685,000
690,000
695,000

Price 1 + + + +
= Partial Market Supply x 1,000
= Total Market Supply (000)
$1 20 18 52 32 18 140 140,000
222 24 64 44 26 180 180,000
Quantity Supplied by Firm (000)
$20
$25
$30
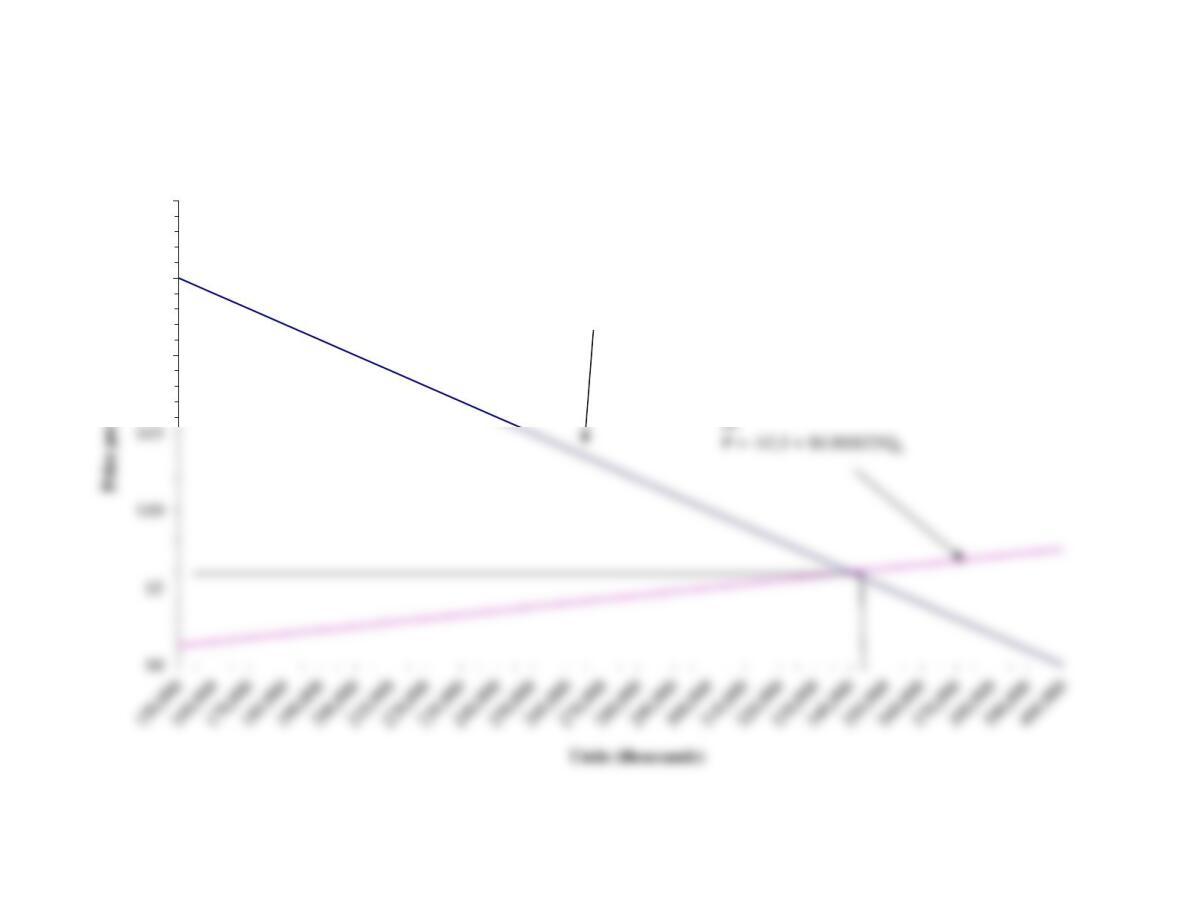
Market Equilibrium
Market Demand
QD= 400,0000 – 10,000P drawn as
P = $40 – 0.0001QD
Market Supply
QS= 100,0000 + 40,000P drawn
2
P = MC1=
$5 + $0.0004Q1
and Q1 = -12,500
+ 2,500P
180,000 #VALUE!
3 370,000 220,000 -150,000
Quantity
150000 25.00 1.25
160000 24.00 1.50
170000 23.00 1.75
180000 22.00 2.00
190000 21.00 2.25
200000 20.00 2.50
210000 19.00 2.75
220000 18.00 3.00
$1
$1
Demand and Supply Conditions for
Replacement Windshield Wiper Blades
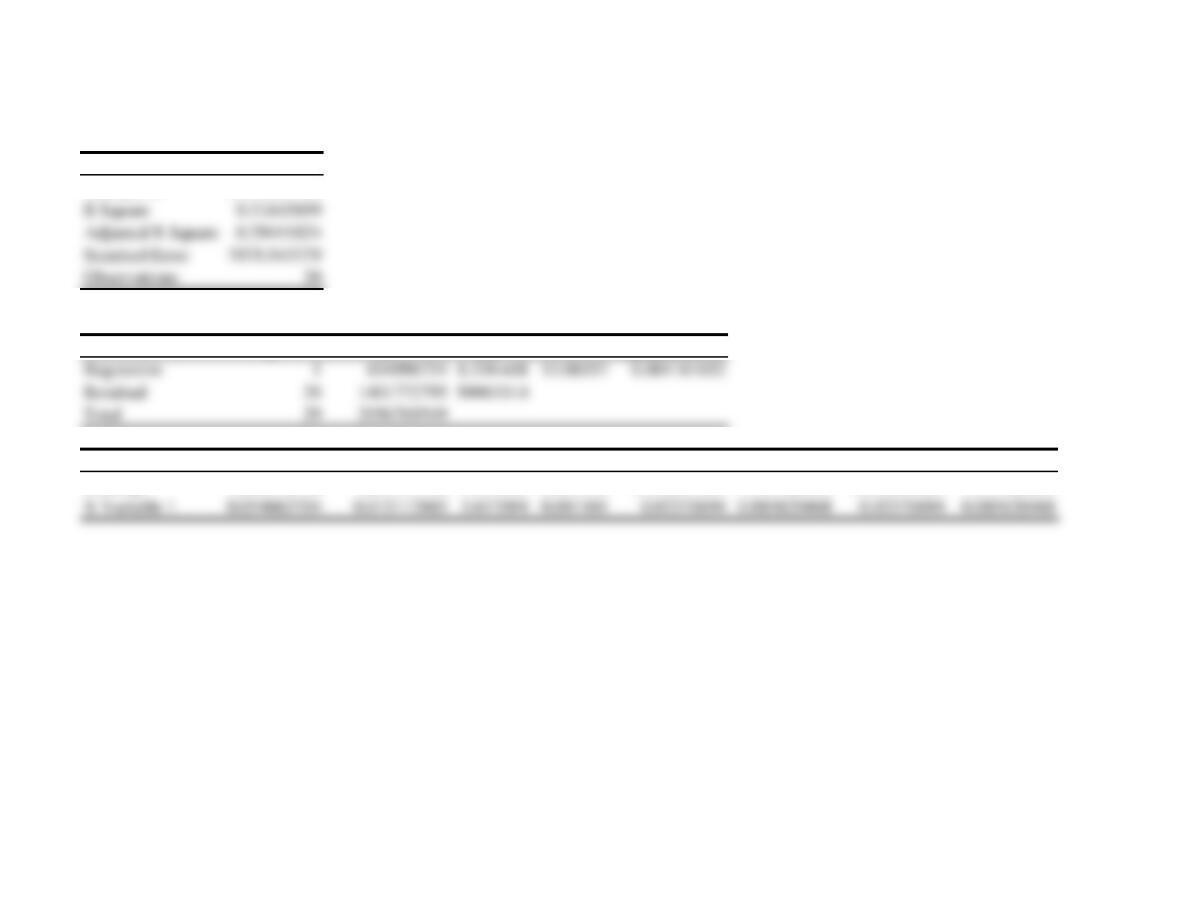
SUMMARY OUTPUT
Regression Statistics
Multiple R 0.564321708
ANOVA
df SS MS F Significance F
Coefficients Standard Error t Stat P-value Lower 95% Upper 95% Lower 95.0% Upper 95.0%
Intercept 3624.530548 1820.339348 1.991129 0.056305 -104.2655225 7353.326619 -104.2655225 7353.326619

SUMMARY OUTPUT
Regression Statistics
Multiple R 0.757364338
ANOVA
df SS MS F Significance F
Regression 1 1179764535 1179764535 37.66615521 1.26592E-06
Coefficients Standard Error t Stat P-value Lower 95% Upper 95% Lower 95.0% Upper 95.0%
Intercept 895.8530415 1576.453145 0.568271277 0.574380354 -2333.364796 4125.070879 -2333.364796 4125.070879

SUMMARY OUTPUT
Regression Statistics
Multiple R 0.38363921
R Square 0.147179044
ANOVA
df SS MS F Significance F
Coefficients Standard Error t Stat P-value Lower 95% Upper 95% Lower 95.0% Upper 95.0%

SUMMARY OUTPUT
Regression Statistics
Multiple R 0.095212377
R Square 0.009065397
ANOVA
df SS MS F Significance F
Regression 1 0.013680298 0.013680298 0.256153239 0.616737229
Coefficients Standard Error t Stat P-value Lower 95% Upper 95% Lower 95.0% Upper 95.0%
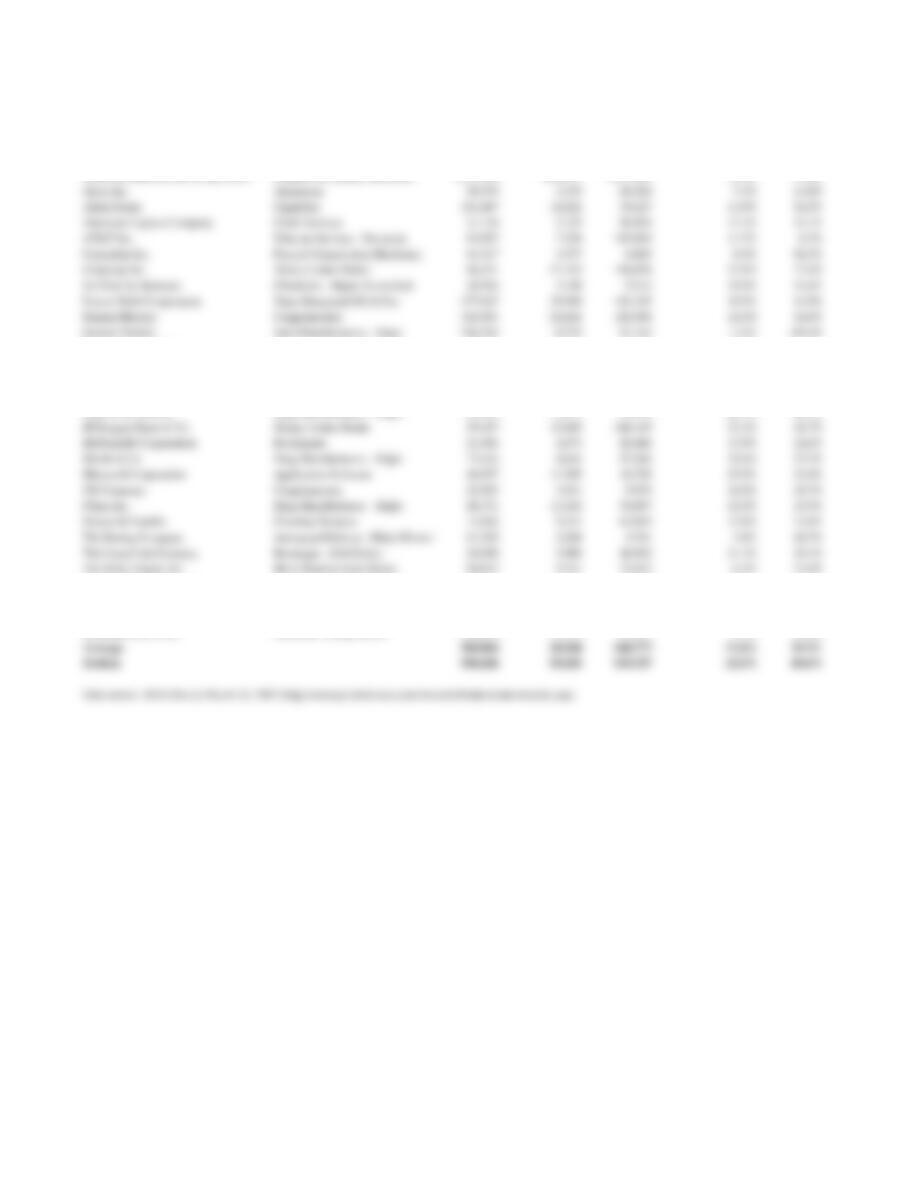
Table 1.1 Profitability of Corporate Giants Included in the Dow Jones Industrial Average
Company Name Industry Name
Sales
Revenue ($
millions)
Net Income ($
millions)
Net Worth ($
millions)
Return on Sales
(MGN, %)
Return on
Equity
(ROE, %)
American International Group (AIG) Property & Casualty Insurance $113,194 $14,014 $101,521 12.4% 13.8%
Hewlett-Packard Company Diversified Computer Systems 94,081 6,518 38,006 6.9% 17.1%
Honeywell International Inc. Conglomerates 31,367 2,078 9,712 6.6% 21.4%
Intel Corporation Semiconductor – Broad Line 35,382 5,044 36,717 14.3% 13.7%
International Business Machines Corp. Diversified Computer Systems 91,423 9,415 28,486 10.3% 33.1%
Johnson & Johnson Drug Manufacturers – Major 53,324 11,053 39,352 20.7% 28.1%
The Walt Disney Company Entertainment – Diversified 35,156 4,341 32,746 12.3% 13.3%
United Technologies Corporation Conglomerates 47,829 3,732 17,292 7.8% 21.6%
Verizon Communications Inc. Telecom Services – Domestic 88,144 5,480 48,432 6.2% 11.3%
Wal-Mart Stores, Inc. Discount, Variety Stores 348,650 12,179 61,573 3.5% 19.8%
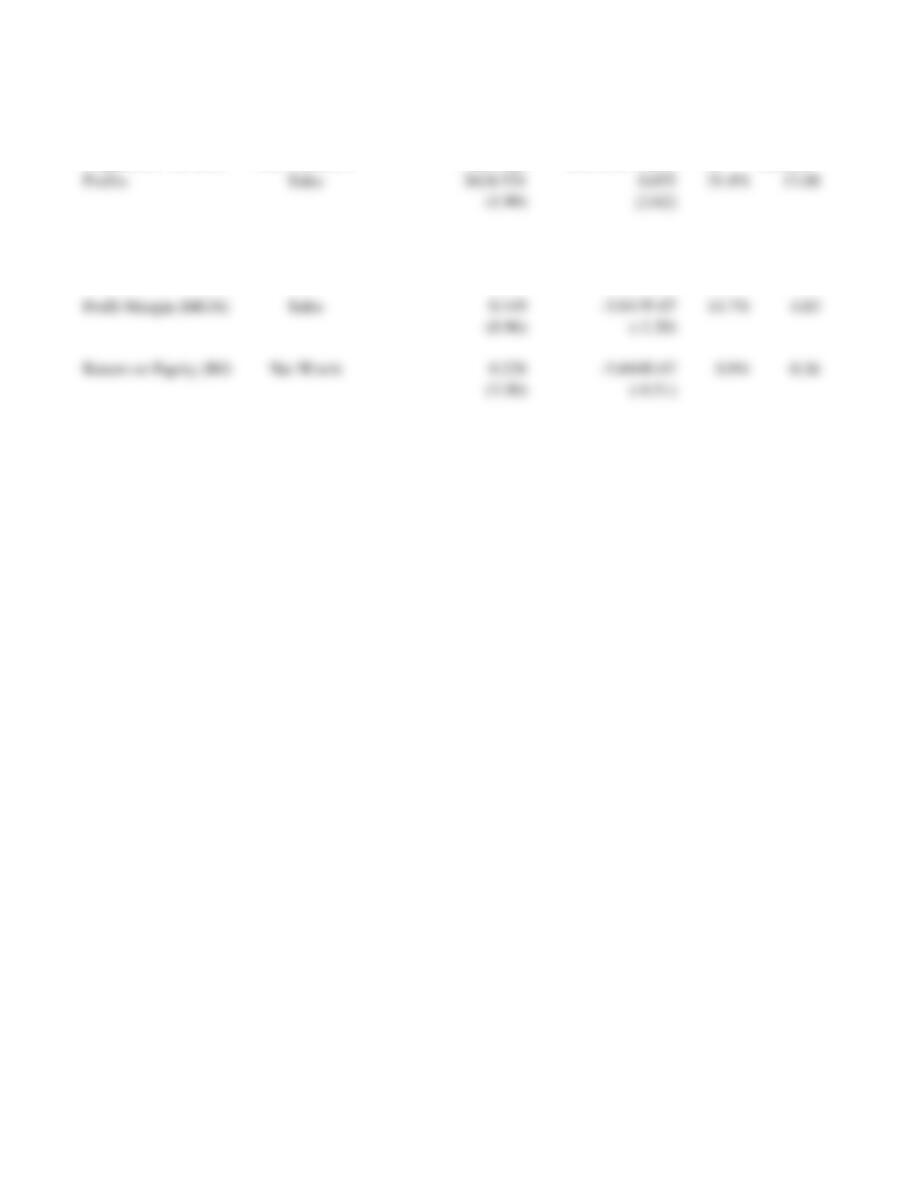
Table 10.2 Effects of Firm Size on Profitability (t statistics are in parentheses)
Dependent Variable Size Measure Intercept Size Coefficient R2
F-
statistic
Profits Net Worth
895.853 0.165 57.4% 37.67
(0.57) (6.14)
(1.99) (3.62)