
Table10.1 Competitive Firm Profits Are Maximized When Marginal Revenue Equals Marginal Cost
Units Price Total Revenue Fixed Cost Variable Costs
Average Variable
Cost
Total Cost
Average Total
Cost
Total Profit
(TR-TC)
Marginal
Revenue
Marginal Cost
Marginal Profit
(MR-MC)
(1) (2) (3) = (1) x (2) (3) (4) (5) = (4)/(1) (6) = (3) + (4) (7) = (6)/(1) (8) = (3) – (6) (9) = ∂TR/∂Q (10) = ∂TC/∂Q (11) = (9) – (10)
025 0 311,250 50,000 361,250 -361,250 25 520
5,000 25 125,000 311,250 80,000 16.00 391,250 78.25 -266,250 25 718
10,000 25 250,000 311,250 120,000 12.00 431,250 43.13 –181,250 25 916
$2,000,000
$2,500,000
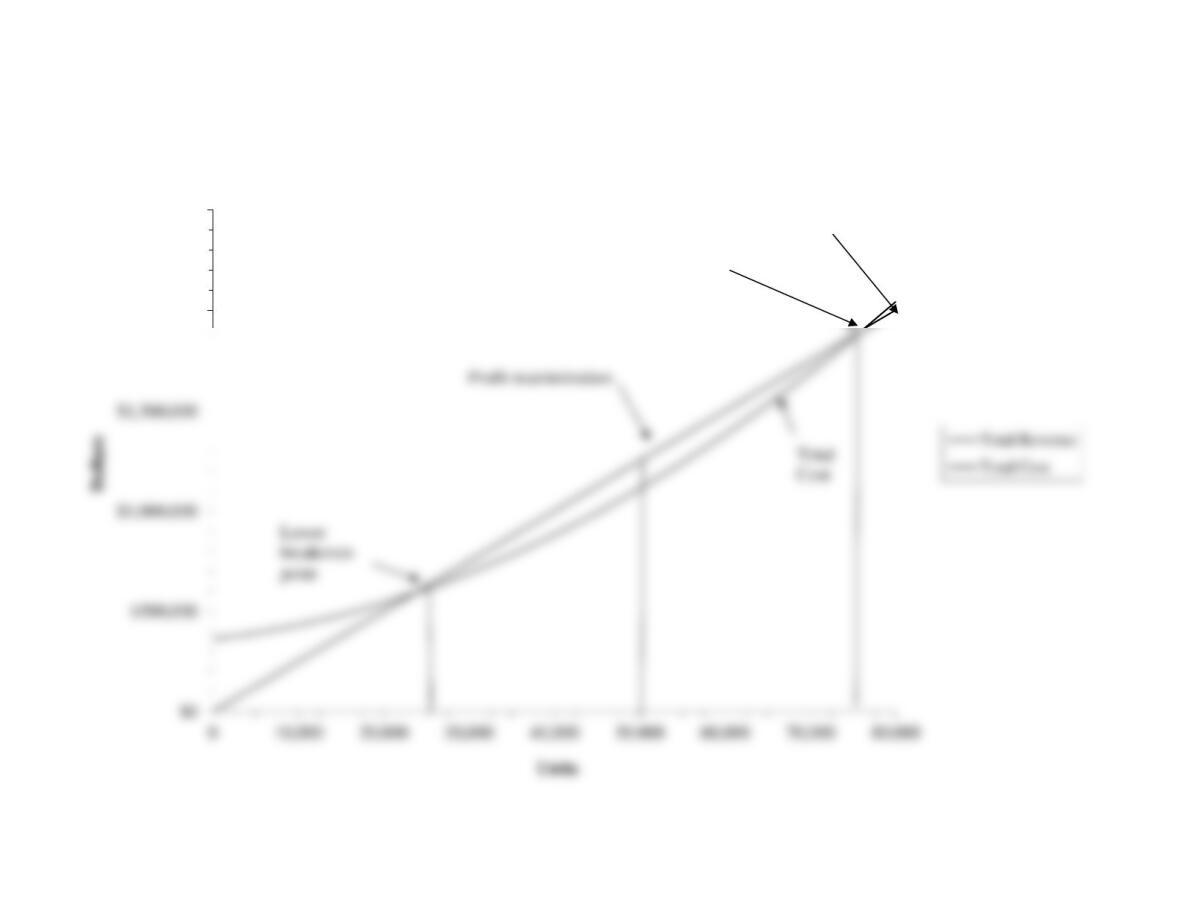
Figure 10.1 Total Revenue, Total Cost and Profits
Upper breakeven
point
Total
Revenue
Profit is the difference between total revenue and total
cost.
$70
$80
$90
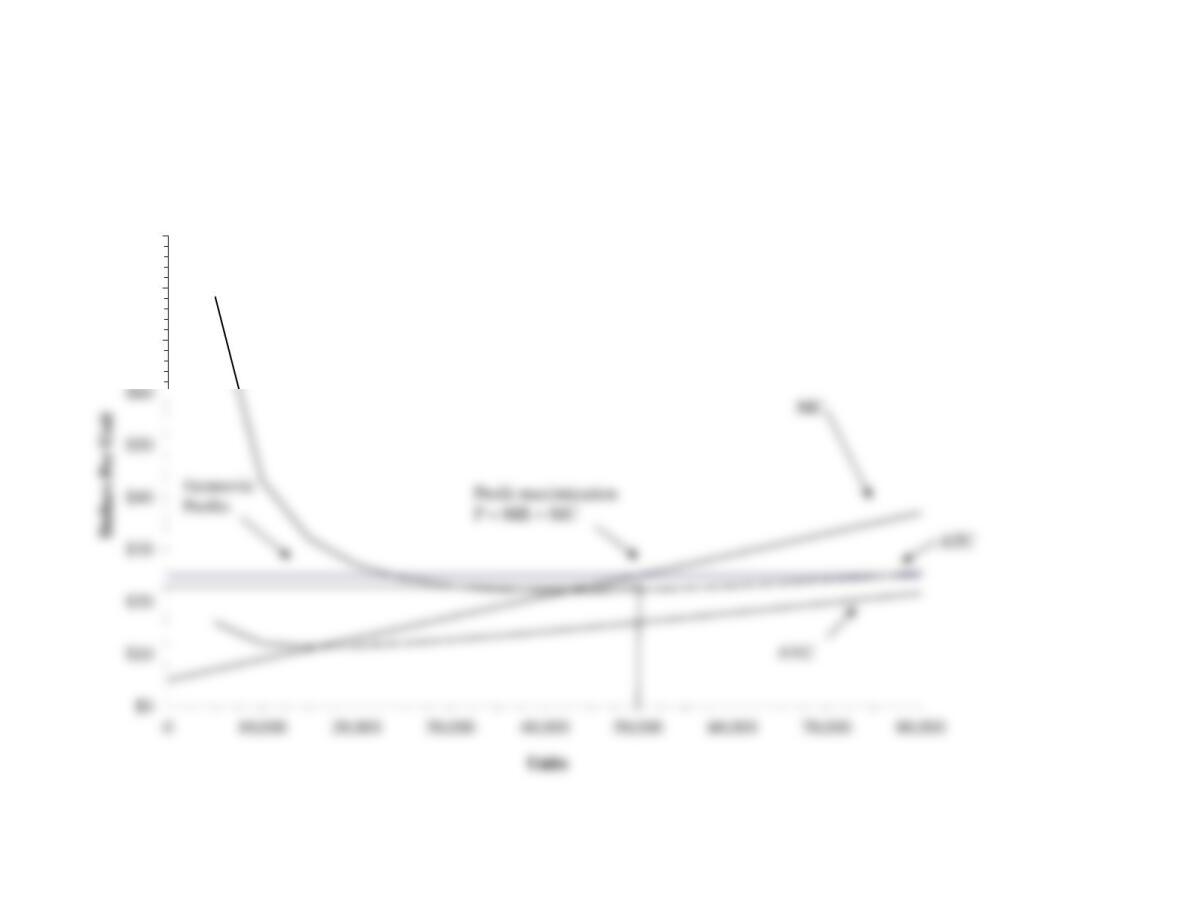
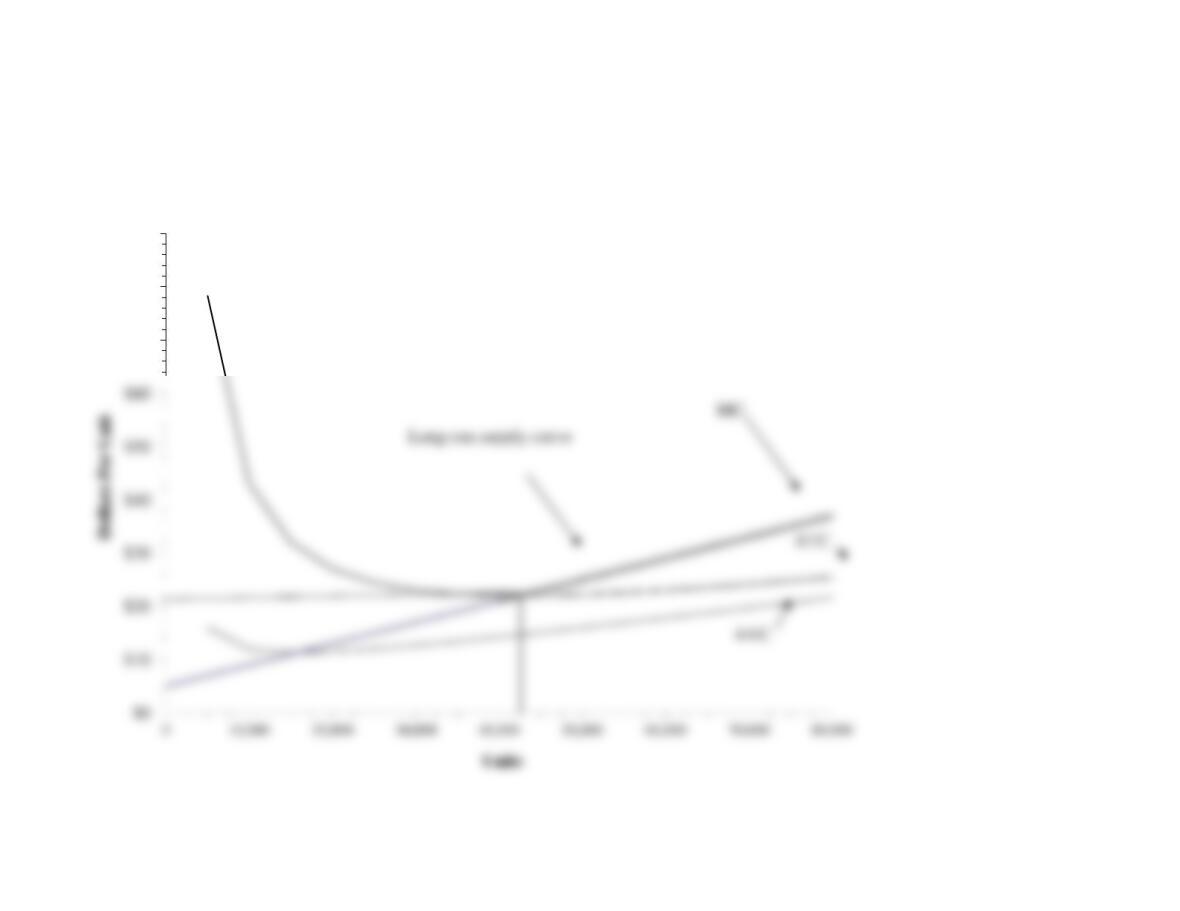
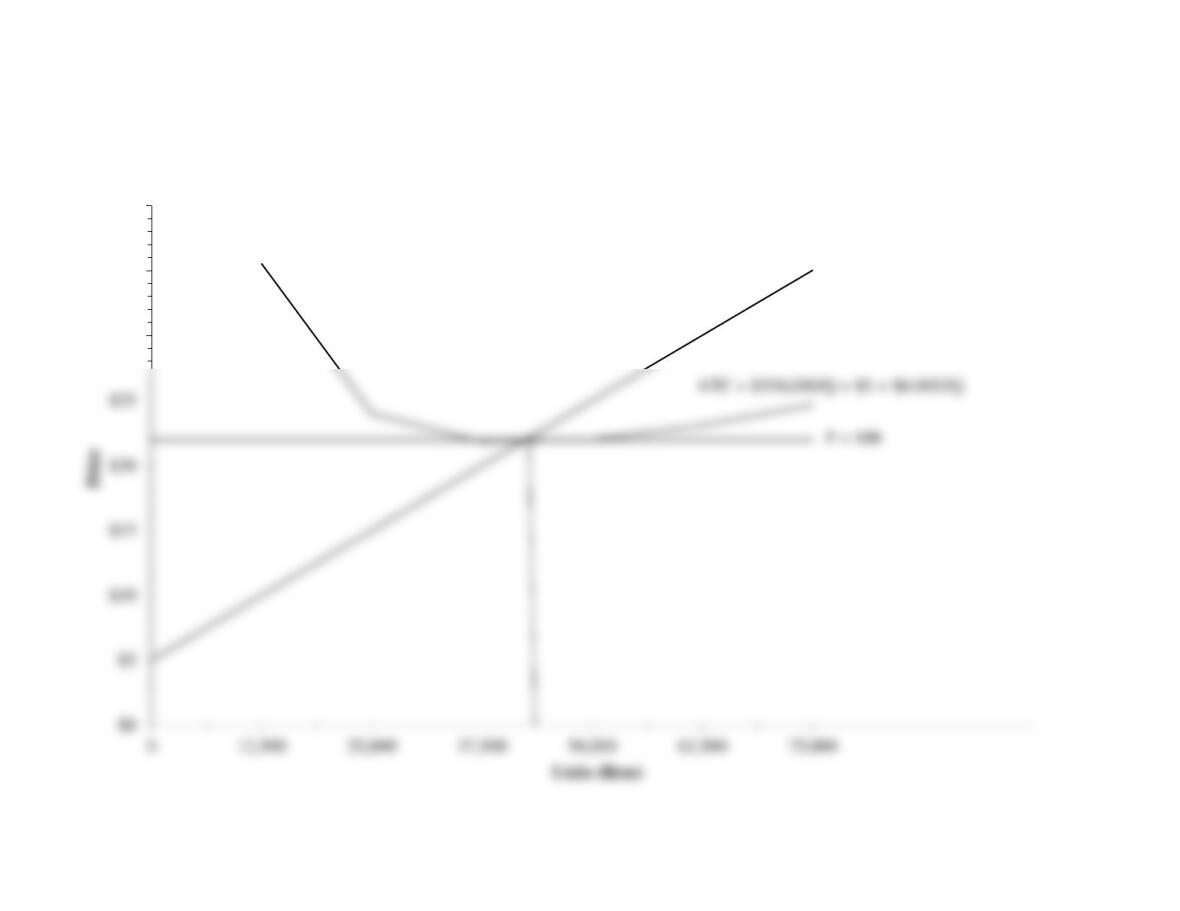
Figure 10.2 Competitive Firm Profits Are Maximized When Marginal
Revenue Equals Marginal Cost
Profits are always maximized where MR = MC. In competitive
markets, firms are price takers so maximum profits occur where
P = MR = MC.
$70
$80
$90
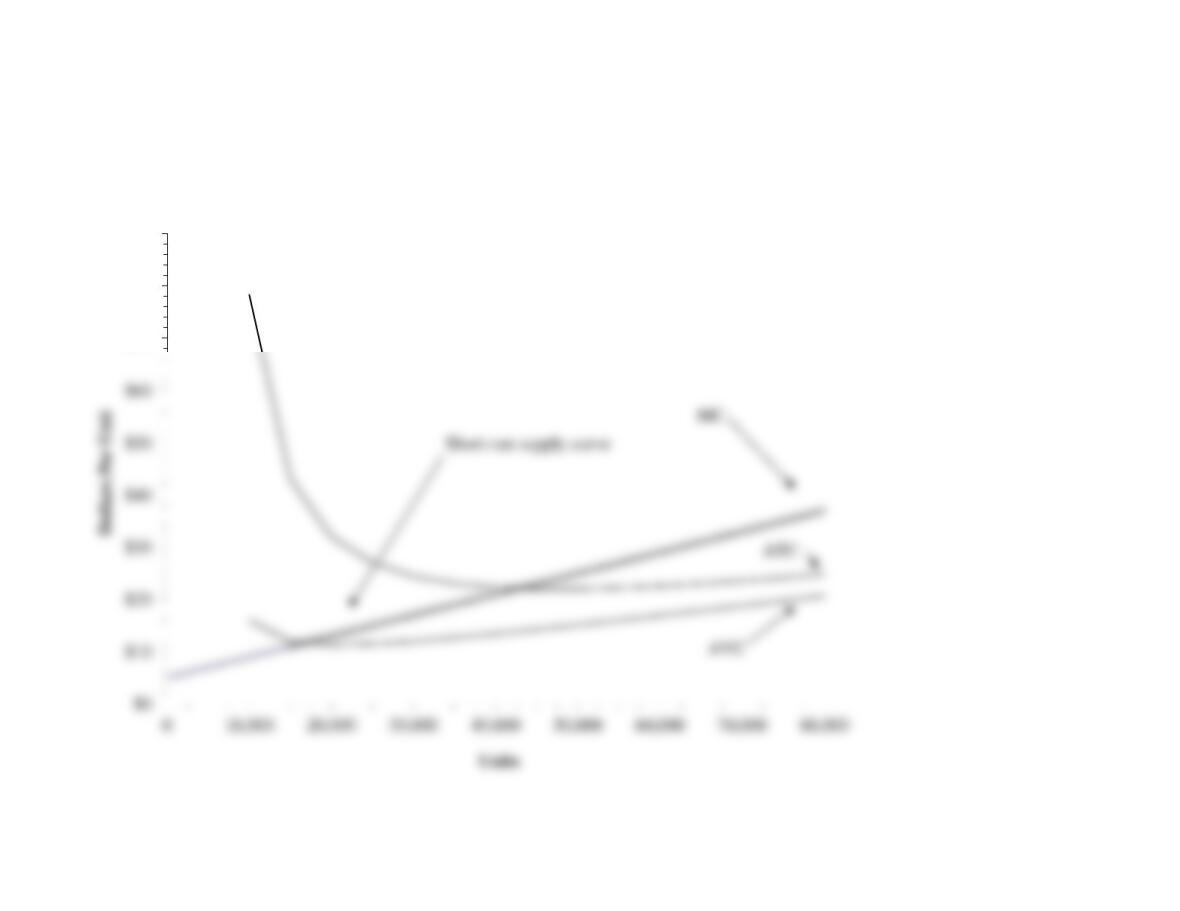
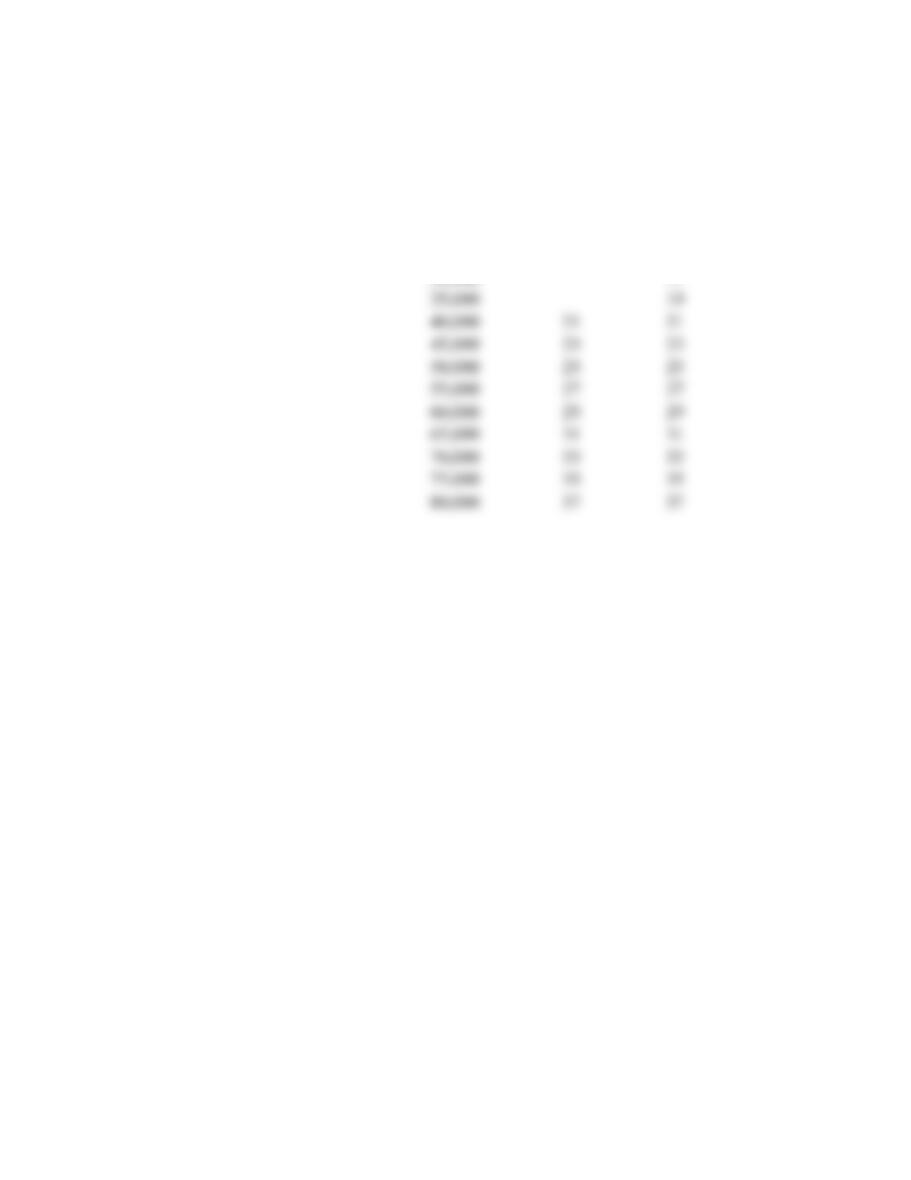
Figure 10.3 Competitive Firm Supply Curve
a. The short-run firm supply curve follows MC Curve if MC > AVC
In the short run, firms supply output so long as added revenues
exceed added variable costs, and a profit contribution is earned.
Supply Curve Marginal Cost
5
5,000 7
P = MC1=
10,000 9
15,000 11 11
20,000 13 13
$70
$80
$90
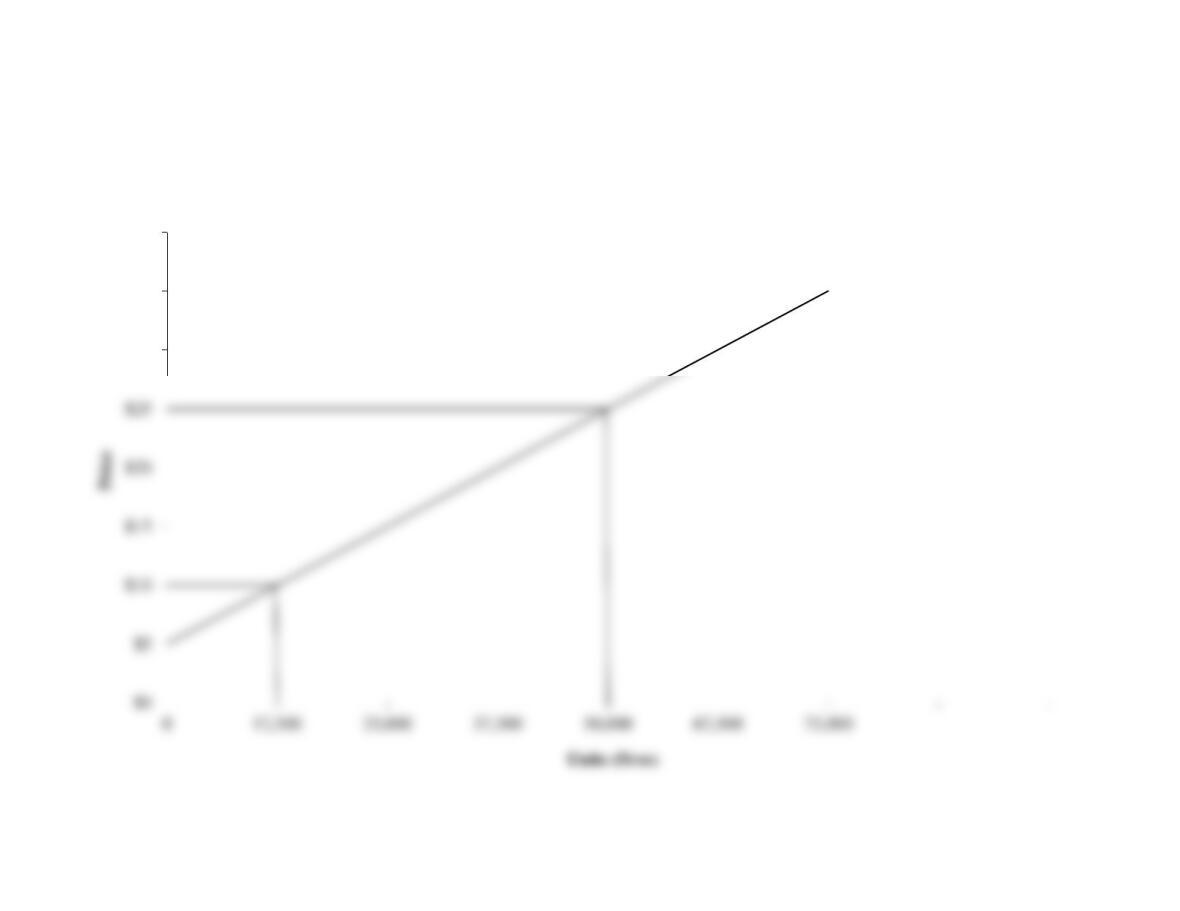
b. The long-run firm supply curve follows MC Curve if MC > ATC
In the long run, firms supply output so long as revenues
meet or exceed total costs, and at least a risk-adjusted
normal rate of profit is earned.
Supply Curve
Marginal Cost
0 5
5,000 7
10,000 9
15,000 11
20,000 13
25,000 15
30,000 17
$30
$35
$40
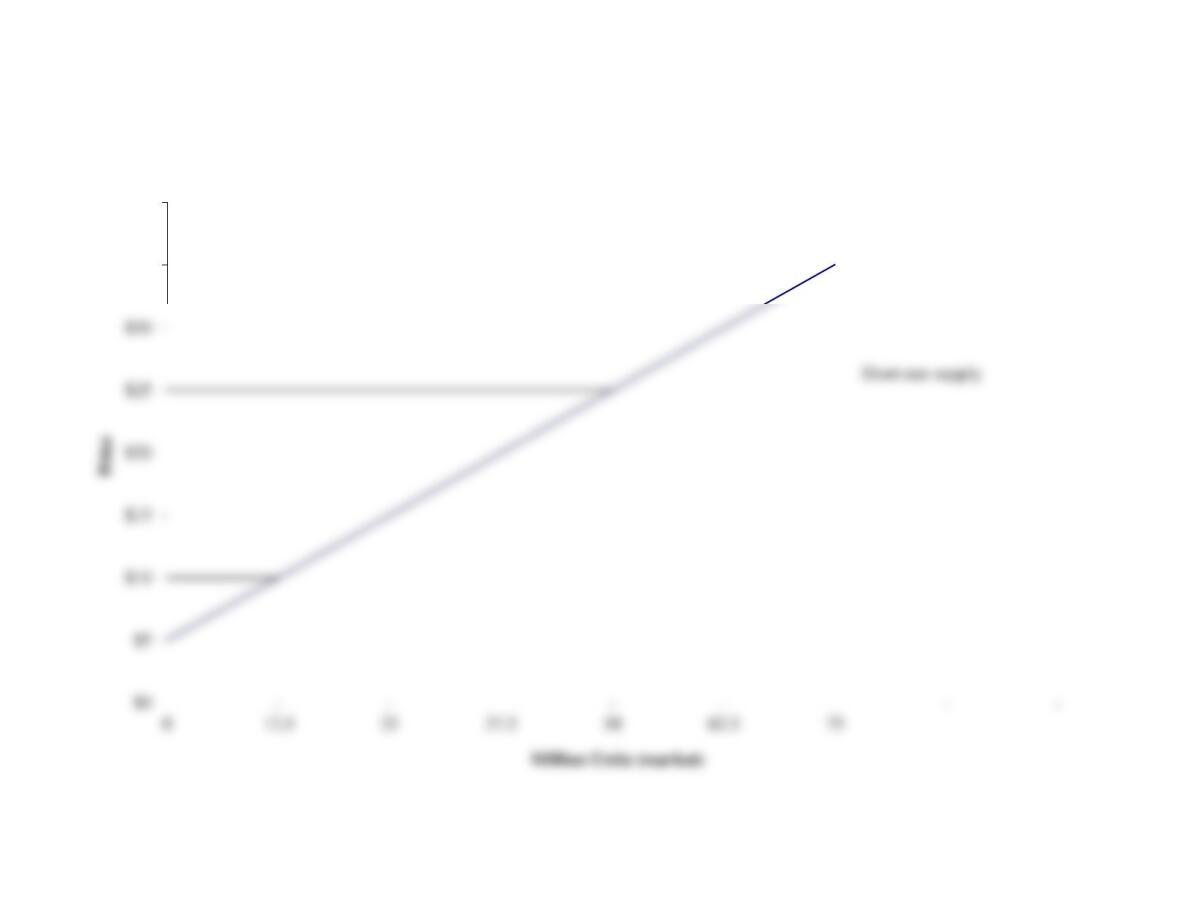
Figure 10.4 Competitive Market Supply Curves
a. Market Supply with a Fixed Number of Competitors
If market price exceeds average variable cost,
each firm’s marginal cost curve is its supply
curve.
MC = $5 + $0.0004Q
$35
$40
b. Market Supply with 1,000 Identical Competitors
The market supply curve is found
by adding up quantities supplied
by all competitors
$30
$35
$40
Figure 10.5 Competitive Market Supply with Entry and Exit
a. Competitive Firm’s Supply Output
at Minimum ATC
MC = $5 + $0.0004Q
Entry and exit causes the market price to
equal the minimum point on each
competitive firm’s ATC curve.
$25
$30
$35
$40
b. The Long-run Competitive Market Supply Curve is a Horizontal Line
Long-run supply
The long-run competitive market supply
curve is a horizontal line equal to the
market price.
a1. b1.
0 5 10 25 0 5 22
12,500 10 10 25 12,500 10 36 22
a2. b2.
0 5 10 25 0 22
12.5 10 10 25 12.5 22
$50
$60
$70
$80
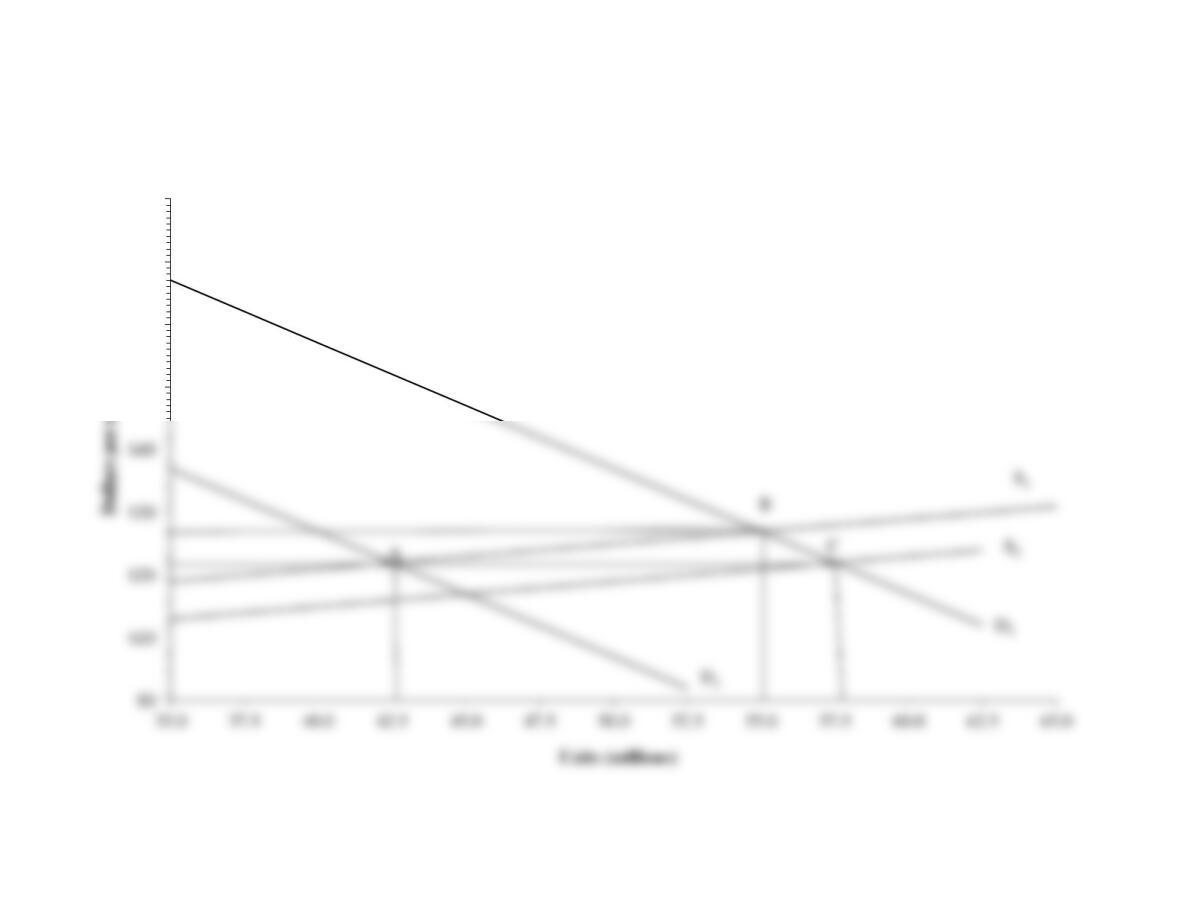
Figure 10.6: Competitive Market Equilibrium
The competitive market equilibrium price-output combination can
be found by equating the market demand and market supply curves.
Quantity
Market Supply
New Market Supply Market demand New market demand
25.0 15 9 57 87.0
27.5 16 10 52 82.0
30.0 17 11 47 77.0
32.5 18 12 42 72.0
35.0 19 13 37 67.0
Firm One
Supply
Firm Two
Supply
Firm Three
Supply
Market Supply
Price
+ 2,500P
7,500 + 500P
5,000P
(QI = Q1 + Q2 + Q3)
$0 -12,500 -7,500 -5,000 -25,000
5 0 -5,000 20,000 15,000
10 12,500 -2,500 45,000 55,000
Market Supply is the Sum of Firm Supply Across all Competitors