Chapter 1
The Policy and Practice of Macroeconomics
◼ Chapter Outline, Overview, and Teaching Tips
Chapter Outline
The Practice of Macroeconomics
The Process: Developing Macroeconomic Models
The Purpose: Interpreting Macroeconomic Data
Macroeconomic Policy
How Can Poor Countries Get Rich?
Is Saving Too Low?
How We Will Study Macroeconomics
Emphasis on Policy and Practice
Concluding Remarks
Chapter Overview and Teaching Tips
The first chapter of this textbook has several objectives. The first is to convince students that macroeconomics
is worth studying. This chapter pursues this goal by showing the student that macroeconomics is an exciting
field because it focuses on phenomena that affect everyday life. A second objective of the chapter is to help
the student understand what the practice of macroeconomics is all about and what central policy issues are
2 Mishkin • Macroeconomics: Policy and Practice, Second Edition
make financial crises less likely? How active should stabilization policy be? Should macroeconomic policy
follow rules? Are global trade imbalances a danger?
◼ Answers to End of Chapter Review Questions and Problems
Answers to Review Questions
Preview
1. Economic growth, labor market conditions (the unemployment rate and growth in the number of jobs),
The Practice of Macroeconomics
2. Endogenous variables are the variables whose behavior a model seeks to explain. Changes in the values of
these variables are explained in terms of changes in exogenous variables, whose values are not explained
3. First, identify the question of interest and decide which endogenous variables the model will seek to
explain. Then decide which exogenous variables will be used to explain the endogenous variables of
4. Real gross domestic product, which measures an economy’s aggregate output, is important because it
gives information about both long-term growth and short-run fluctuations of output. The unemployment
5. The business cycle is a sequence of recurring but irregular fluctuations in economic activity. A recession
6. During periods of inflation, the overall level of prices rises. It falls during deflationary periods.
Macroeconomic Policy
7. A nation’s saving rate is the percentage of income that is saved each year. Nations with higher saving
rates tend to also have higher investment levels, which promotes their economic growth. A higher saving
Chapter 1 The Policy and Practice of Macroeconomics 3
8. When government has a budget deficit, it is spending more than the tax revenues it collects and,
therefore, must borrow money and go deeper into debt. Macroeconomists have concerns about the
9. Fiscal policy refers to a government changing its taxes or spending or both. Monetary policy is a
central bank’s control of interest rates and the amount of money in an economy. These policies are
10 Stabilization policy is the use of fiscal and monetary policies to stabilize economic activity by reducing
business cycle fluctuations. One debate concerns how active stabilization policy should be. It pits
11 Global trade imbalances occur when some countries run large trade deficits and become increasingly
indebted to and dependent on large capital inflows from other countries that are running large trade
Answers to Problems
The Practice of Macroeconomics
1. a. The endogenous variable is the variable explained by your model, in this case, the prevalence of
diabetes in children. The exogenous variable is a variable that is determined outside the model
2. A model is as good as its predictive power, in terms of explaining both previous and future changes
in the explained variable. If a current model does not “fit the data,” meaning that it cannot replicate
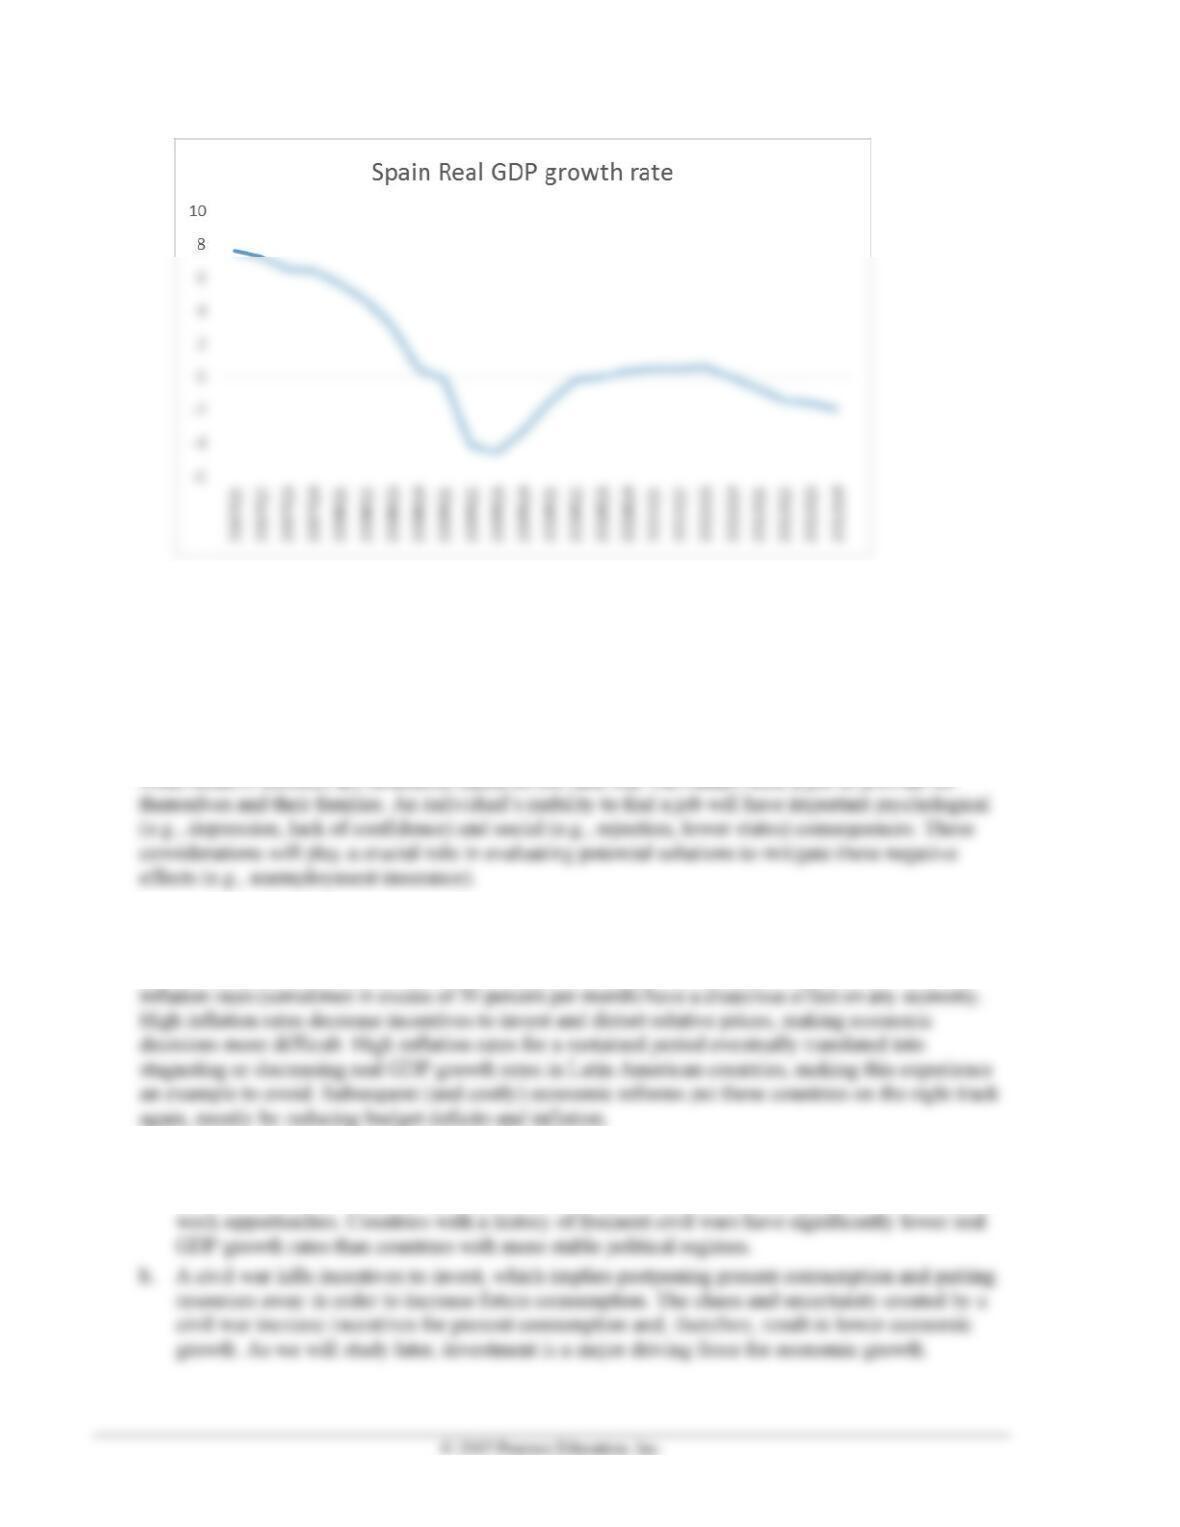
3. a. According to the graph, Spain’s real GDP growth rate decreased from the first quarter of 2007
until the third quarter of 2009. After that the growth rate rose but reached a peak of only 0.6
percent in the third quarter of 2011 and then turned negative again in 2012. Thus, the overall
trend for the Spanish growth rate has been downward.
4 Mishkin • Macroeconomics: Policy and Practice, Second Edition
b. According to data, Spain experienced a recession from the first quarter of 2009 until the third
quarter of 2010. However, Spain entered another recession in the first quarter of 2012, when its
real GDP growth rate again became negative. Although the real GDP growth rate is not the only
indicator of a recession, it usually moves together with other indicators such as the unemployment
rate or investment.
4. Although unemployment definitely has negative consequences in terms of decreased production
of goods and services, that is not the only reason why it is such an important macroeconomic topic.
Most modern societies are structured based on the idea that individuals need a job to provide for
Macroeconomic Policy
5. Budget deficits by themselves are not inherently good or bad. However, as we will study later, they
can be the source of inflation if governments pay for a budget deficit by printing money. Very high
6. a. The immediate effect of the destruction created by a civil war is a decrease in the economy’s
ability to produce goods and services. Goods cannot be moved from producer to buyers, and
fewer individuals are able or willing to work during a civil war, decreasing the labor force and
Chapter 1 The Policy and Practice of Macroeconomics 5
© 2015 Pearson Education, Inc.
7. As a financial crisis develops, businesses find it more difficult to get access to external funds and,
therefore, cannot meet their obligations. This results in business failures as well as rising
8. The fact that Americans currently are not saving enough might have very important implications for
future generations. One of them is that future generations might face higher taxes than present
9. According to the post, the American Recovery and Reinvestment Act was a policy instrument designed
to affect the economic environment and lift the American economy from its recession. This constitutes
10. There is little doubt that actions taken by the Federal Reserve (some of them in coordination with
the U.S. Treasury) in the aftermath of the subprime financial crisis were necessary to restore confidence
in the U.S. financial system. A significant part of these actions involved providing liquidity to different
11. a. The American Recovery and Reinvestment Act of 2009 can be considered an example of
discretionary macroeconomic policy. It was essentially a set of policies intended to support
economic agents affected by the subprime financial crisis and to promote economic recovery.
b. One of the fears related to conducting discretionary policy is that agents will come to expect that
the government will react to accommodate unusual economic downturns. This becomes a
◼ Answers to Data Analysis Problems
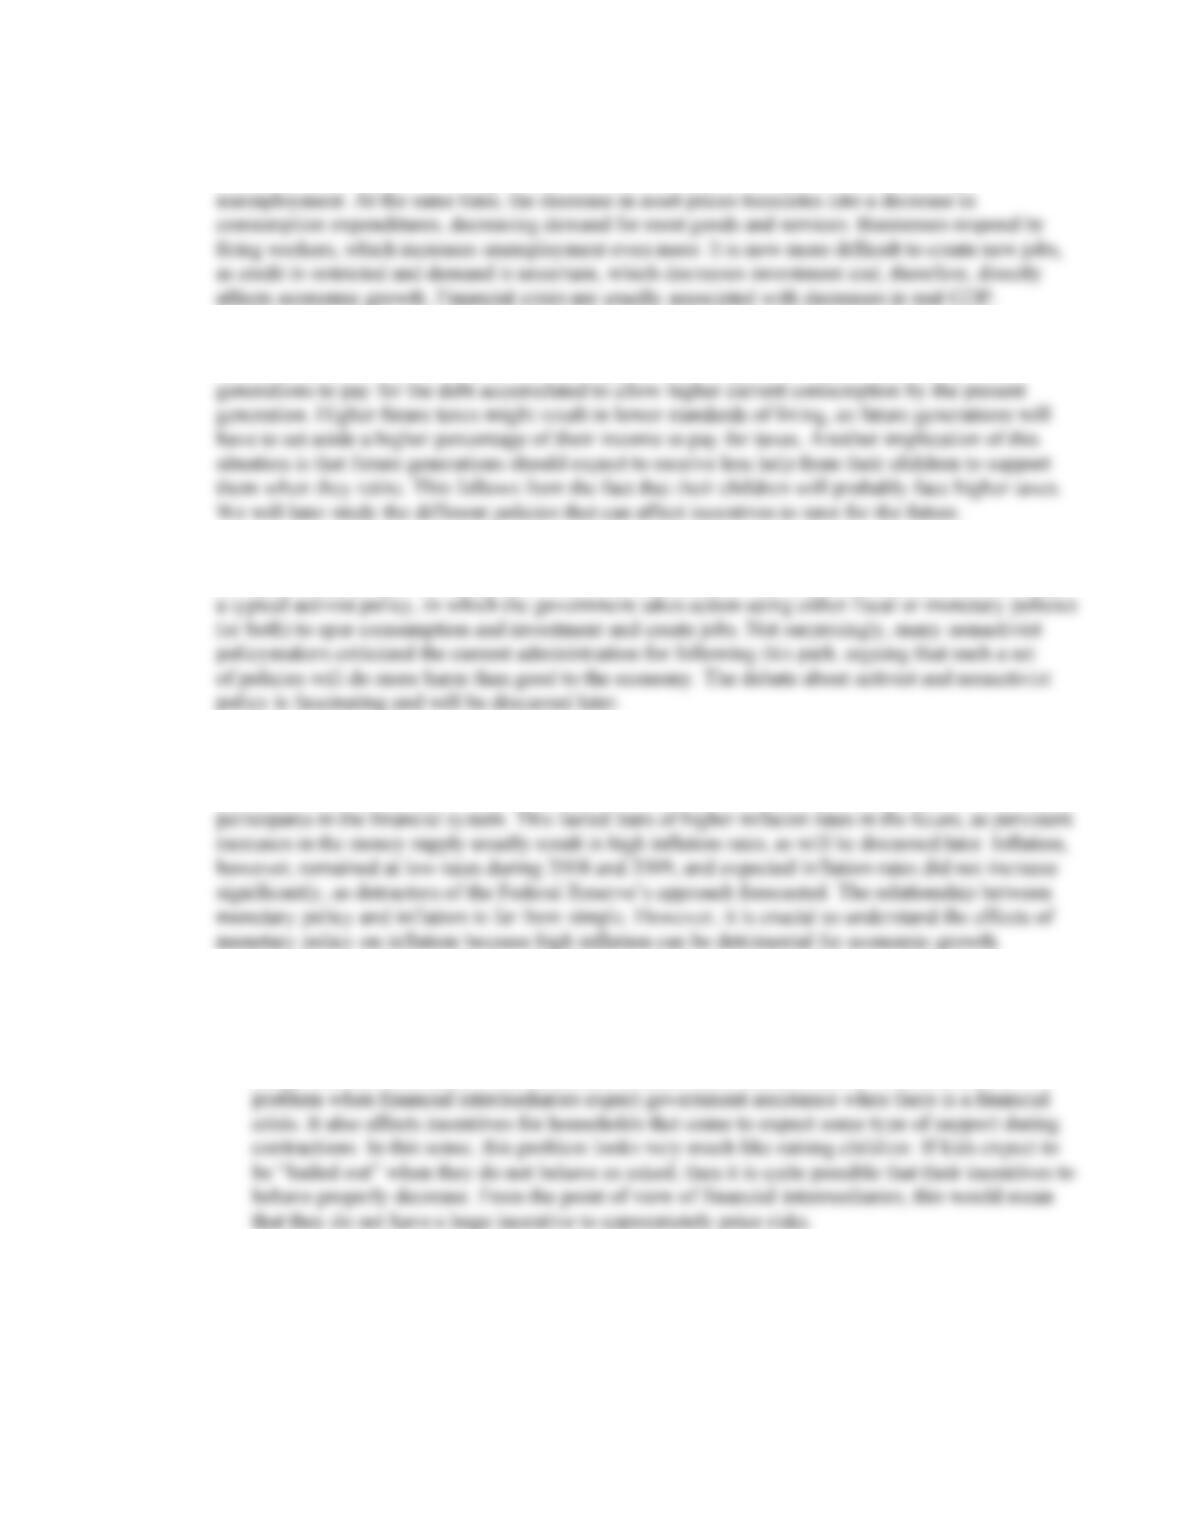
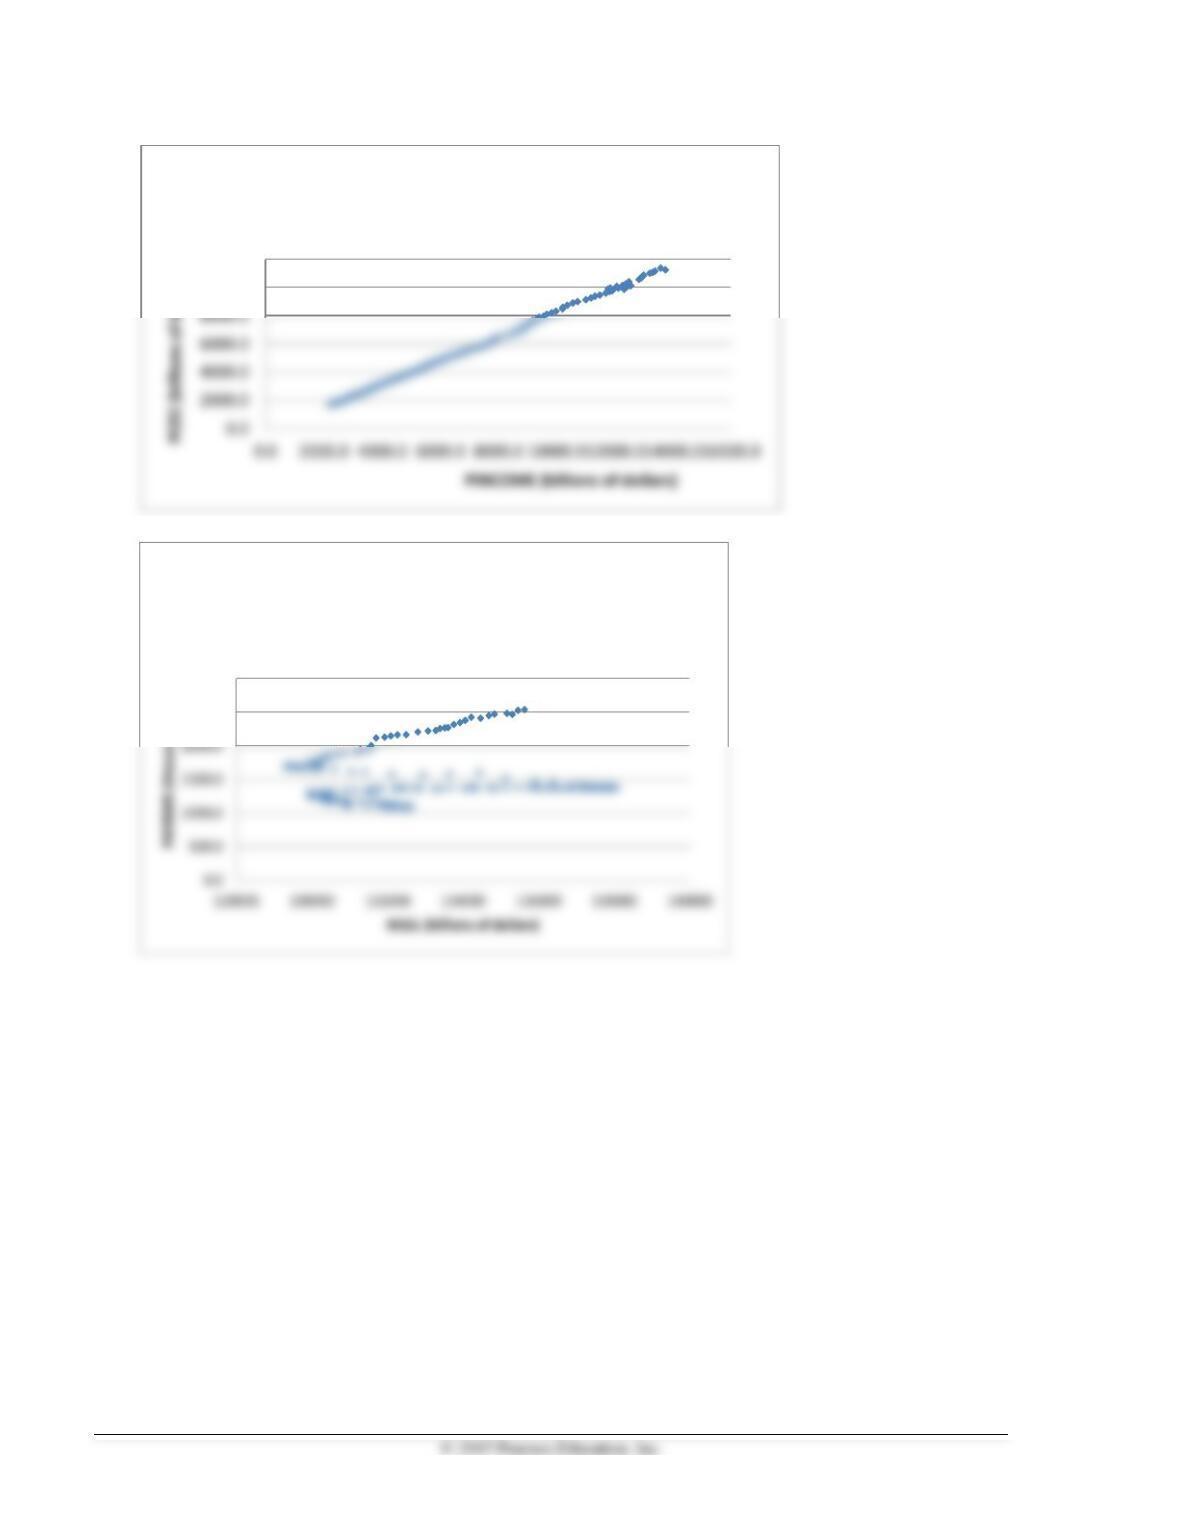
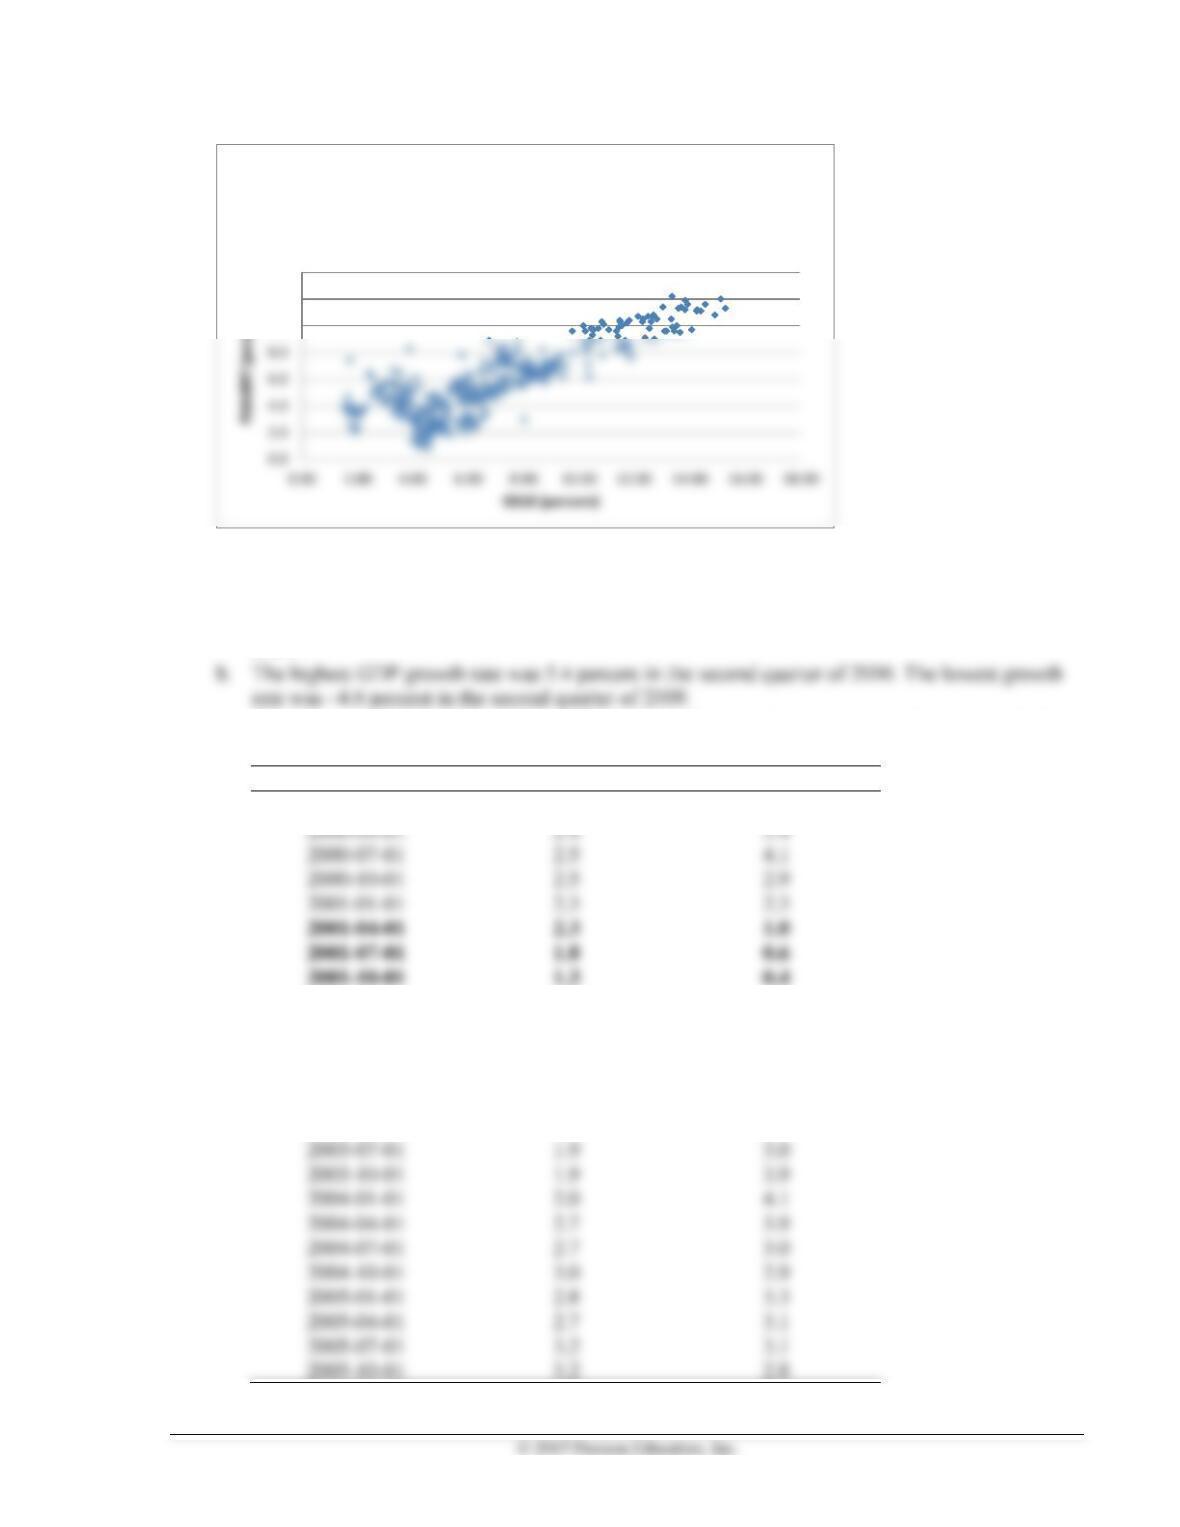
1. PINCOME is exogenous, and PCEC is endogenous; M1SL and PAYEMS are unrelated; GS10 is
exogenous, and PSAVERT is endogenous. Scatterplots are shown below.
6 Mishkin • Macroeconomics: Policy and Practice, Second Edition
10000.0
12000.0
Personal Income vs Consumption,
Quarterly, 1980:1 – 2013:1
2500.0
3000.0
Total Nonfarm Payroll (PAYEMS) vs. M1
Money Supply (M1SL), monthly 2000:1 to
2013:5
Chapter 1 The Policy and Practice of Macroeconomics 7
10.0
12.0
14.0
Personal Saving Rate (PSAVERT) vs. 10
year US Treasury Rate (GS10), monthly,
1980:1 to 2013:4
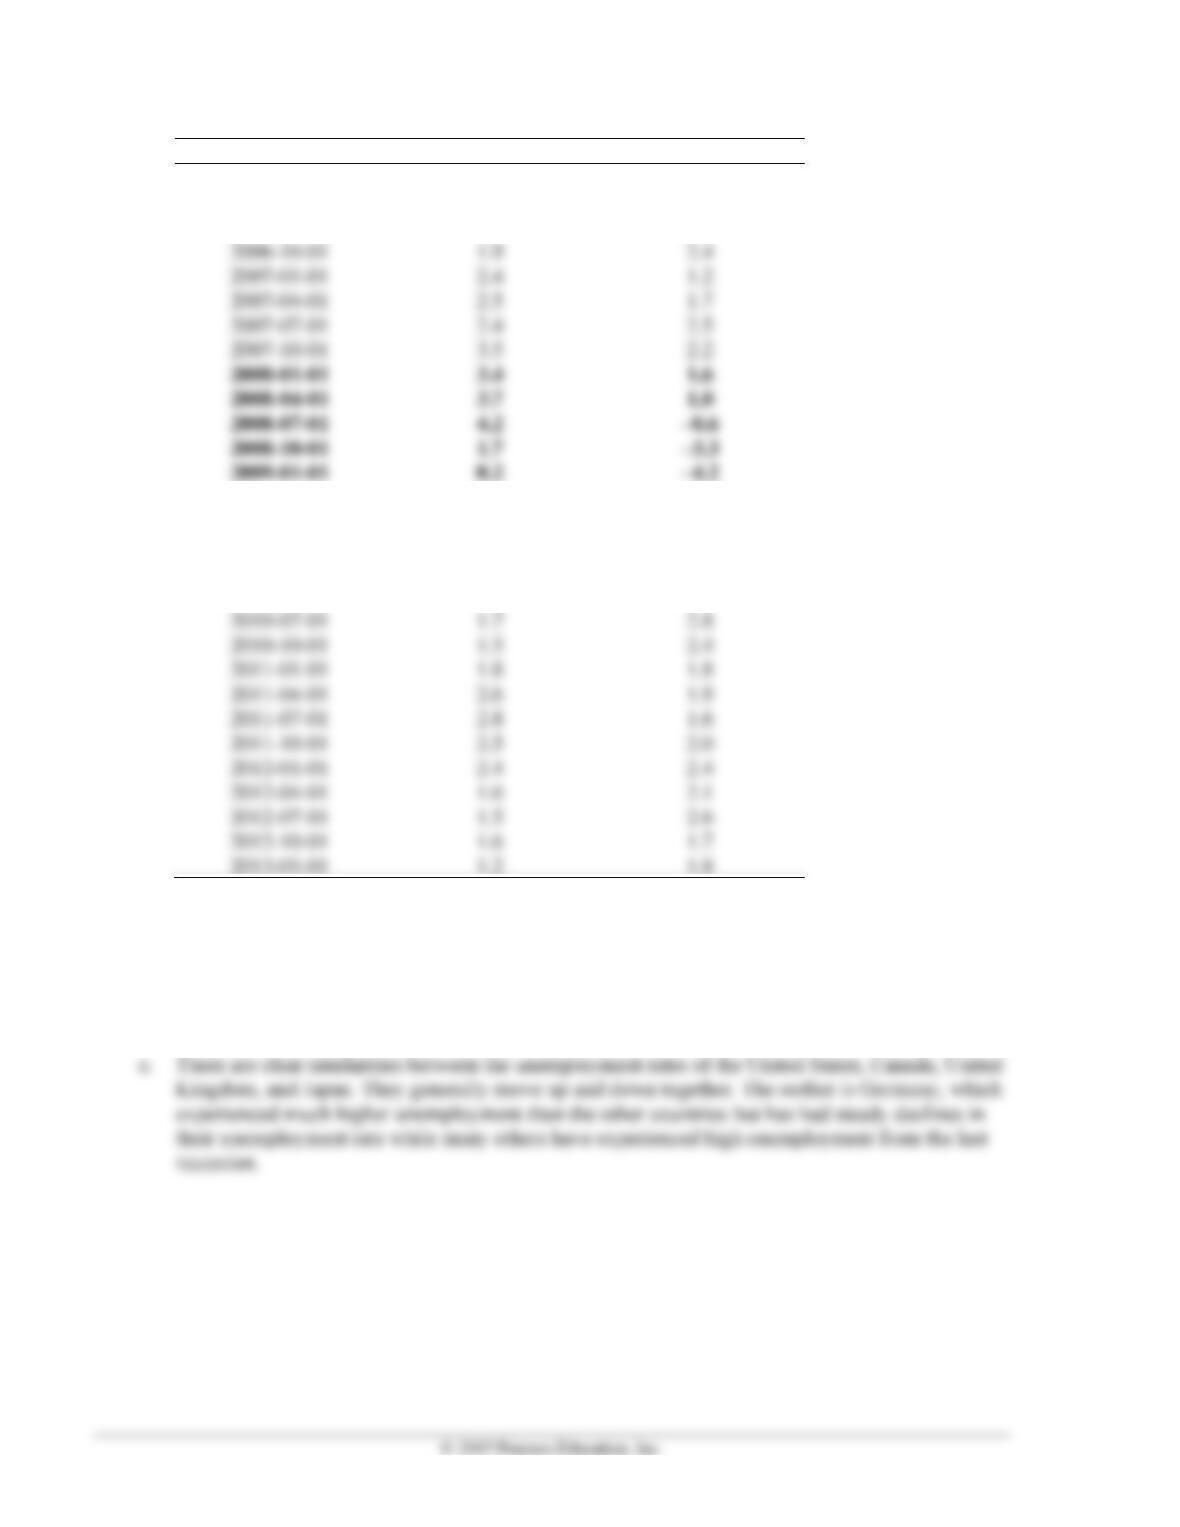
2. Data from 2000 Q1 to 2013 Q1 are shown below, with recessions highlighted.
a. The highest inflation rate was 4.2percent in the third quarter of 2008. The lowest was
–0.8 percent in the third quarter of 2009. Deflation occurred in the second and third quarter of
2009.
c. In general, the periods of recession tend to have the lowest inflation rates and the lowest GDP
growth rates.
Date
PCE Inflation Rate
GDP Growth Rate
2000-01-01
2.6
4.2
2000-04-01
2.4
5.4
2000-07-01
2.5
4.1
2000-10-01
2.5
2.9
2001-01-01
2.3
2.3
2002-01-01
0.8
1.6
2002-04-01
1.1
1.5
2002-07-01
1.6
2.3
2002-10-01
2.0
1.9
2003-01-01
2.5
1.5
2003-04-01
1.8
1.8
2003-07-01
1.9
3.0
2003-10-01
1.9
3.9
2004-01-01
2.0
4.1
2004-04-01
2.7
3.9
2004-07-01
2.7
3.0
2004-10-01
3.0
2.9
2005-01-01
2.8
3.3
2005-04-01
2.7
3.1
2005-07-01
3.2
3.1
2005-10-01
3.2
2.8
8 Mishkin • Macroeconomics: Policy and Practice, Second Edition
Date
PCE Inflation Rate
GDP Growth Rate
2006-01-01
3.1
3.0
2006-04-01
3.2
3.0
2006-07-01
2.8
2.2
2006-10-01
1.9
2.4
2007-01-01
2.4
1.2
2007-04-01
2.5
1.7
2007-07-01
2.4
2.5
2007-10-01
3.5
2.2
2008-04-01
2008-07-01
–0.6
2009-04-01
–0.5
–4.6
2009-07-01
–0.8
–3.3
2009-10-01
1.4
–0.1
2010-01-01
2.4
1.9
2010-04-01
2.1
2.5
2010-07-01
1.7
2.8
2010-10-01
1.5
2.4
2011-01-01
1.8
1.8
2011-04-01
2.6
1.9
2011-07-01
2.8
1.6
2011-10-01
2.5
2.0
2012-01-01
2.4
2.4
2012-04-01
1.6
2.1
2012-07-01
1.5
2.6
2012-10-01
1.6
1.7
2013-01-01
1.2
1.8
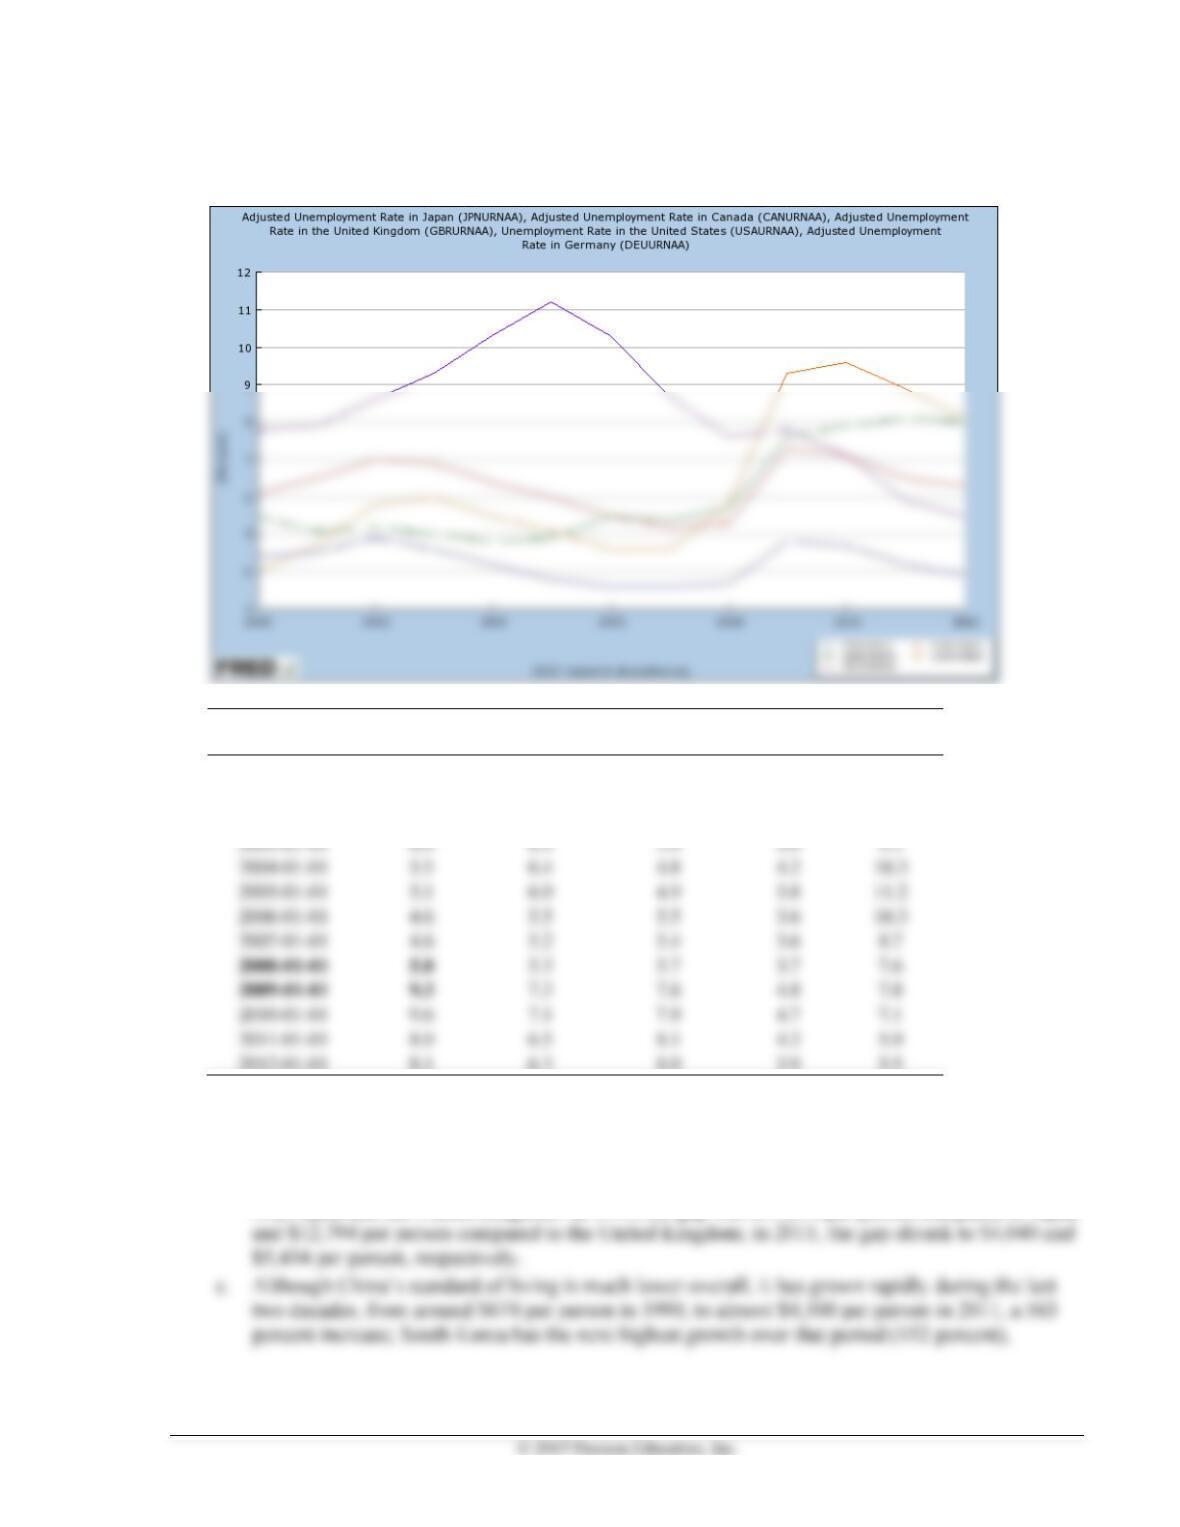
3. a. Germany experienced the highest unemployment rate in 2005 at 11.2 percent; Japan experienced
the lowest unemployment rate in 2007 at 3.6 percent.
b. During years of recession shown in the table, the average unemployment rate is 6.6 percent.
When not in recession, the unemployment is lower at 6.2 percent. This is expected because the
unemployment rate rises during recessions and falls during expansions.
Chapter 1 The Policy and Practice of Macroeconomics 9
Graph and table are shown below, from 2000 to 2012. The bold indicates a year in which the United States
was in recession.
Date
United
States
Canada
United
Kingdom
Japan
Germany
2000–01–01
4.0
6.1
5.5
4.4
7.8
2001–01–01
4.7
6.5
5.1
4.5
7.9
2002–01–01
5.8
7.0
5.2
4.9
8.6
2003–01–01
6.0
6.9
5.0
4.6
9.3
2004–01–01
5.5
6.4
4.8
4.2
10.3
2005–01–01
5.1
6.0
4.9
3.8
11.2
2006–01–01
4.6
5.5
5.5
3.6
10.3
2007–01–01
4.6
5.2
5.4
3.6
8.7
2008–01–01
5.8
5.3
5.7
3.7
7.6
2009–01–01
9.3
7.3
7.6
4.8
7.8
2010–01–01
9.6
7.1
7.9
4.7
7.1
2011–01–01
8.9
6.5
8.1
4.2
5.9
2012–01–01
8.1
6.3
8.0
3.9
5.5
4. a. The United States has the highest standard of living according to the data; China has the lowest
among the five.
b. South Korea’s standard of living has steadily improved over time and has closed a significant gap
with Japan and the United Kingdom. In 1990, the gap was $17,694 per person compared to Japan
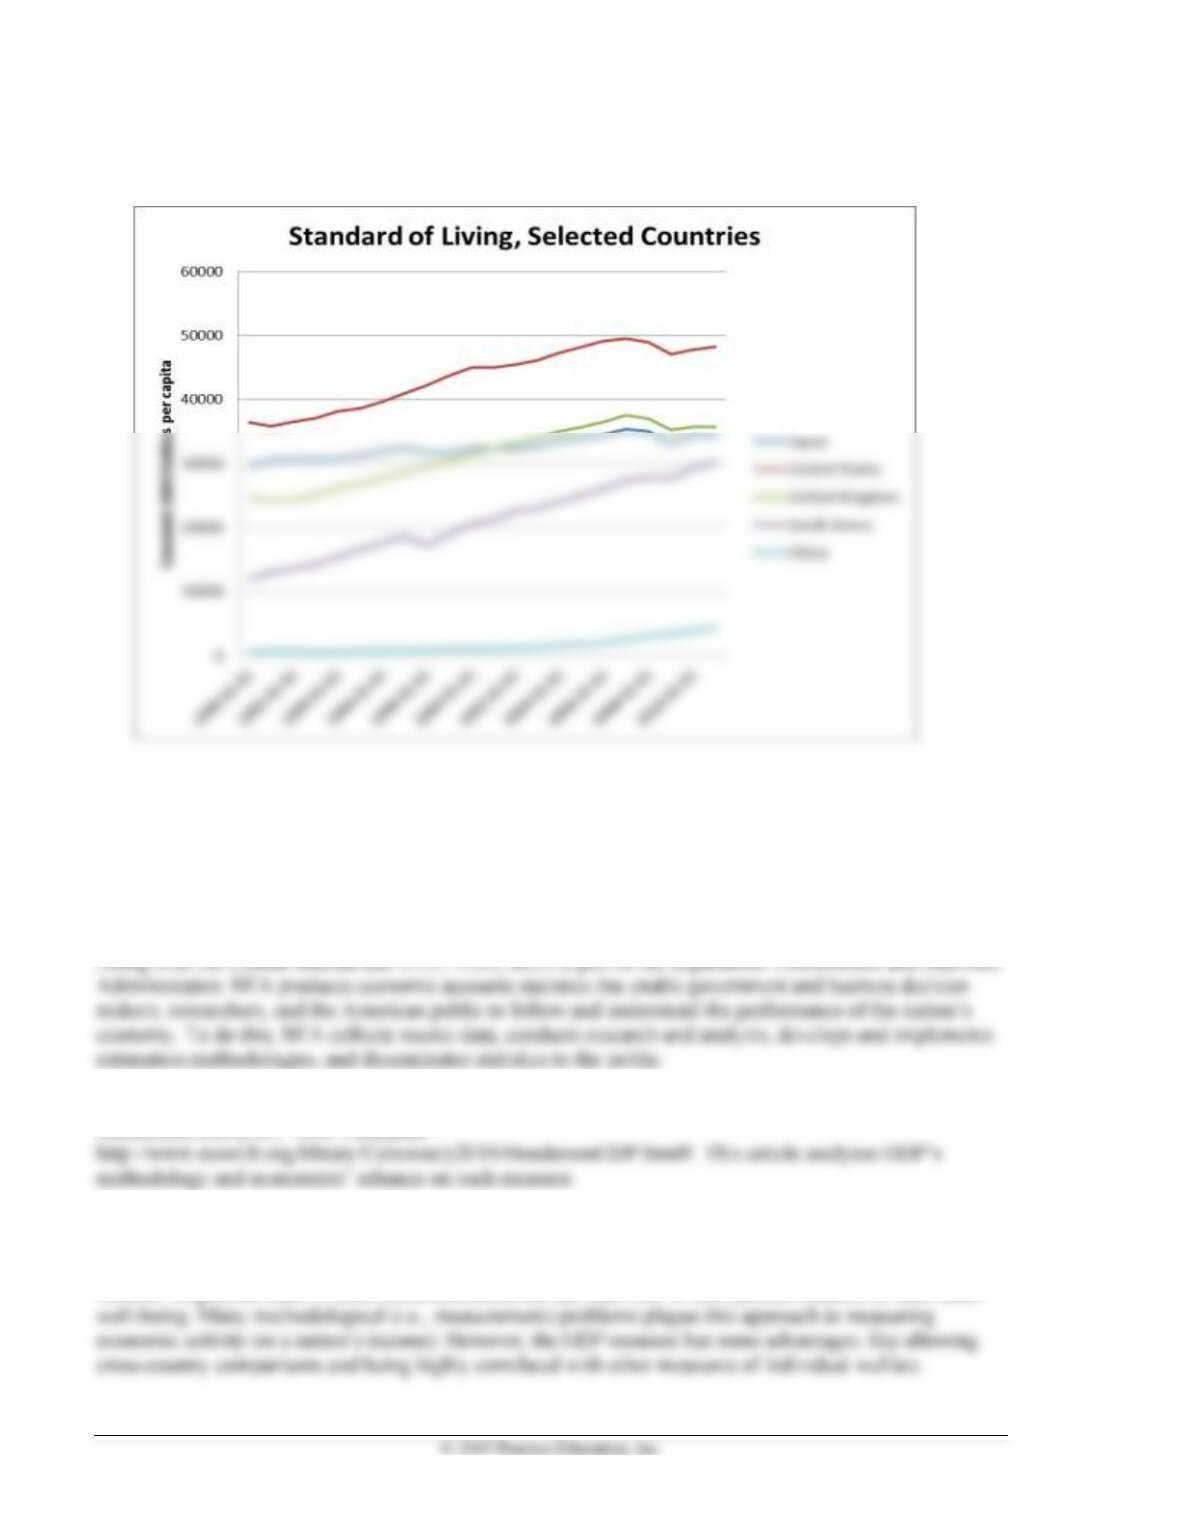
10 Mishkin • Macroeconomics: Policy and Practice, Second Edition
followed by the United Kingdom (44 percent), United States (33 percent), and Japan (16
percent).
◼ Data Sources, Related Articles, and Discussion Questions
A. For Information About Nominal and Real GDP
Data Sources
Bureau of Economic Analysis: http://www.bea.gov/ . BEA is an agency of the Department of Commerce.
Related Articles
Henderson, David R., “GDP Fetishism”:
Discussion Questions
Do you think GDP is a good measure of individuals’ well-being? Why or why not?
Answer: In general, there is some consensus about the fact that GDP is not a perfect measure of individual
Chapter 1 The Policy and Practice of Macroeconomics 11
B. For Information About Inflation and Unemployment
Data Source
Bureau of Labor Statistics: http://www.bls.gov/. The Bureau of Labor Statistics is the principal fact-finding
Related Article
Summers, Lawrence H., “Unemployment”: http://www.econlib.org/library/Enc/Unemployment.html. This
article discusses how unemployment is measured and how unemployment figures should be interpreted.
Discussion Question
Discuss the implications of a decrease in the official unemployment rate for teenagers.
Answer: The official unemployment rate is an average for all participants of the U.S. labor force. Although
C. For Information About the Policy and Practice of Macroeconomics
Data Source
Information about macroeconomic variables (e.g., GDP, inflation, unemployment, savings rate) can be
Related Articls
Library of Economics and Liberty search page:
Discussion Question
What is the object of studying the science of economics in general and macroeconomics in particular?
Answer: In general, the science of economics studies how individuals (or societies) allocate scarce
D. For Information About the Dating of Business Cycles
Data Source
The National Bureau of Economic Research: http://www.nber.org/. Founded in 1920, the National Bureau
of Economic Research is a private, nonprofit, nonpartisan research organization dedicated to promoting a
12 Mishkin • Macroeconomics: Policy and Practice, Second Edition
Related Article
Krugman, Paul, “The Third Depression”: http://www.nytimes.com/2010/06/28/opinion/28krugman.html.
Discussion Question
Using data from the NBER, the BLS, and the BEA, characterize the 2007–2009 recession in terms of
duration, changes in unemployment, inflation, and real GDP.
Answer: According to the NBER, the last recession lasted for 18 months: December 2007 until June 2009.