Basic Econometrics, Gujarati and Porter
CHAPTER 1:
THE NATURE OF REGRESSION ANALYSIS
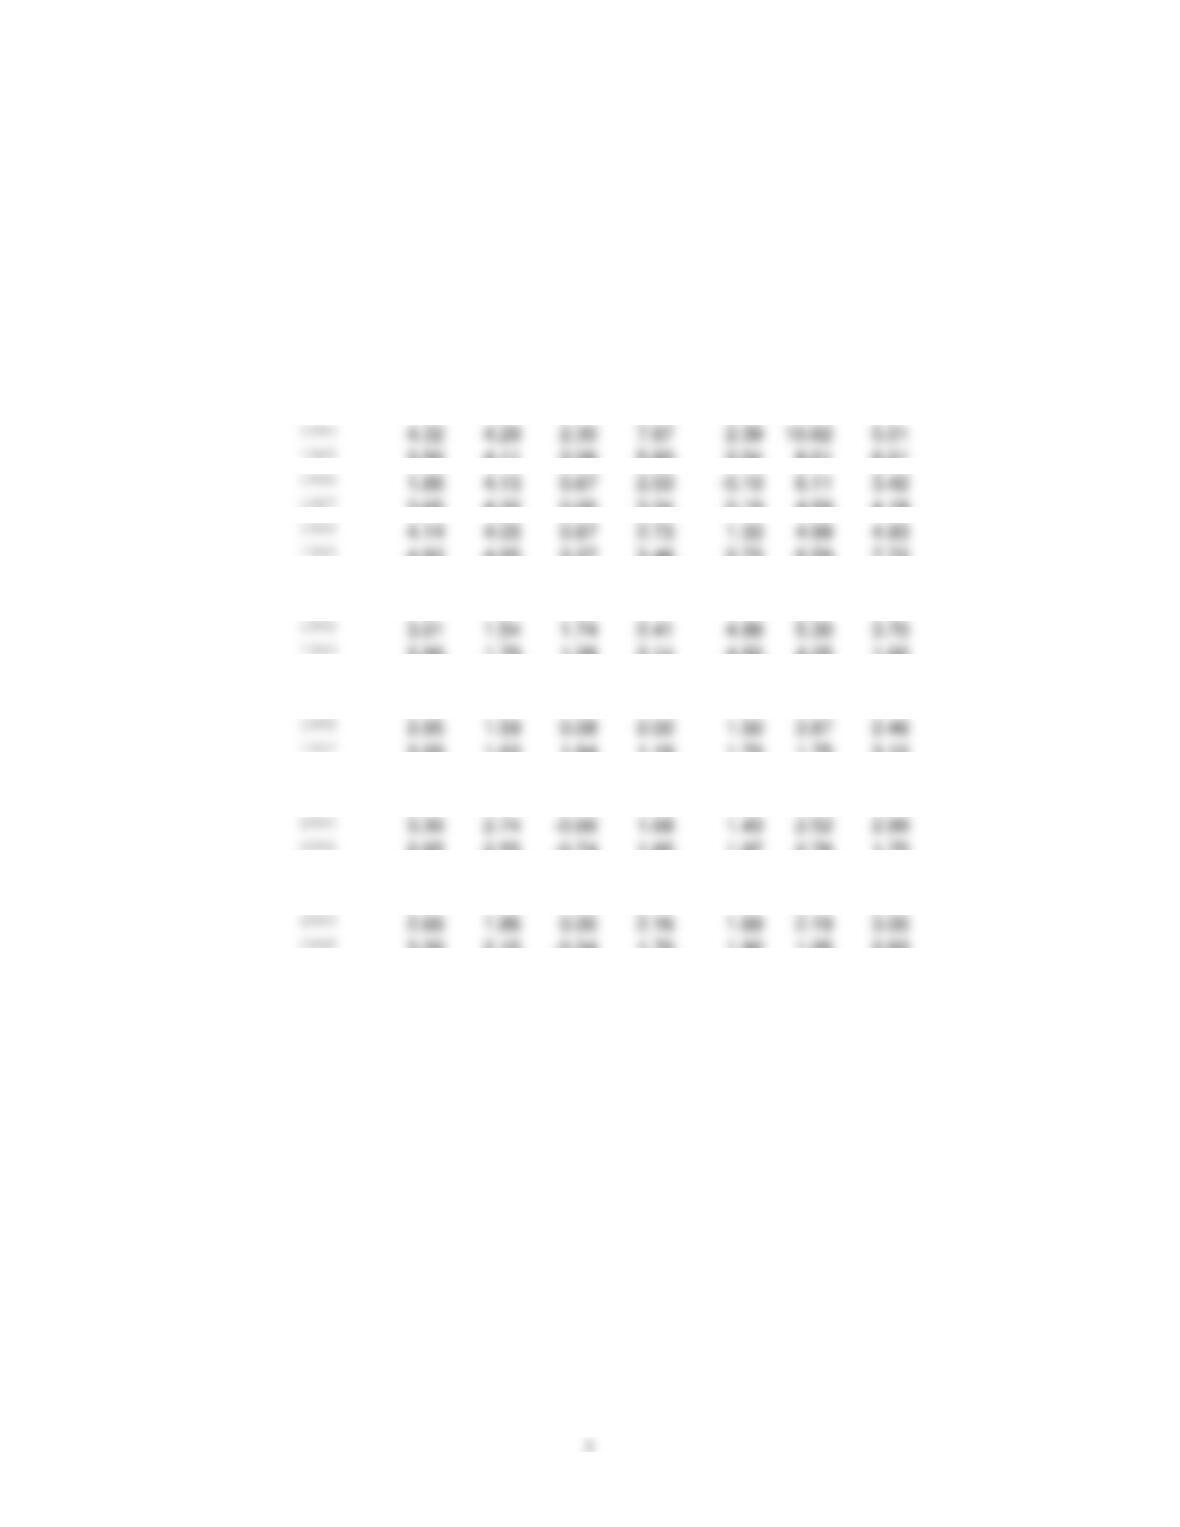
1.1 (a) These rates (%) are as follows. They are year-over-year, starting with
1981.
USA Canada
Japan France Germany
Italy UK
1980
1981
10.32
12.48
4.84
13.28
6.34
19.30
11.97
1982
6.16
10.86
2.94
11.97
5.31
16.31
8.53
1983
3.21
5.80
1.73
9.49
3.30
14.94
4.61
3.56
4.11
2.06
5.83
2.04
8.61
6.01
3.65
4.32
0.00
3.24
0.19
4.59
4.18
4.82
4.95
2.27
3.46
2.73
6.59
7.72
1990
5.40
4.80
3.15
3.34
2.75
6.12
9.53
1991
4.21
5.61
3.23
3.16
3.65
6.39
5.87
2.99
1.79
1.28
2.14
4.50
4.25
1.60
1994
2.56
0.20
0.68
1.60
2.74
3.92
2.48
1995
2.83
2.16
-0.08
1.78
1.83
5.37
3.36
2.29
1.63
1.84
1.19
1.70
1.75
3.12
1998
1.56
0.96
0.58
0.65
0.94
3.15
3.46
1999
2.21
1.71
-0.33
0.52
0.65
1.66
1.52
2.85
2.55
-0.74
1.65
1.97
2.76
1.75
2002
1.58
2.25
-0.92
1.94
1.31
2.52
1.67
2003
2.28
2.78
-0.25
2.08
1.09
2.66
2.90
3.39
2.15
-0.34
1.70
1.92
1.95
2.83
Basic Econometrics, Gujarati and Porter
(b)
(d) As a measure of variability, we can use the standard deviation. These
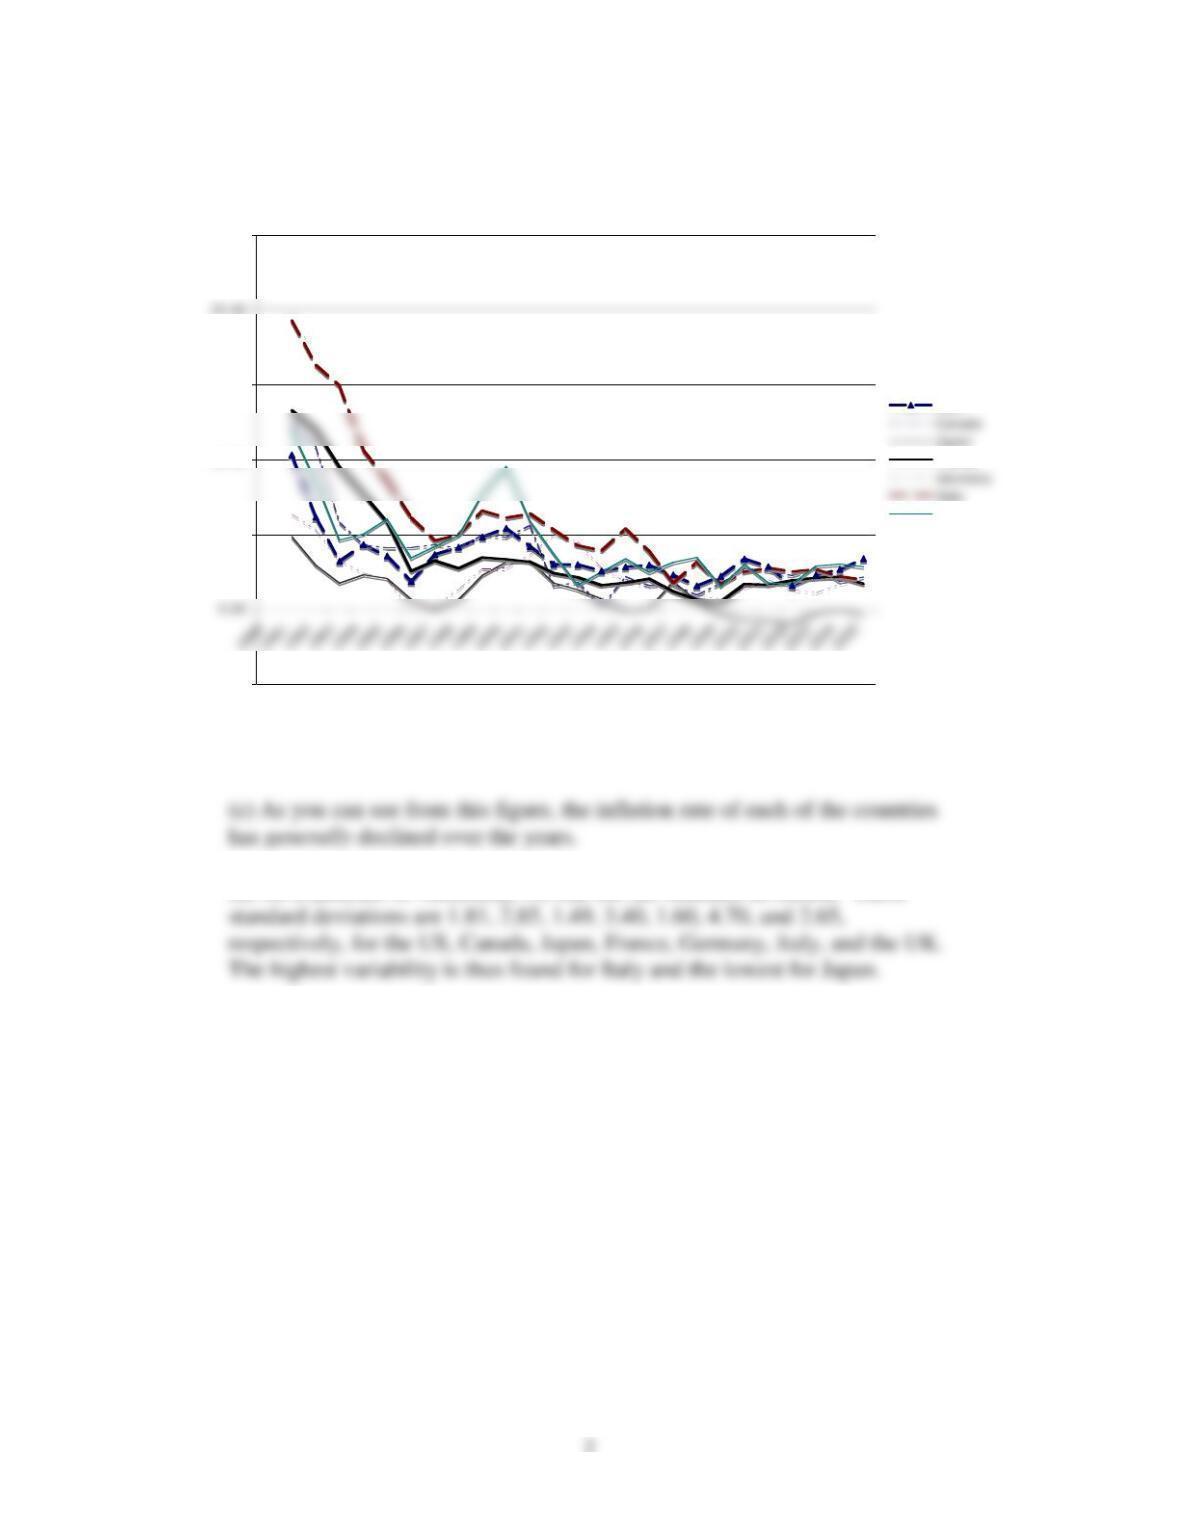
1.2. (a) The graph of the inflation rates of the six countries plotted against the
US inflation rate is as follows:
Inflation Rate over Time
-5.00
5.00
10.00
15.00
25.00
Year
USA
France
UK
Basic Econometrics, Gujarati and Porter
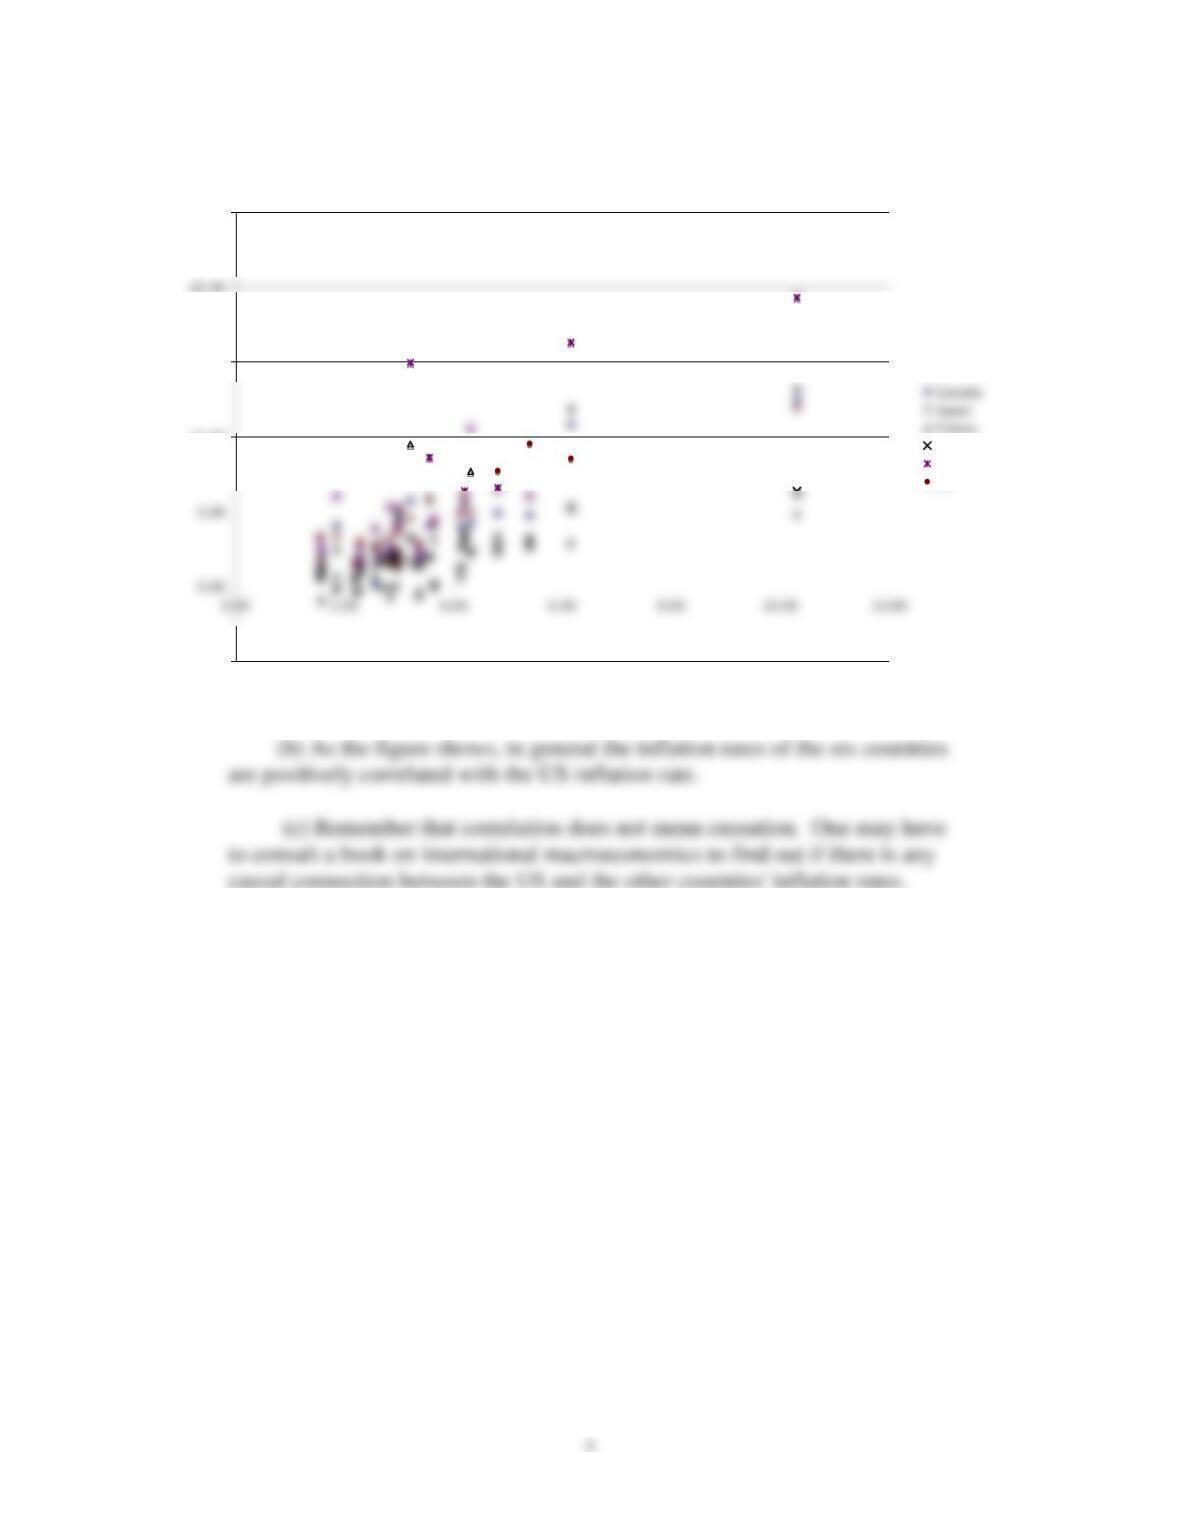
1.3 (a) For better visual impression the logarithm of the exchange rate is
plotted on the vertical axis and time on the horizontal axis.
Inflation Rates in 6 Countries vs US
-5.00
10.00
15.00
25.00
US Inflation Rate
Germany
Italy
UK
Basic Econometrics, Gujarati and Porter
4
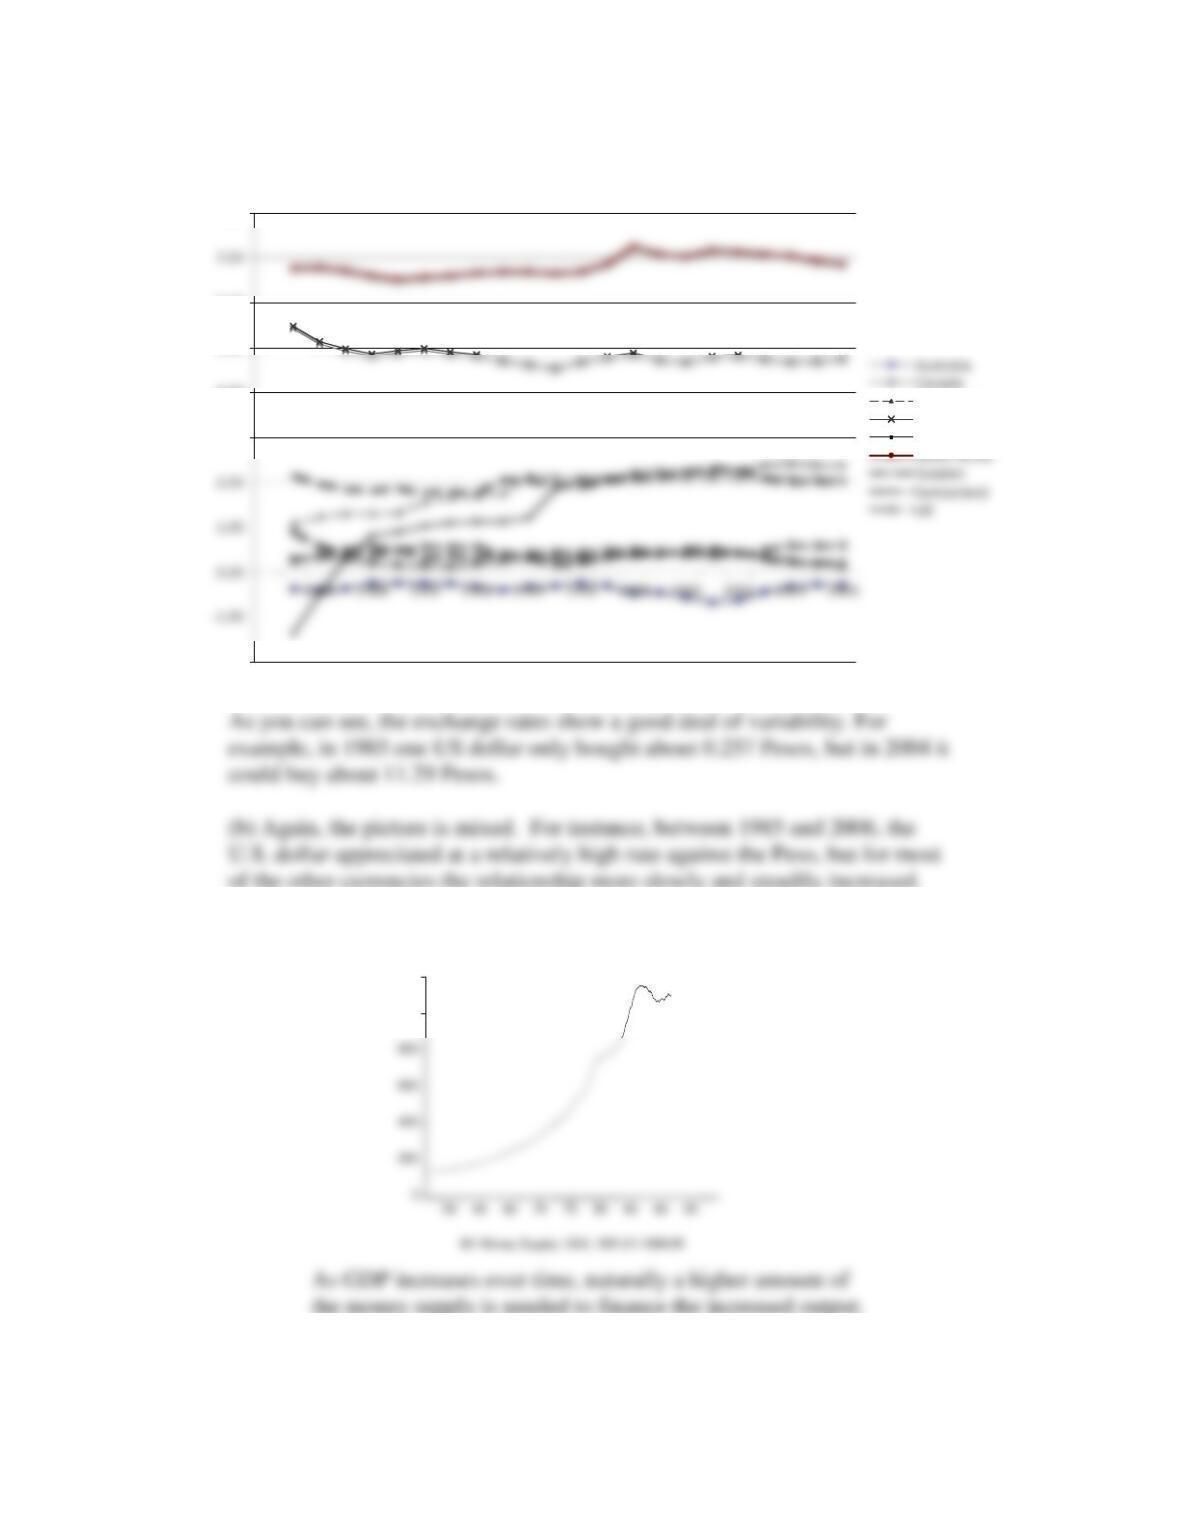
1.4. The graph of the M1 money supply is as follows:
1.5. Some of the relevant variables would include: (1) wages or earnings
1000
1200
Logarithm of Exchange Rates Over Time
-2.00
3.00
4.00
5.00
6.00
8.00
Year
China, P.R.
Japan
Mexico
1.6. One key factor in the analysis would be the labor force participation
rate of people in the 65-69 age category. Data on labor force
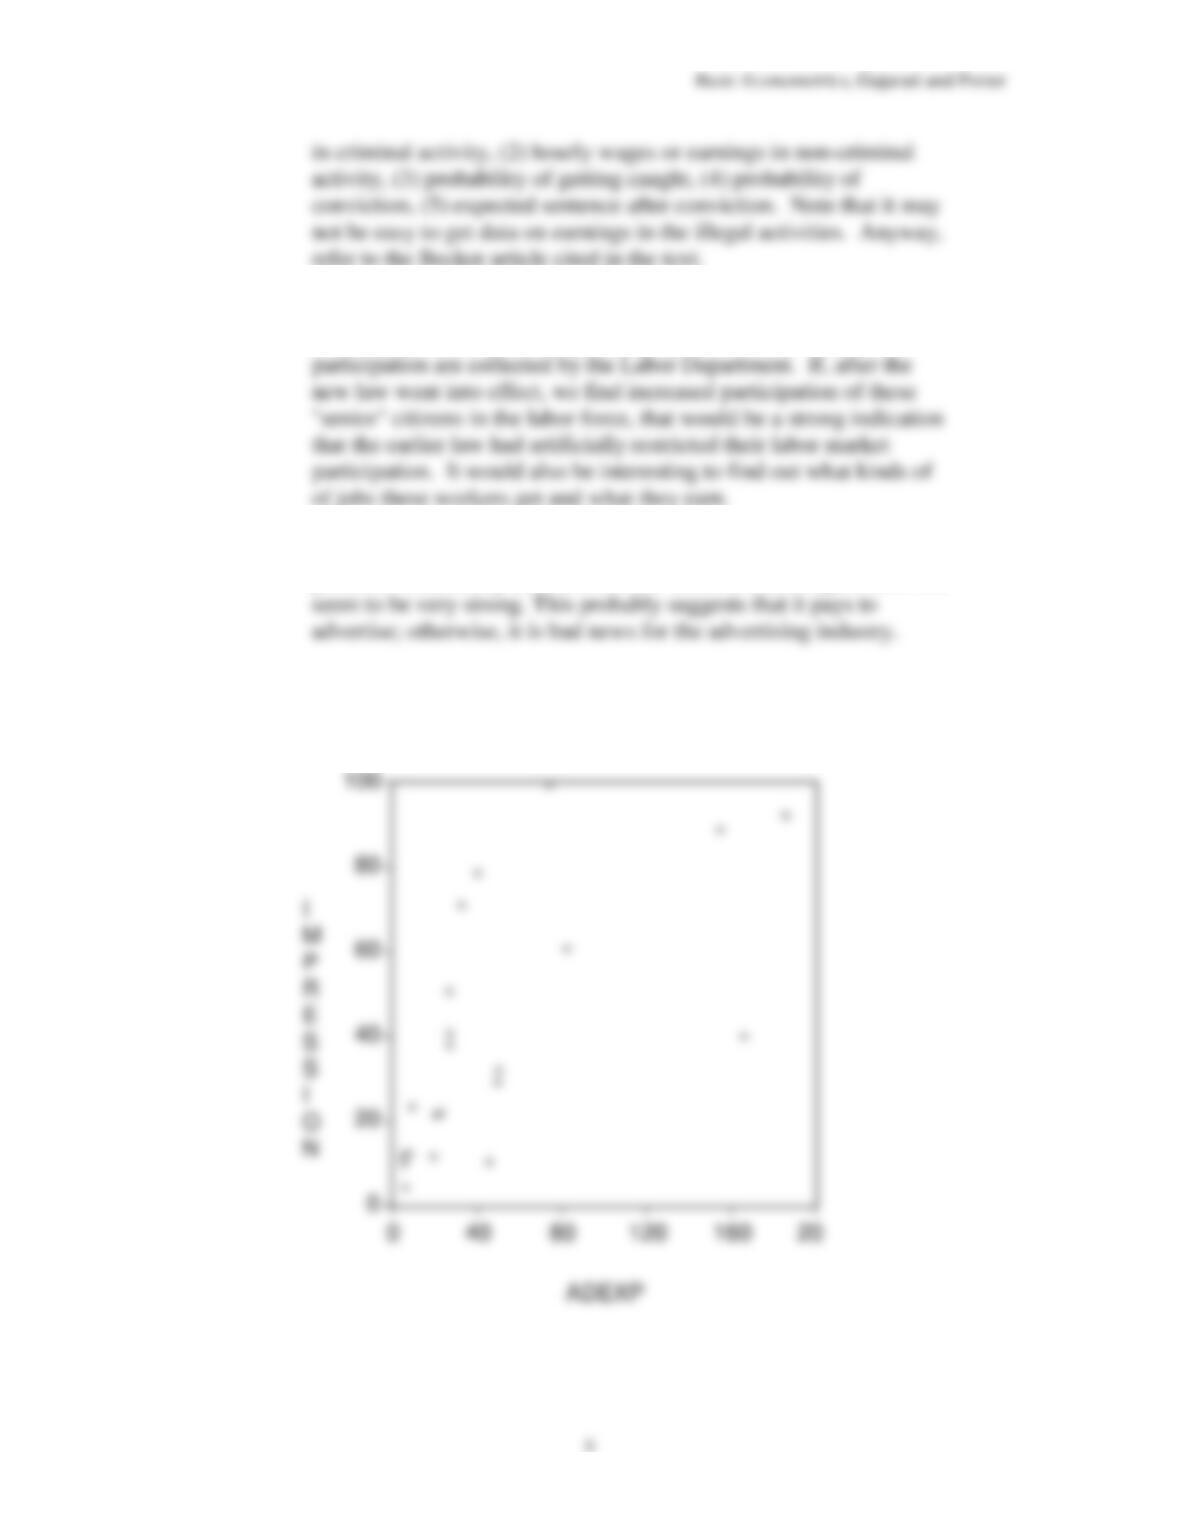
1.7 (a), (b) & (c). As the following figure shows, there seems to be a
positive relationship between the two variables, although it does not