Chapter 01 – Limits, Alternatives, and Choices
1-1
Chapter 01 Limits, Alternatives, and Choices
QUESTIONS
1. What is an opportunity cost? How does the idea relate to the definition of economics? Which
of the following decisions would entail the greater opportunity cost: Allocating a square block in
the heart of New York City for a surface parking lot or allocating a square block at the edge of a
typical suburb for such a lot? Explain. LO1
Answer: An opportunity cost is what was sacrificed to do or acquire something else. The
condition of scarcity creates opportunity cost. If there was no scarcity, there would be no
2. Cite three examples of recent decisions that you made in which you, at least implicitly,
weighed marginal cost and marginal benefit. LO1
Answer: Student answers will vary, but may include the decision to come to class, to
3. What is meant by the term “utility” and how does the idea relate to purposeful behavior? LO1
Answer: “Utility” refers to the pleasure, happiness, or satisfaction gained from engaging
4. What are the key elements of the scientific method and how does this method relate to
economic principles and laws? LO2
Answer: The key elements include the gathering of data (observation), the formulation of
possible explanations (hypothesis), testing the hypothesis, determining the validity of the
Chapter 01 – Limits, Alternatives, and Choices
1-2
5. Indicate whether each of the following statements applies to microeconomics or
macroeconomics:
LO3
a. The unemployment rate in the United States was 9.7 percent in March 2010.
b. A U.S. software firm discharged 15 workers last month and transferred the work to India.
c. An unexpected freeze in central Florida reduced the citrus crop and caused the price of oranges
to rise.
d. U.S. output, adjusted for inflation, decreased by 2.4 percent in 2009.
e. Last week Wells Fargo Bank lowered its interest rate on business loans by one-half of 1
percentage point.
f. The consumer price index rose by 2.7 percent from December 2008 to December 2009.
Answer:
6. State (a) a positive economic statement of your choice, and then (b) a normative economic
statement relating to your first statement. LO3
Answer: Student answers will vary. Example: (a) The unemployment rate is 4.8 percent;
(b) the unemployment rate is too high. In general we treat “what is” statements as
7. What are economic resources? What categories do economists use to classify them? Why are
resources also called factors of production? Why are they called inputs? LO4
Answer: Economic resources are the natural, human, and manufactured inputs used to
Chapter 01 – Limits, Alternatives, and Choices
1-3
8. Why is money not considered to be a capital resource in economics? Why is entrepreneurial
ability considered a category of economic resource, distinct from labor? What are the major
functions of the entrepreneur? LO4
Answer: Money is not considered a capital resource because money is not productive – it
provides access to resources but itself does not directly contribute to the production of
9. Specify and explain the typical shapes of marginal-benefit and marginal-cost curves. How are
these curves used to determine the optimal allocation of resources to a particular product? If
current output is such that marginal cost exceeds marginal benefit, should more or fewer
resources be allocated to this product? Explain. LO5
Answer: The marginal benefit curve is downward sloping, MB falls as more of a product
is consumed because additional units of a good yield less satisfaction than previous units.
Chapter 01 – Limits, Alternatives, and Choices
1-4
10. Explain how (if at all) each of the following events affects the location of a country’s
production possibilities curve: LO5
a. The quality of education increases.
b. The number of unemployed workers increases.
c. A new technique improves the efficiency of extracting copper from ore.
d. A devastating earthquake destroys numerous production facilities.
Answer:
(a) Assuming better education translates into better work skills, then productivity should
rise and this would shift the curve outward.
11. Suppose that, on the basis of a nation’s production possibilities curve, an economy must
sacrifice 10,000 pizzas domestically to get the 1 additional industrial robot it desires but that it
can get the robot from another country in exchange for 9000 pizzas. Relate this information to the
following statement:
“Through international specialization and trade, a nation can reduce its opportunity cost of
obtaining goods and thus ‘move outside its production possibilities curve.’” LO6
Answer: The message of the production possibilities curve is that an individual nation is
limited to the combinations of output indicated by its production possibilities curve.
12. LAST WORD Studies indicate that married men on average earn more income than
unmarried men of the same age and education level. Why must we be cautious in concluding that
marriage is the cause and higher income is the effect?
Answer: Correlation does not necessarily mean that there is causation. The relationship
Chapter 01 – Limits, Alternatives, and Choices
1-5
PROBLEMS
1. Potatoes cost Janice $1 per pound, and she has $5.00 that she could possibly spend on potatoes
or other items. If she feels that the first pound of potatoes is worth $1.50, the second pound is
worth $1.14, the third pound is worth $1.05, and all subsequent pounds are worth $0.30, how
many pounds of potatoes will she purchase? What if she only had $2 to spend? LO1
Answer: 3,2
Feedback: Janice will purchase potatoes until the value of potatoes is less than the cost
of potatoes or until her income has been exhausted. For example, assume Janice has
2. Pham can work as many or as few hours as she wants at the college bookstore for $9 per hour.
But due to her hectic schedule, she has just 15 hours per week that she can spend working at
either the bookstore or at other potential jobs. One potential job, at a café, will pay her $12 per
hour for up to 6 hours per week. She has another job offer at a garage that will pay her $10 an
hour for up to 5 hours per week. And she has a potential job at a daycare center that will pay her
$8.50 per hour for as many hours as she can work. If her goal is to maximize the amount of
money she can make each week, how many hours will she work at the bookstore? LO1
Answer: 4.
Feedback: Pham will choose to work at the bookstore as long as the wage rate at the
bookstore exceeds her other opportunities. However, if another job offers a higher wage
Chapter 01 – Limits, Alternatives, and Choices
1-6
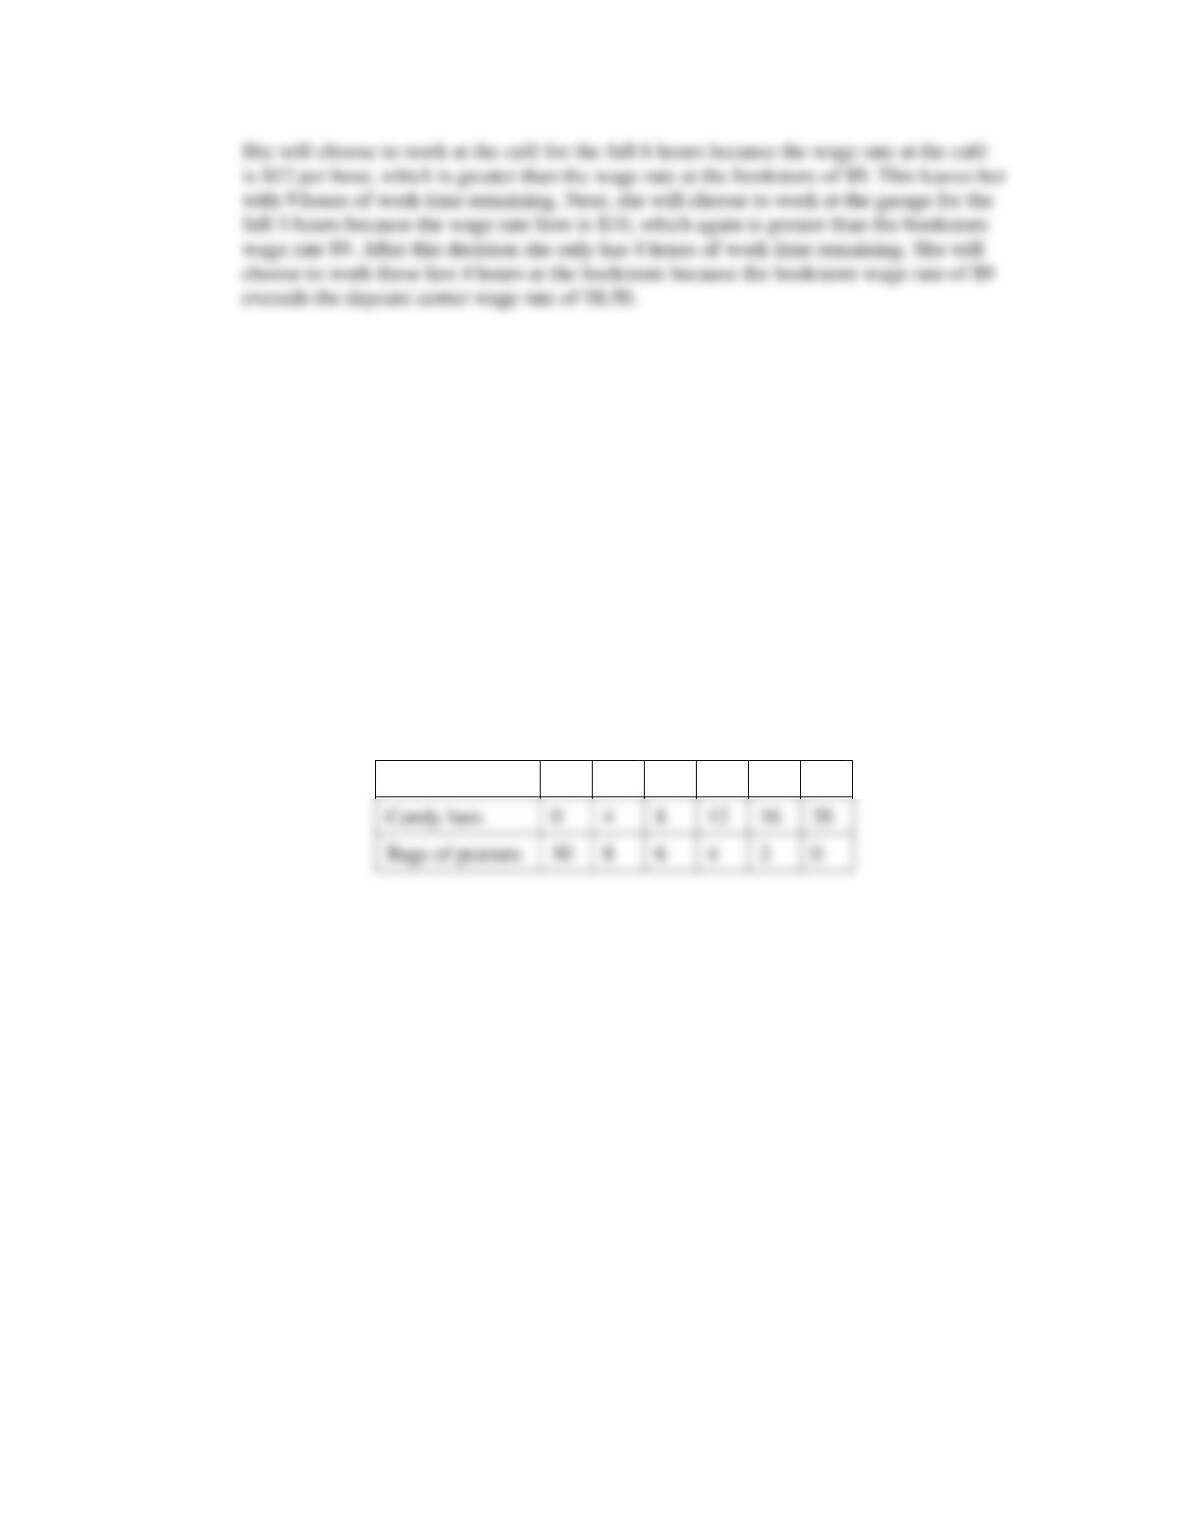
3. Suppose you won $15 on a lotto ticket at the local 7-Eleven and decided to spend all the
winnings on candy bars and bags of peanuts. The price of candy bars is $.75 and the price of
peanuts is $1.50. LO4
a. Construct a table showing the alternative combinations of the two products that are available.
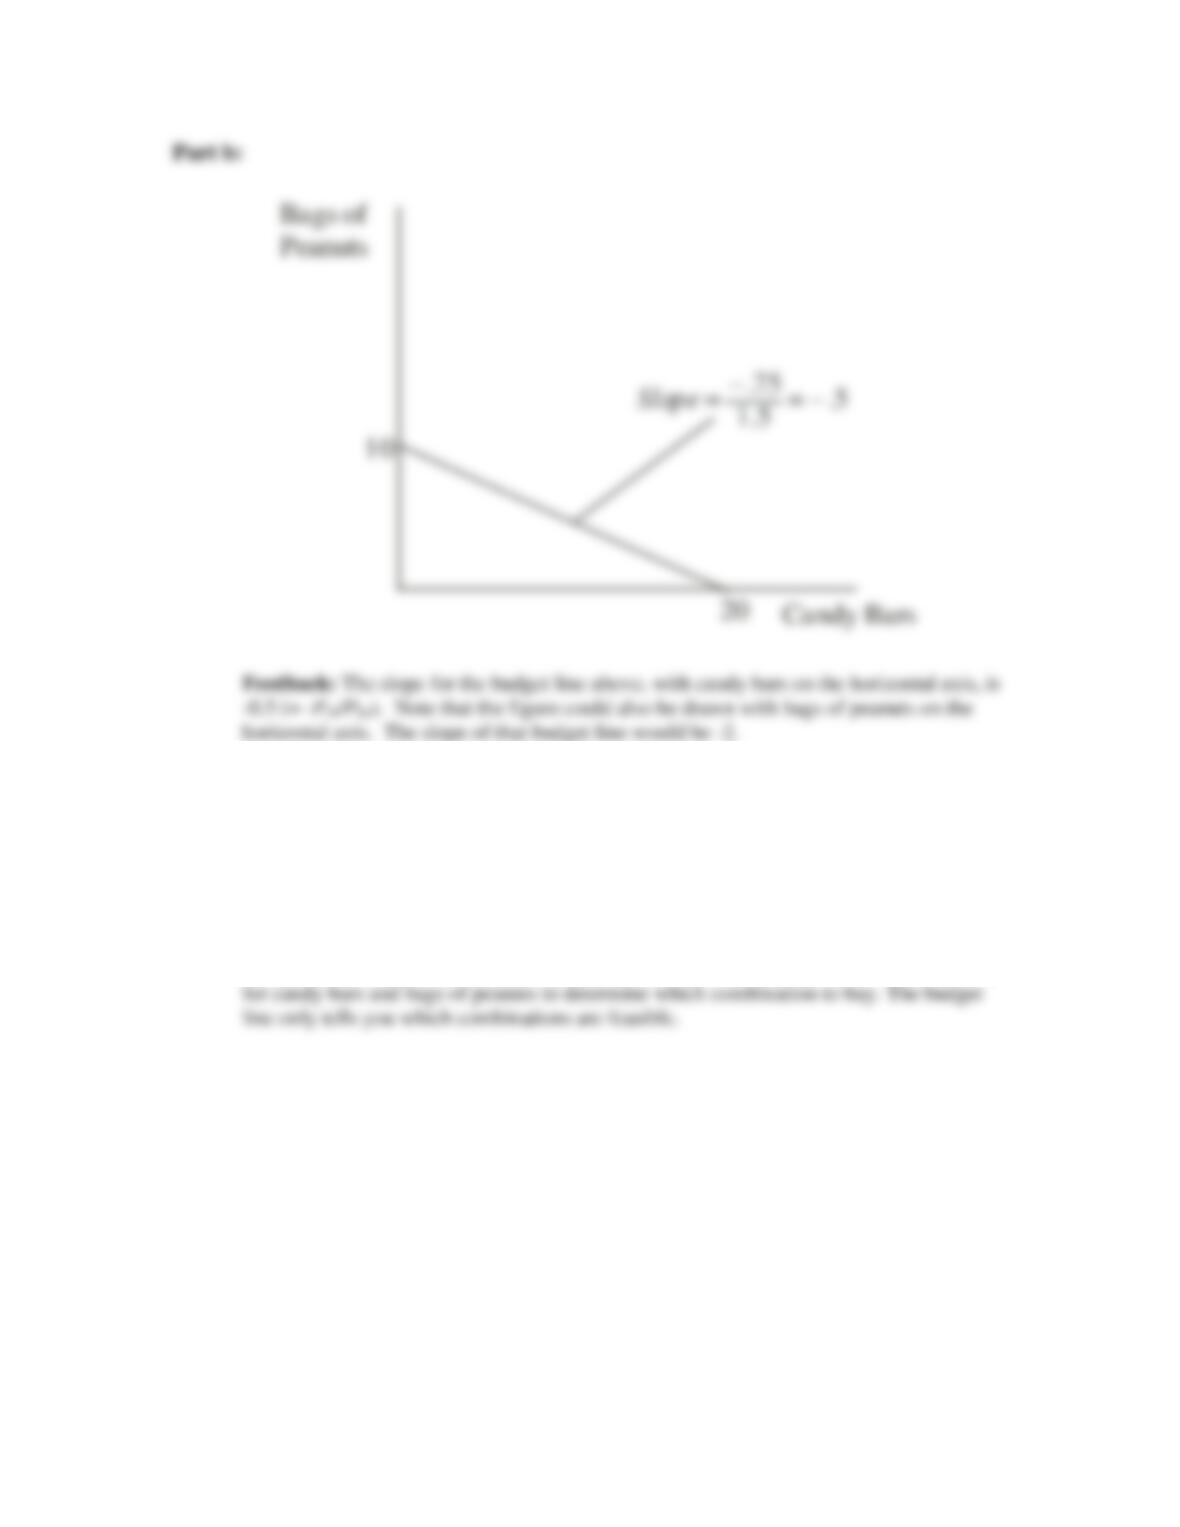
b. Plot the data in your table as a budget line in a graph. What is the slope of the budget line?
What is the opportunity cost of one more candy bar? Of one more bag of peanuts? Do these
opportunity costs rise, fall, or remain constant as each additional unit of the product is purchased?
c. Does the budget line tell you which of the available combinations of candy bars and bags of
peanuts to buy?
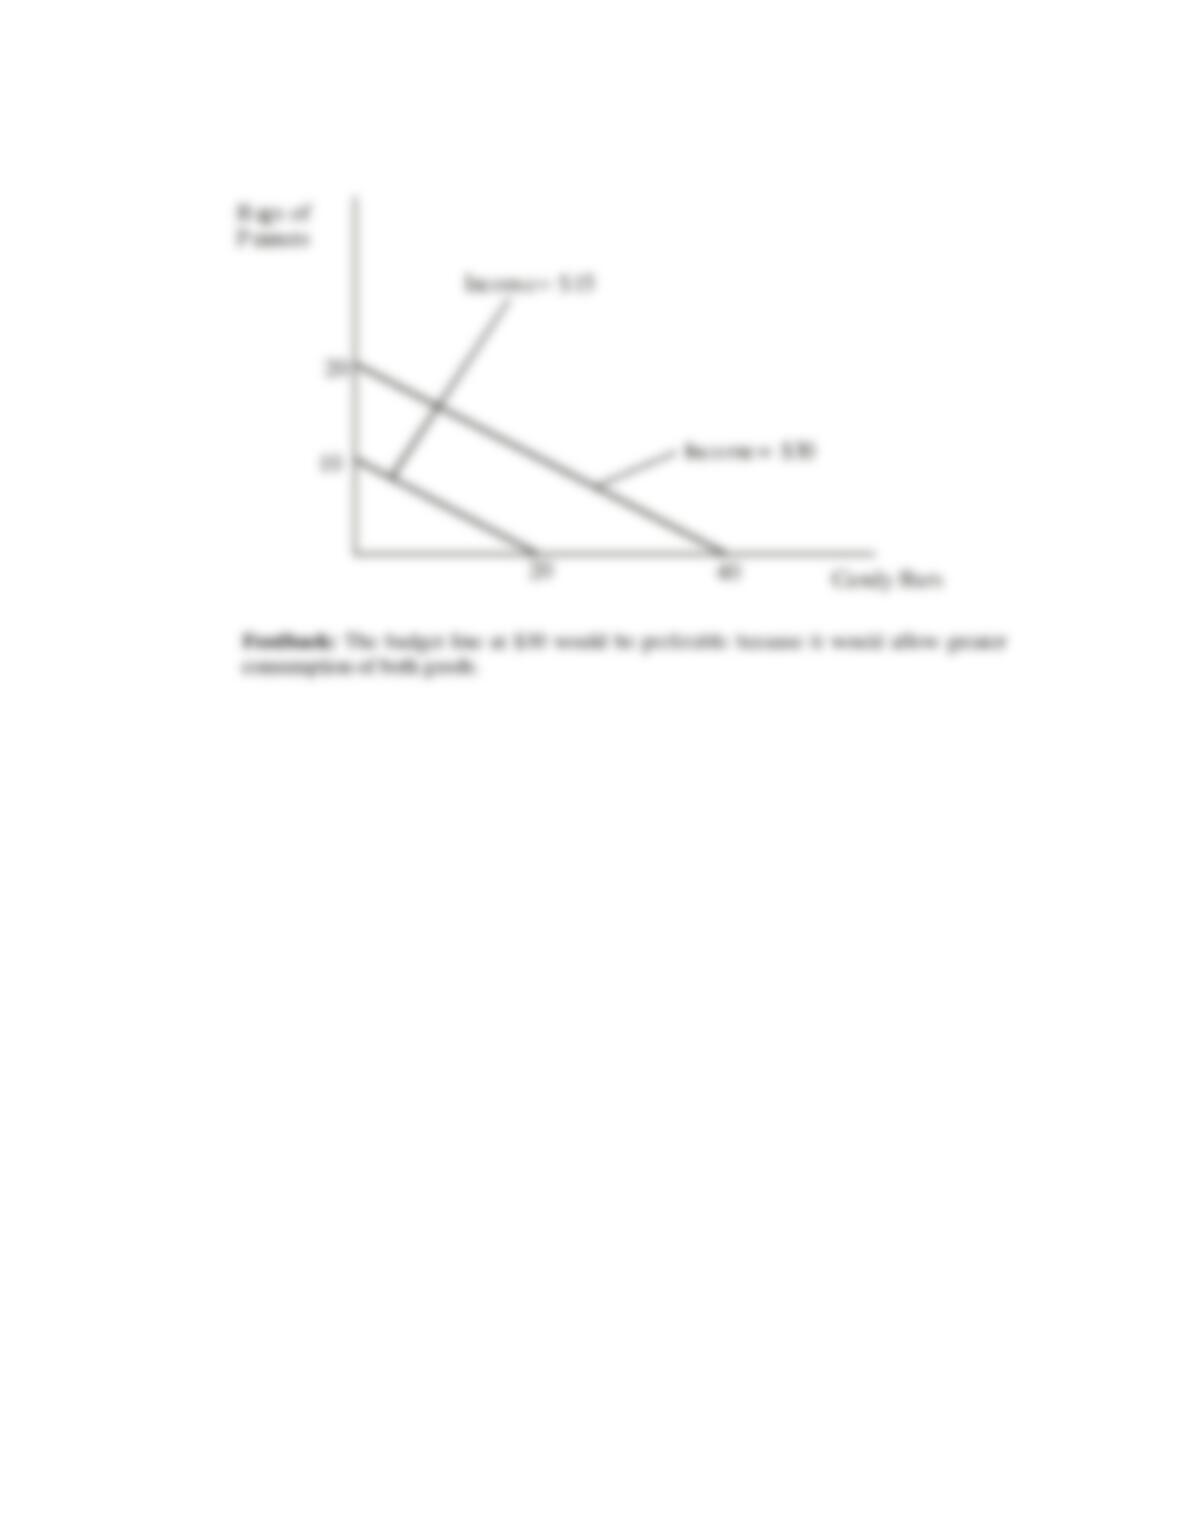
d. Suppose that you had won $30 on your ticket, not $15. Show the $30 budget line in your
diagram. Has the number of available combinations increased or decreased?
Answers:
Part a:
Consumption alternatives
Goods
A
B
C
D
E
F
Chapter 01 – Limits, Alternatives, and Choices
1-7
The opportunity cost of one more candy bar is ½ of a bag of peanuts. The opportunity
cost of one more bag of peanuts is 2 candy bars. These opportunity costs are constant.
They can be found by comparing any two of the consumption alternatives for the two
goods.
Part c: No; it only tells you what is possible.
Feedback: The budget line does not tell you which of the available combinations of
candy bars and bags of peanuts to buy. You will need to use your preference relationship
Chapter 01 – Limits, Alternatives, and Choices
1-8
Part d: Increased.
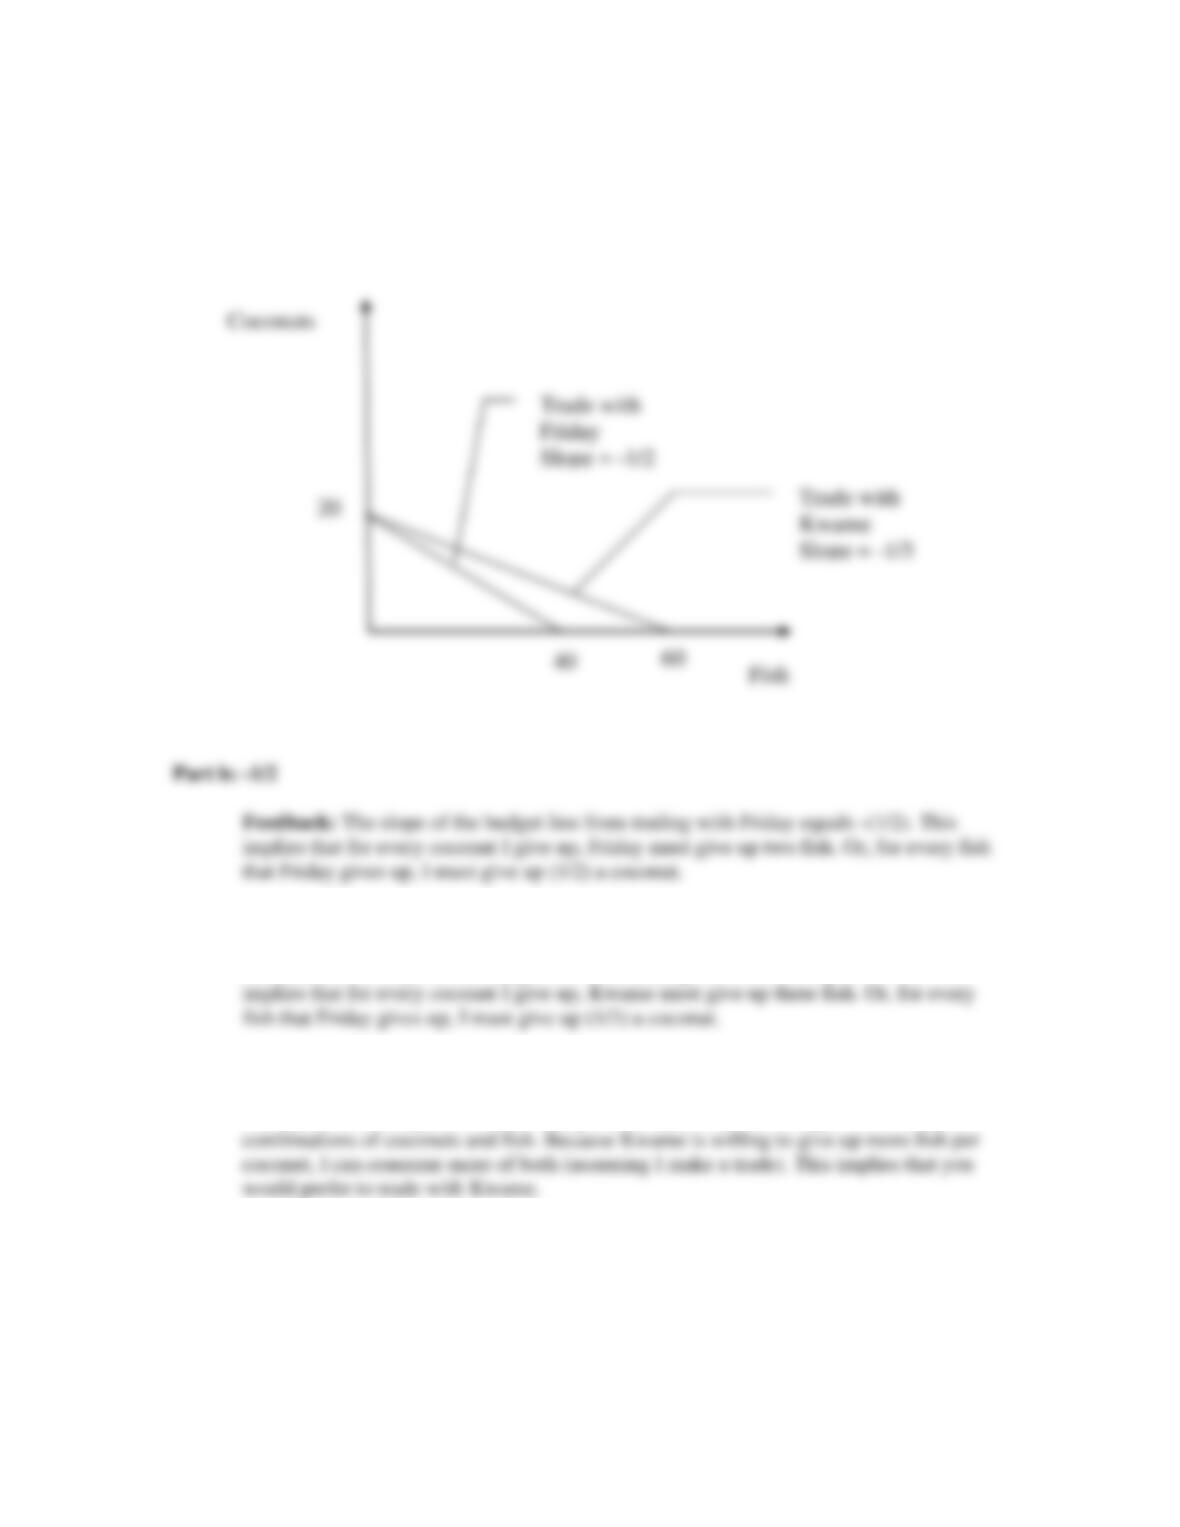
4. Suppose that you are on a desert island and possess exactly 20 coconuts. Your neighbor,
Friday, is a fisherman, and he is willing to trade 2 fish for every 1 coconut that you are willing to
give him. Another neighbor, Kwame, is also a fisherman, and he is willing to trade 3 fish for
every 1 coconut. LO4
a. On a single figure, draw budget lines for trading with Friday and for trading with Kwame. (Put
coconuts on the vertical axis.)
b. What is the slope of the budget line from trading with Friday?
c. What is the slope of the budget line from trading with Kwame?
d. Which budget line features a larger set of attainable combinations of coconuts and fish?
e. If you are going to trade coconuts for fish, would you rather trade with Friday or Kwame?
Chapter 01 – Limits, Alternatives, and Choices
1-9
Answers:
Part a: < Connect editor, make sure that both lines can be placed on a single figure and that
coconuts are on the vertical axis >
Part c: -1/3
Feedback: The slope of the budget line from trading with Kwame equals -(1/3). This
Part d: The budget line from trading with Kwame
Feedback: The budget line from trading with Kwame features a larger set of attainable
Part e: Kwame
Feedback: Because Kwame is willing to give up more fish per coconut, I can consume
more of both (assuming I make a trade). This implies that you would prefer to trade with
Kwame.
Chapter 01 – Limits, Alternatives, and Choices
1-10
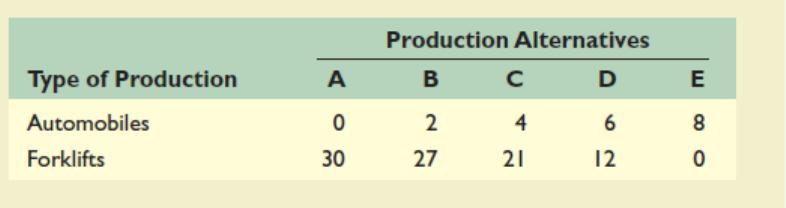
5. Below is a production possibilities table for consumer goods (automobiles) and capital goods
(forklifts):
LO5
a. Show these data graphically. Upon what specific assumptions is this production possibilities
curve based?
b. If the economy is at point C, what is the cost of one more automobile? Of one more forklift?
Which characteristic of the production possibilities curve reflects the law of increasing
opportunity costs: its shape or its length?
c. If the economy characterized by this production possibilities table and curve were producing 3
automobiles and 20 fork lifts, what could you conclude about its use of its available resources?
d. Is production at a point outside the production possibilities curve currently possible? Could a
future advance in technology allow production beyond the current production possibilities curve?
Could international trade allow a country to consume beyond its current production possibilities
curve?
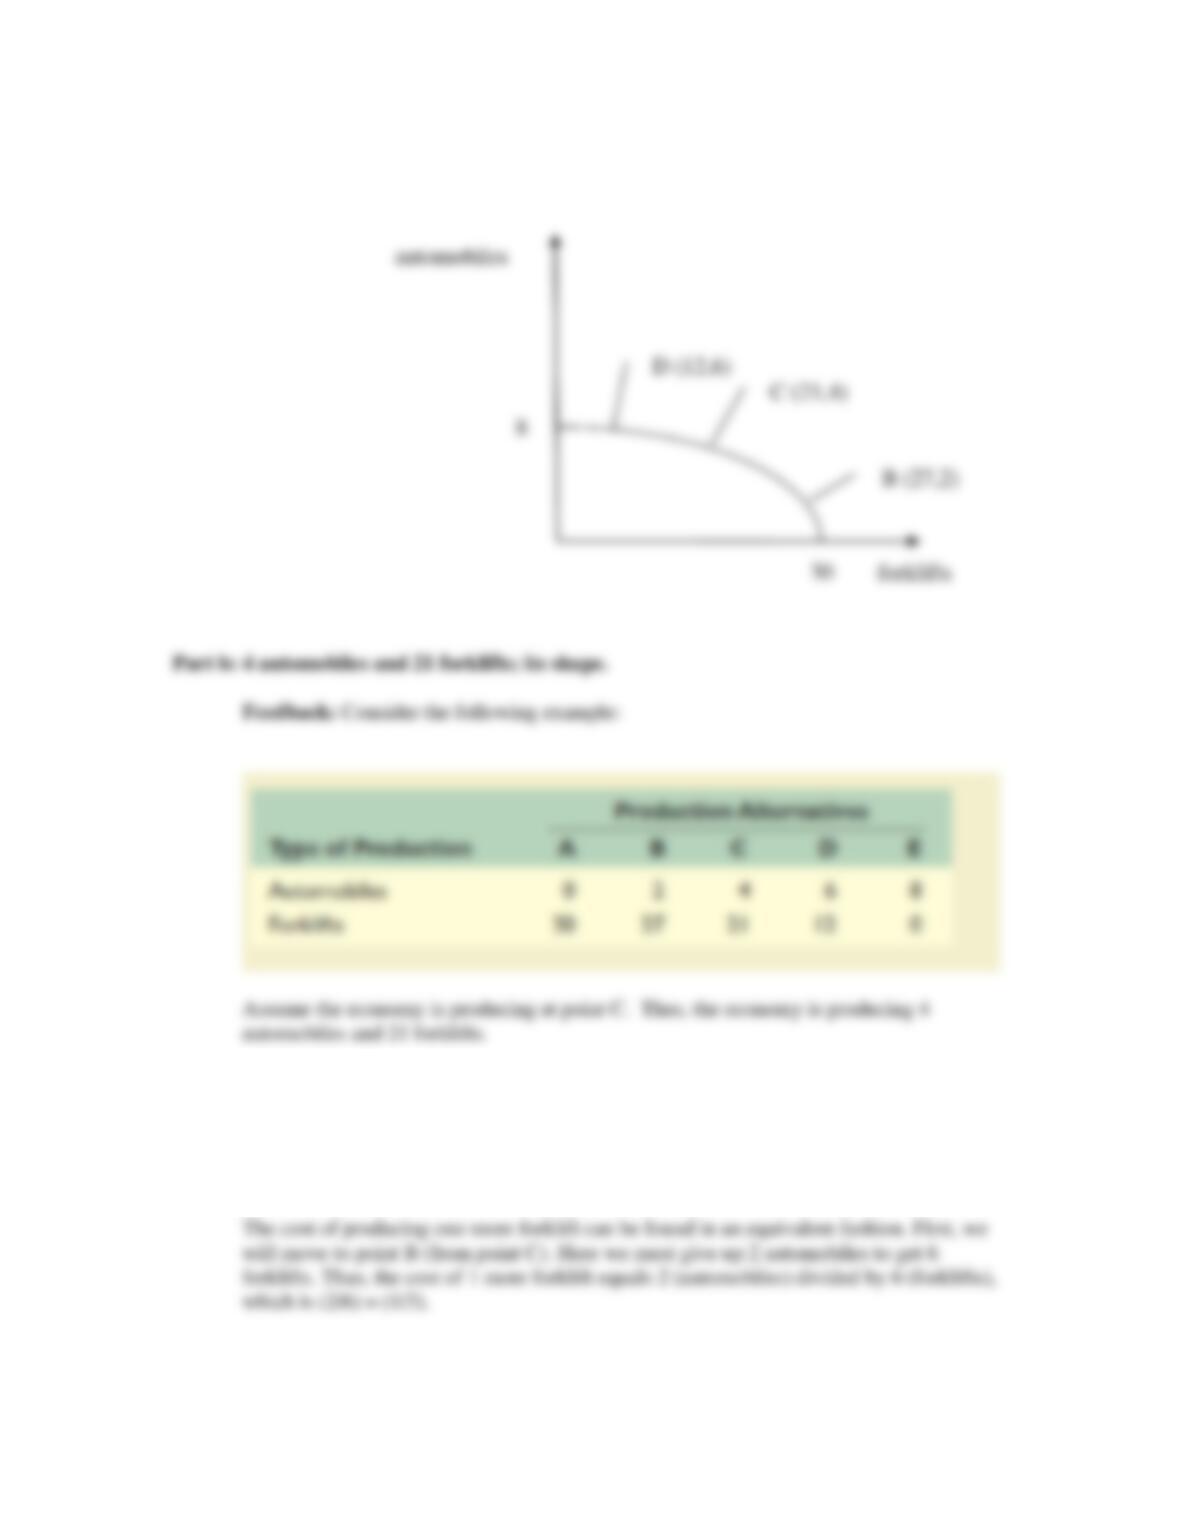
Answers:
Part a: (See figure below.) The assumptions are full employment, fixed supplies of
resources, fixed technology and two goods.
Chapter 01 – Limits, Alternatives, and Choices
1-11
The cost of producing one more automobile can be found by moving to point D and
calculating the number of forklifts given up for the 2 additional automobiles. At point D
the economy is producing 12 forklifts, which is a loss of 9 forklifts (moving from C to D)
for the 2 additional automobiles. Thus the cost of 1 more automobile equals 9 (forklifts)
divided by 2 (automobiles), or (9/2) = 4.5 forklifts.
Chapter 01 – Limits, Alternatives, and Choices
1-12
In review, take the cost (loss) and divide by the gain. If we were at point D, the cost of
one more forklift equals 2 automobiles (loss) divided by 9 forklifts (gain). Thus, the cost
of 1 more forklift at point D is (2/9) automobiles.
6. Look at Figure 1.3. Suppose that the cost of cheese falls, so that the marginal cost of producing
pizza decreases. Will the MC curve shift up or down? Will the optimal amount of pizza increase
or decrease?LO5
Answers: MC will shift down; the optimal amount of pizza will increase.
Feedback: To think about cost schedules we must think about input costs. If the cost of
cheese falls, then the cost of making pizza is cheaper for all pizzas. This implies that the
7. Referring to the table in problem 5, suppose improvement occurs in the technology of
producing forklifts but not in the technology of producing automobiles. Draw the new production
possibilities curve. Now assume that a technological advance occurs in producing automobiles
but not in producing forklifts. Draw the new production possibilities curve. Now draw a
production possibilities curve that reflects technological improvement in the production of both
goods. LO6
Chapter 01 – Limits, Alternatives, and Choices
1-13
Answers: See figures.
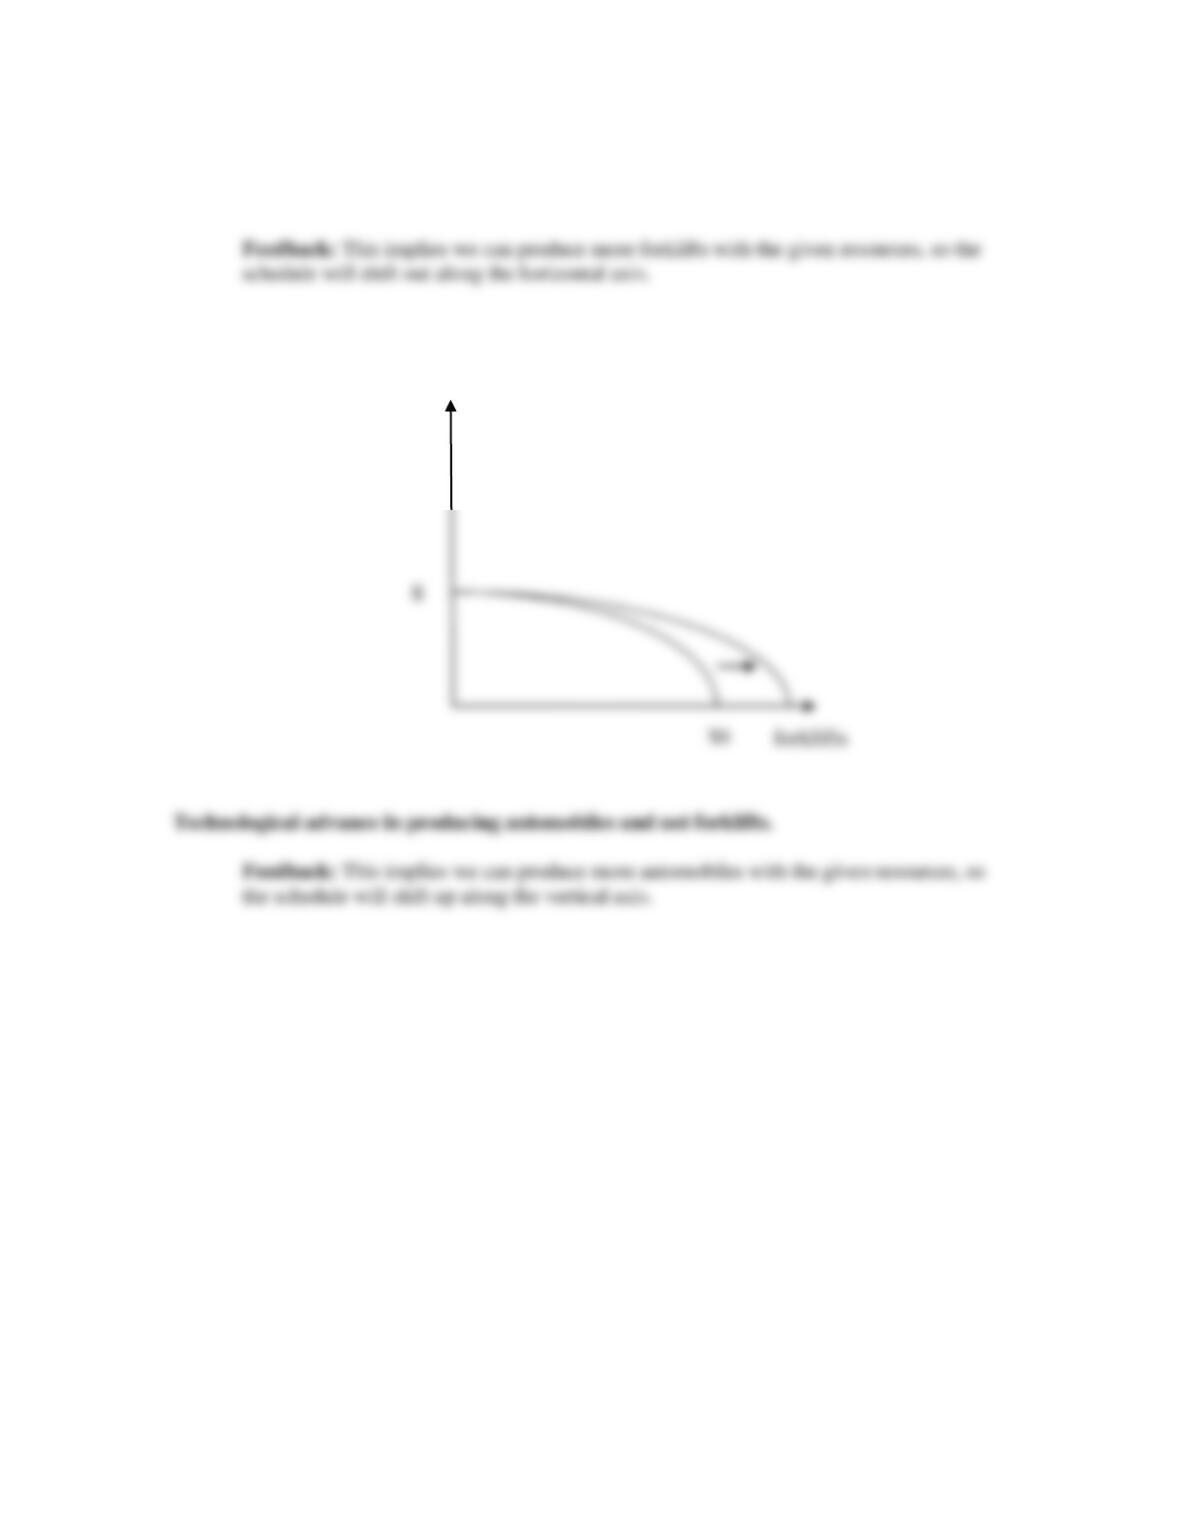
Technological advance in producing forklifts and not automobiles.
automobiles
Chapter 01 – Limits, Alternatives, and Choices
1-14
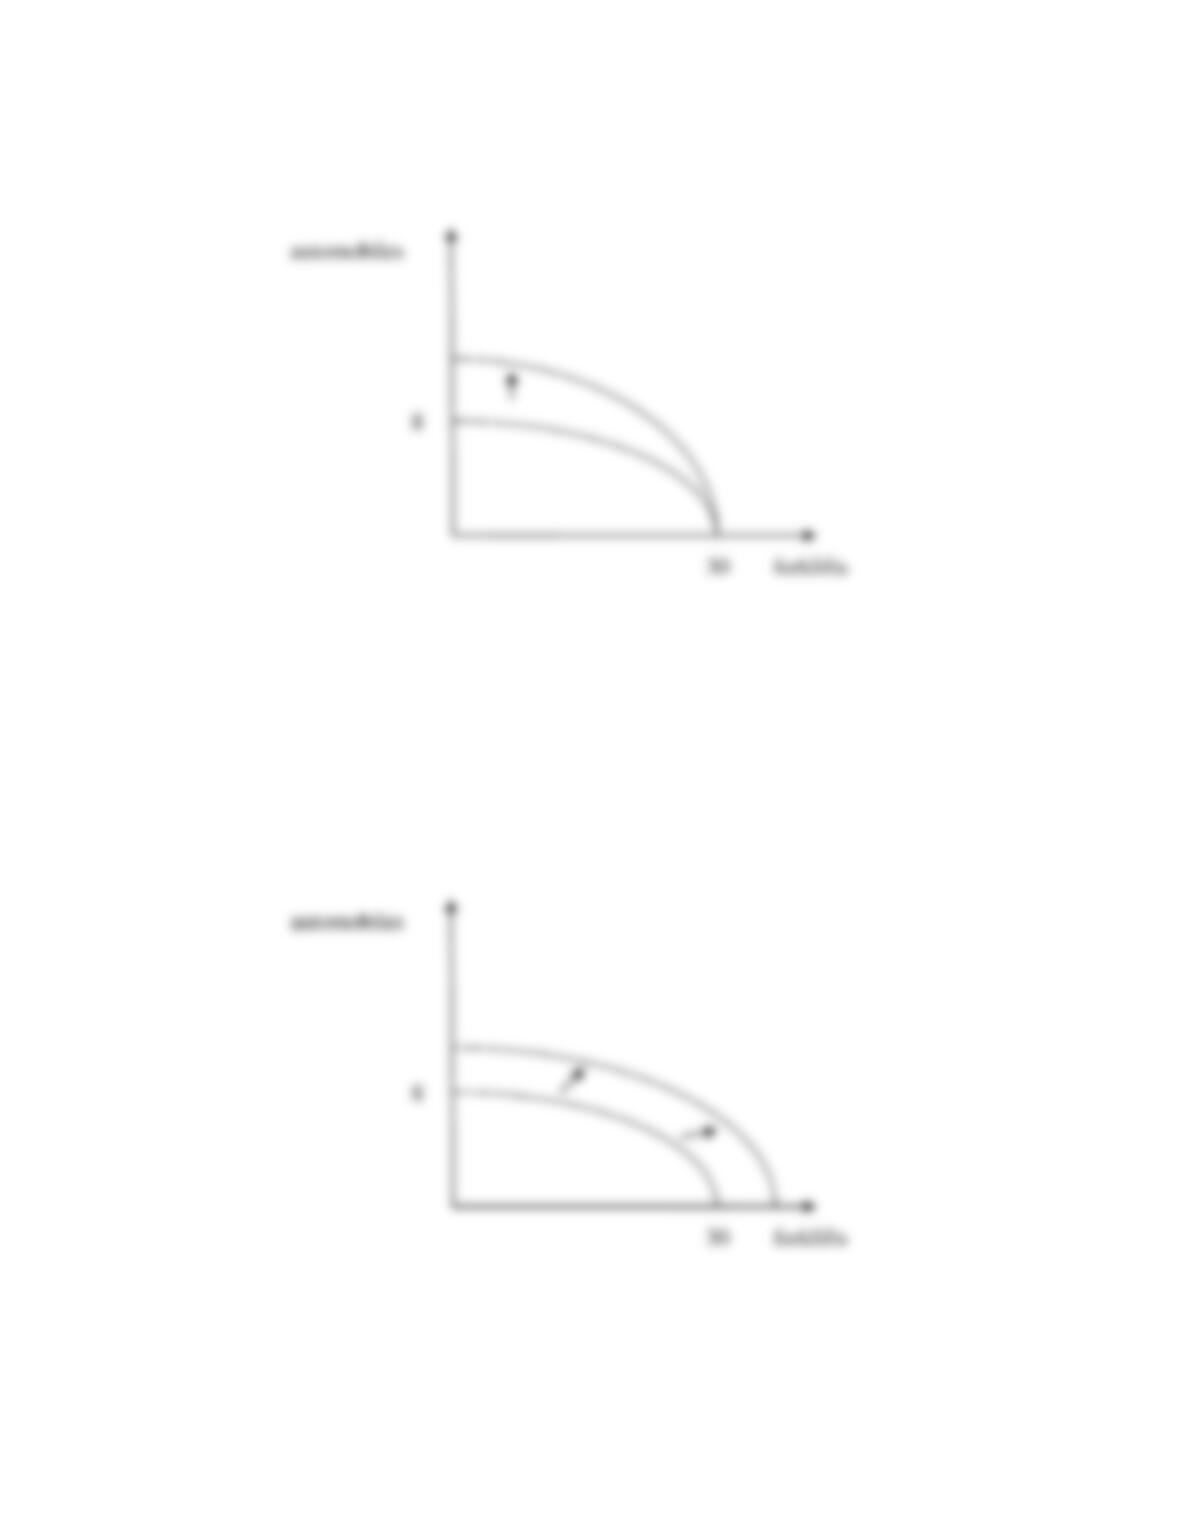
Technological in advance in producing automobiles and forklifts.
Feedback: This implies we can produce more forklifts and automobiles with the given
resources, so the schedule will shift up and out along the vertical and horizontal axes.
Chapter 01 – Limits, Alternatives, and Choices
1-15
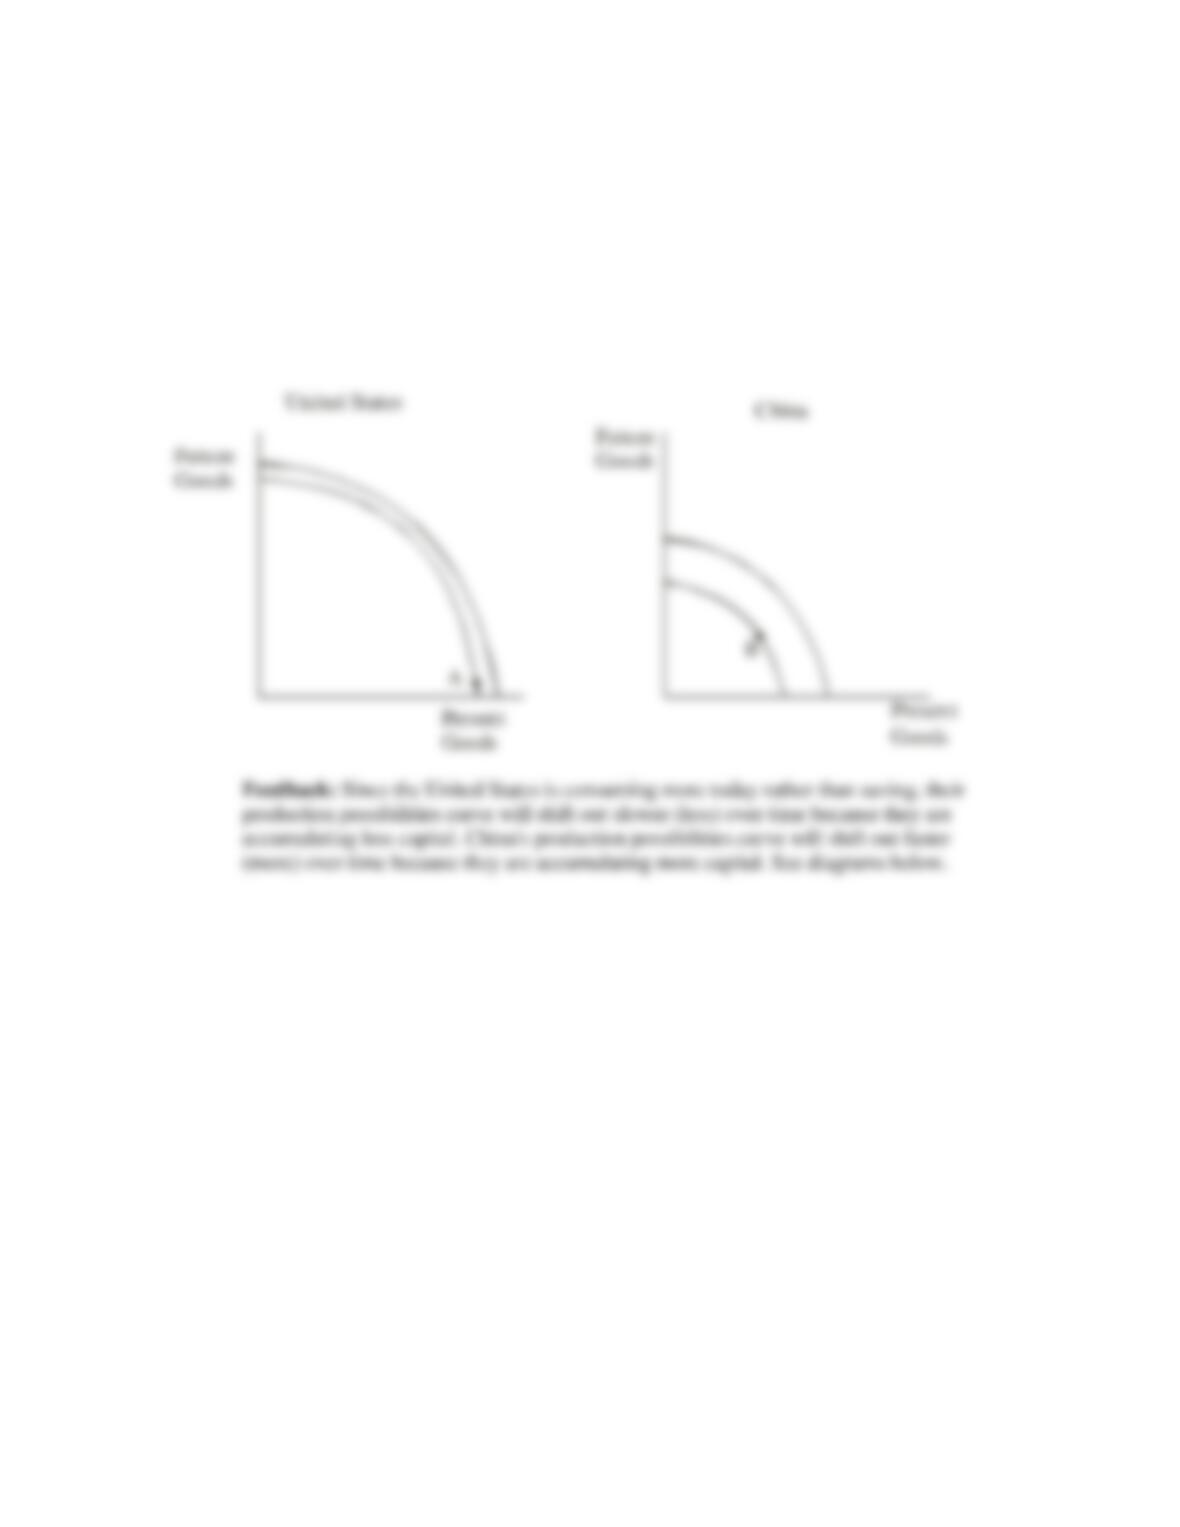
8. On average, households in China save 40 percent of their annual income each year, whereas
households in the United States save less than 5 percent. Production possibilities are growing at
roughly 9 percent annually in China and 3.5 percent in the United States. Use graphical analysis
of “present goods” versus “future goods” to explain the differences in growth rates. LO6
Answers: See figures below