(%)rM
Web Appendix 8A
Calculating Beta Coefficients
Solutions to Problems
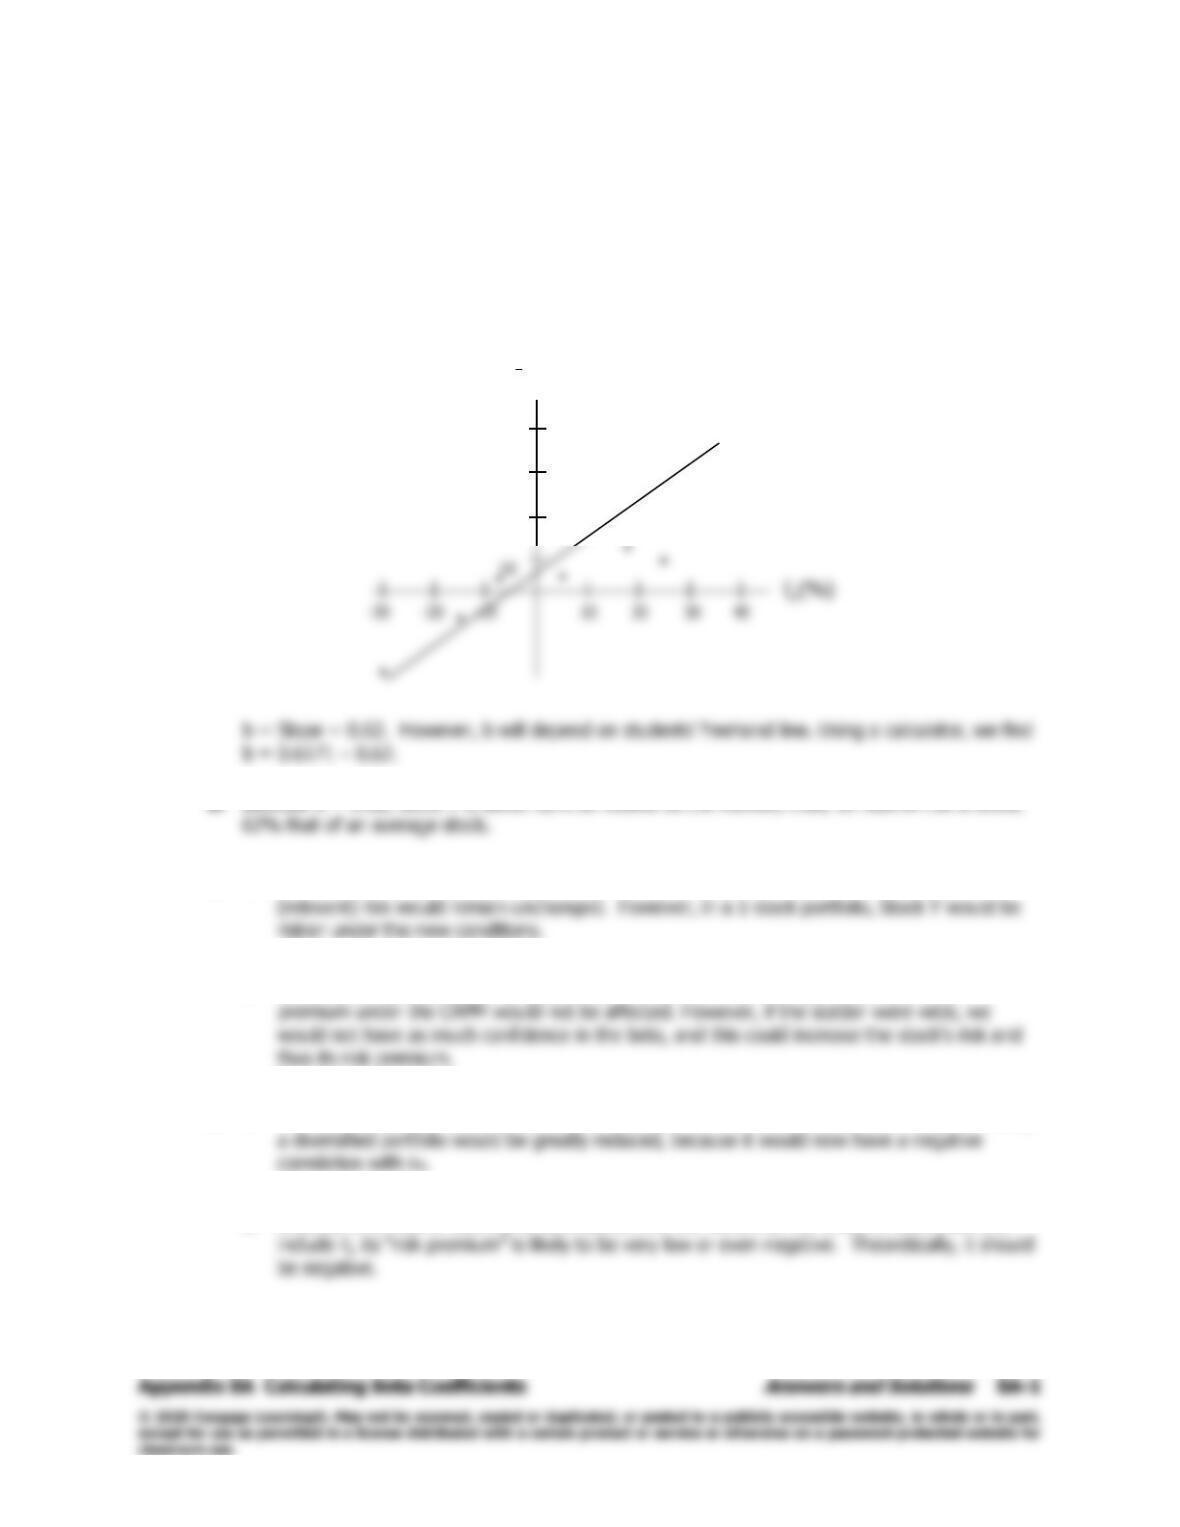
8A-1 a.
b. Because b = 0.62, Stock Y is about 62% as volatile as the market; thus, its relative risk is about
c. 1. Stand-alone risk as measured by would be greater, but beta and hence systematic
2. CAPM assumes that company-specific risk will be eliminated in a portfolio, so the risk
d. 1. The stock‘s variance and would not change, but the risk of the stock to an investor holding
2. Because of a relative scarcity of such stocks and the beneficial net effect on portfolios that
(%)rY
40
30
20
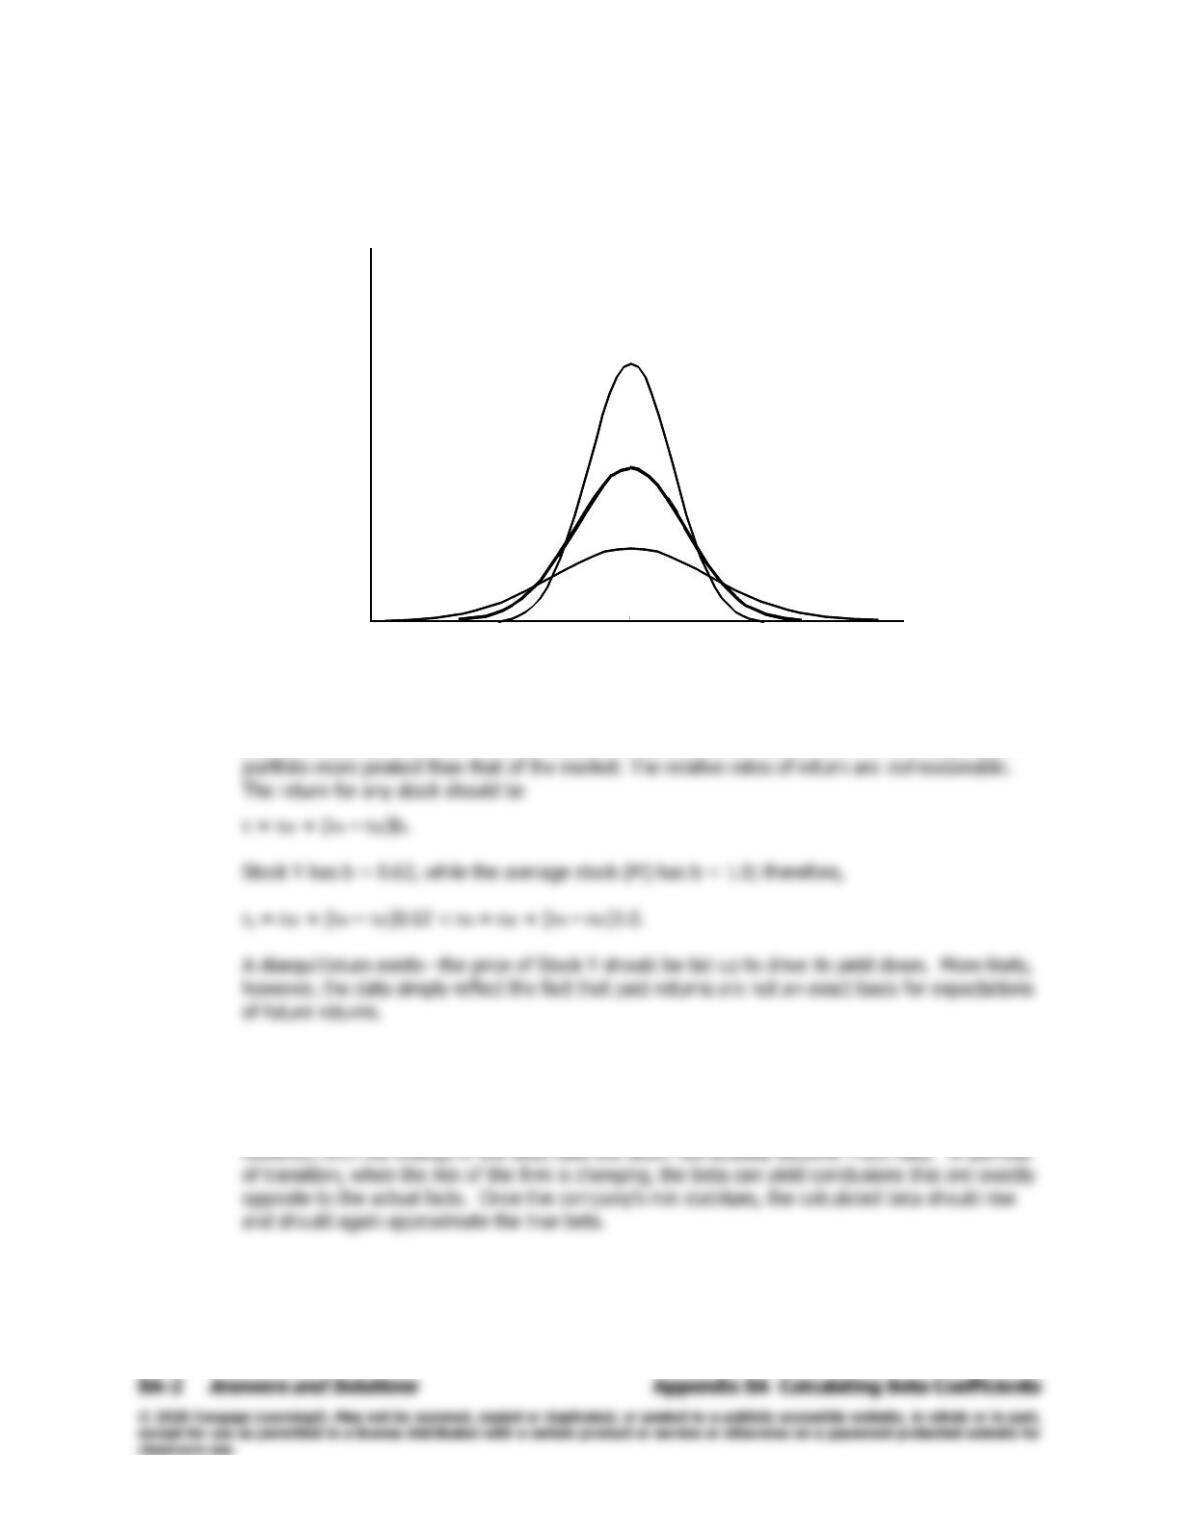
e. The following figure shows a possible set of probability distributions. We can be reasonably sure
that the 100-stock portfolio comprised of b = 0.62 stocks as described in Condition 2 will be less
risky than the “market.” Hence, the distribution for Condition 2 will be more peaked than that of
Condition 3.
We can also say based on the available information that Y is smaller than M; Stock Y’s
market
risk is only 62% of the “market,” but it does have company-specific risk, while the market
portfolio does not, because it has been diversified away. However, we know from the given data
that Y = 13.8%, while M = 19.6%. Thus, we have drawn the distribution for the single stock
f. The expected return could not be predicted with the historical characteristic line because the
increased risk should change the beta used in the characteristic line.
g. The beta would decline to 0.53. A decline indicates that the stock has become less risky;
9.8
Kr100
KrM
KrY
9.8
Kr100
KrM
KrY
Appendix 8A Calculating Beta Coefficients
Answers and Solutions
8A–3
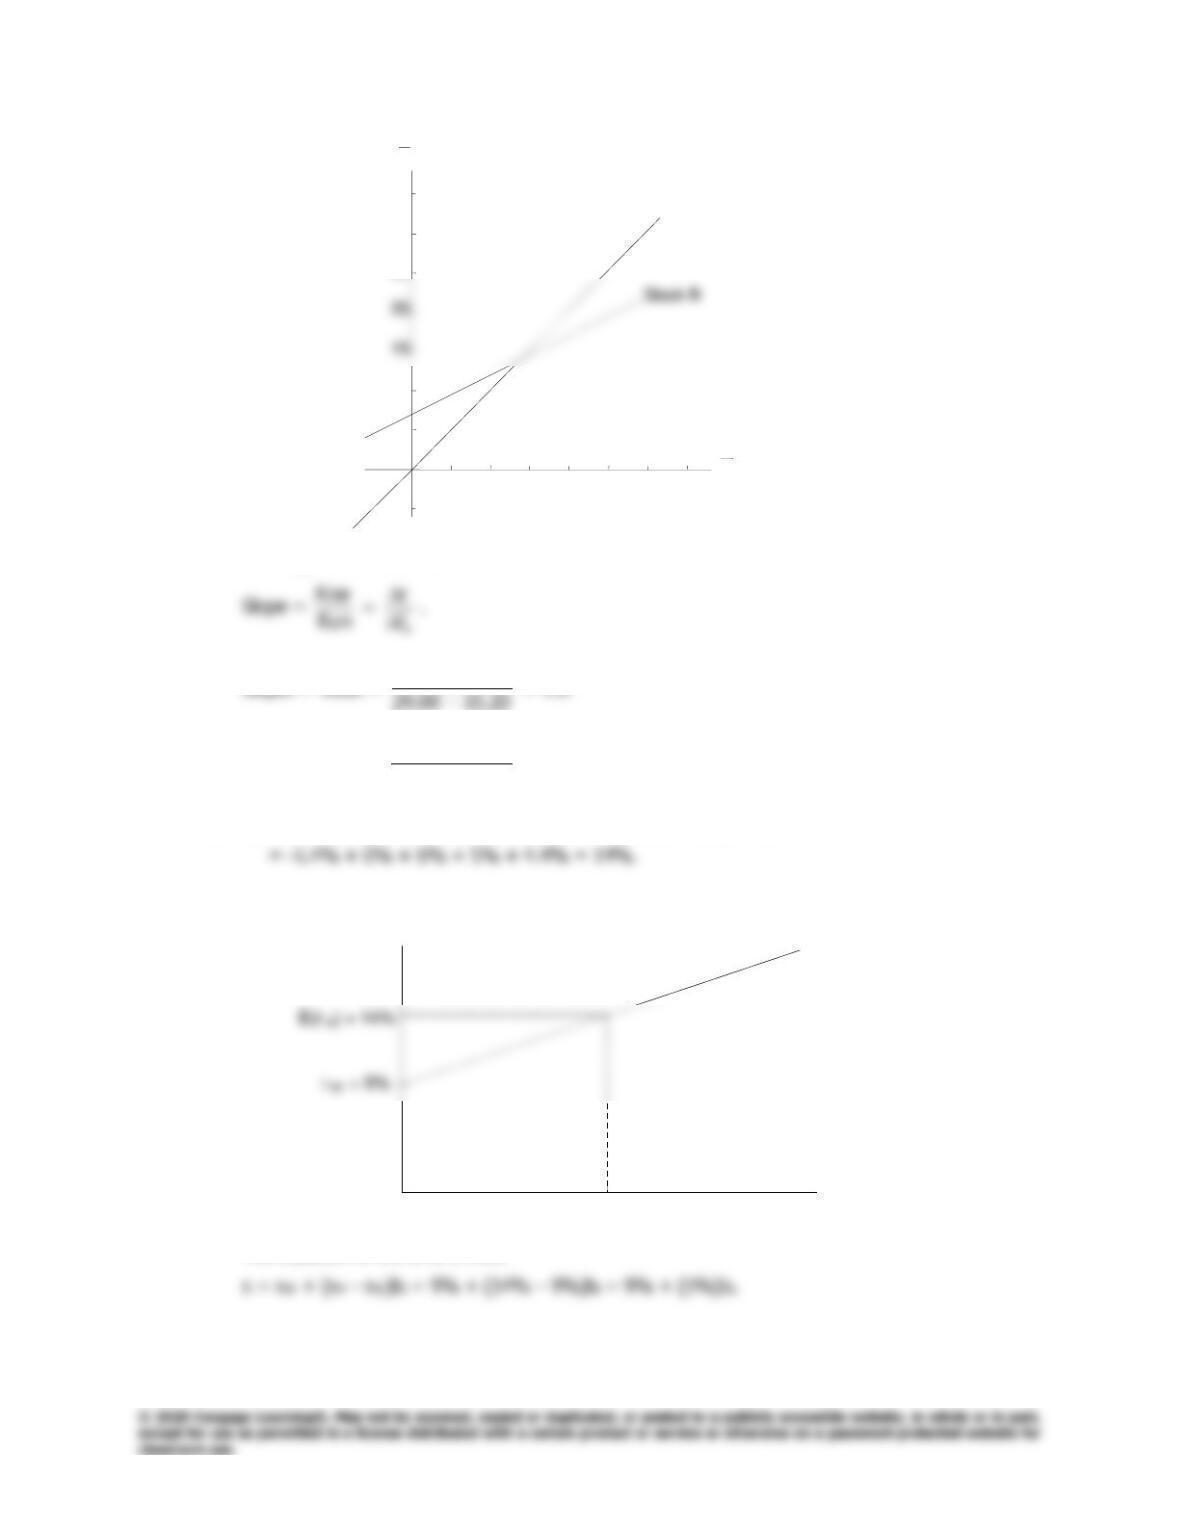
8A-2 a.
The slope of the characteristic line is the stock’s beta coefficient.
20.1500.29
−
SlopeB = BetaB =
20.1500.29
10.1300.20
−
−
= 0.5.
b.
M
r
ˆ
= 0.1(-14%) + 0.2(0%) + 0.4(15%) + 0.2(25%) + 0.1(44%)
The graph of the SML is as follows:
The equation of the SML is thus:
-5
5
10
25
30
35
510 15 20 25 30 35
ri(%)
rM(%)
Stock A
-5
5
10
25
30
35
510 15 20 25 30 35
ri(%)
rM(%)
Stock A
SML
ri
b
1.0
SML
ri
b
1.0
SML
ri
b
1.0
8A–4
Answers and Solutions
Appendix 8A Calculating Beta Coefficients
c. Required rate of return on Stock A:
rA = rRF + (rM – rRF)bA = 9% + (14% – 9%)1.0 = 14%.
d. Expected return on Stock C =
C
r
ˆ
C
r
ˆ
= 18%.
Return on Stock C if it is in equilibrium: