8
Cluster Analysis:
Basic Concepts and
Algorithms
1. Consider a data set consisting of 220 data vectors, where each vector has
32 components and each component is a 4-byte value. Suppose that vec-
tor quantization is used for compression and that 216 prototype vectors are
used. How many bytes of storage does that data set take before and after
compression and what is the compression ratio?
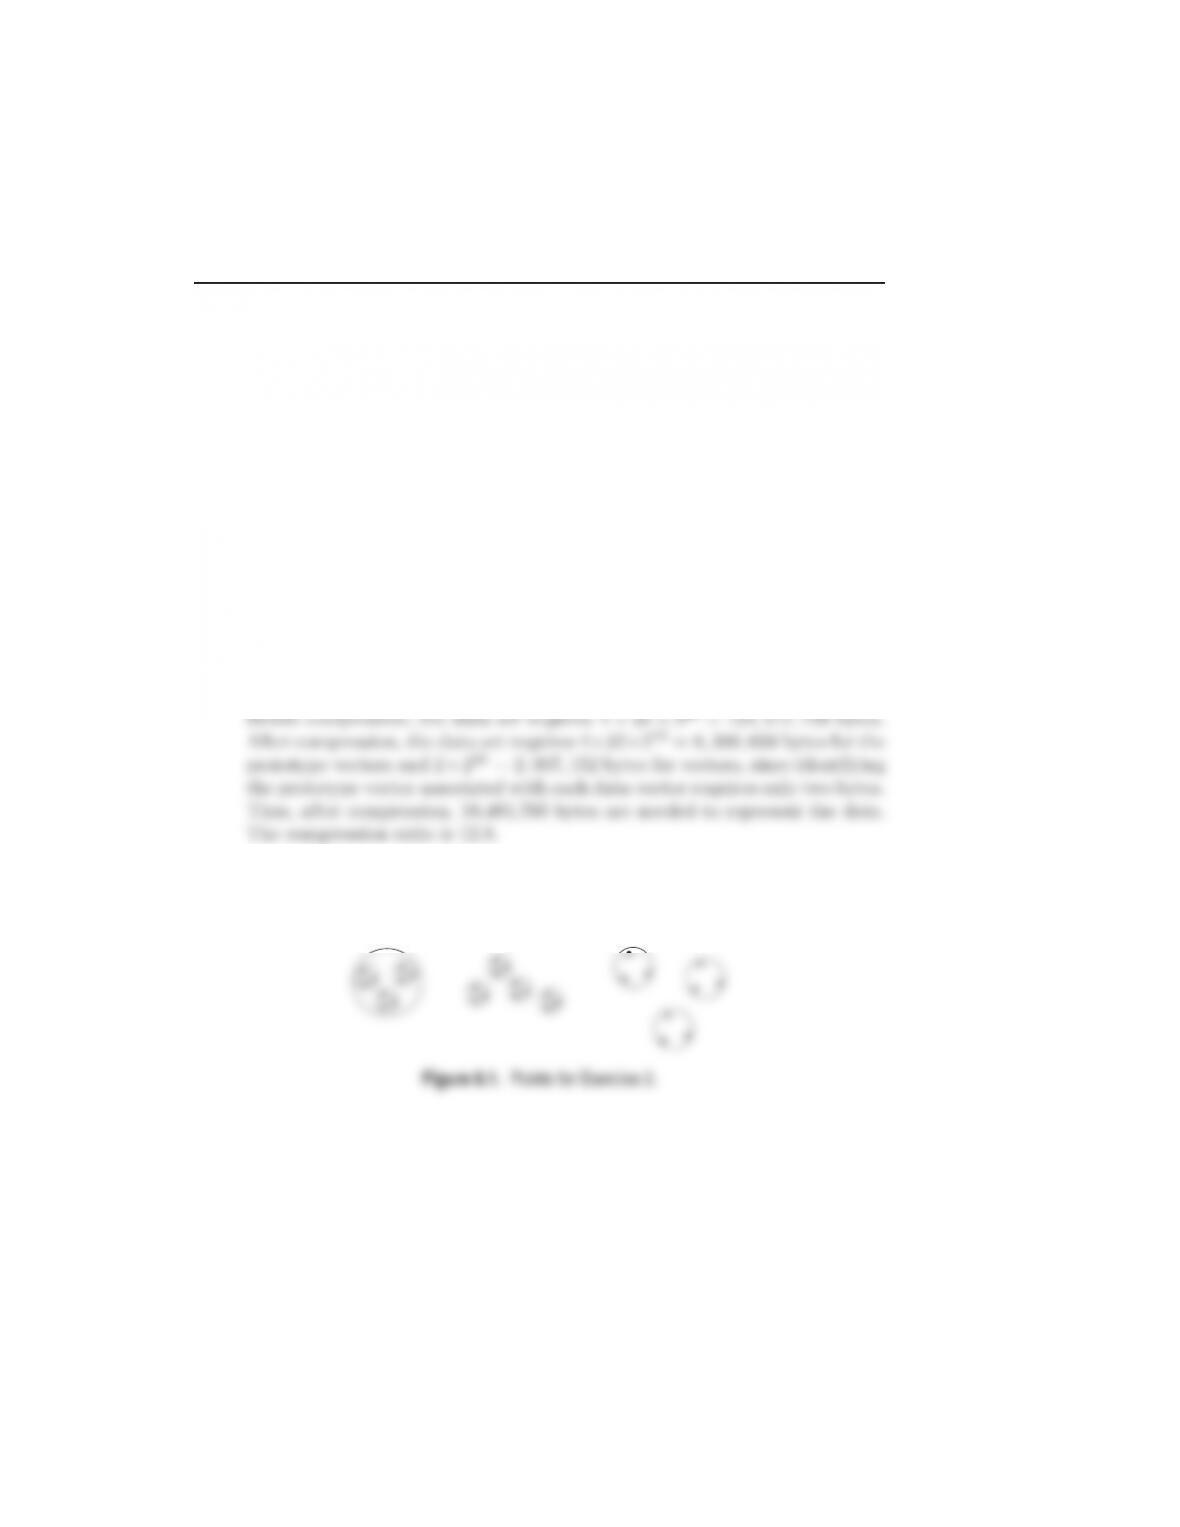
2. Find all well-separated clusters in the set of points shown in Figure 8.1.
The solutions are also indicated in Figure 8.1.
3. Many partitional clustering algorithms that automatically determine the
number of clusters claim that this is an advantage. List two situations in
which this is not the case.
4. Given Kequally sized clusters, the probability that a randomly chosen initial
centroid will come from any given cluster is 1/K, but the probability that
each cluster will have exactly one initial centroid is much lower. (It should
be clear that having one initial centroid in each cluster is a good starting
situation for K-means.) In general, if there are Kclusters and each cluster
has npoints, then the probability, p, of selecting in a sample of size Kone
initial centroid from each cluster is given by Equation 8.1. (This assumes
sampling with replacement.) From this formula we can calculate, for example,
that the chance of having one initial centroid from each of four clusters is
4!/44=0.0938.
p=number of ways to select one centroid from each cluster
number of ways to select Kcentroids =K!nK
(Kn)K=K!
KK(8.1)
(a) Plot the probability of obtaining one point from each cluster in a sample
of size Kfor values of Kbetween 2 and 100.
(b) For Kclusters, K=10,100,and 1000, find the probability that a
sample of size 2Kcontains at least one point from each cluster. You can
use either mathematical methods or statistical simulation to determine
the answer.
We used simulation to compute the answer. Respectively, the proba-
0 10 20 30 40 50 60 70 80 90 100
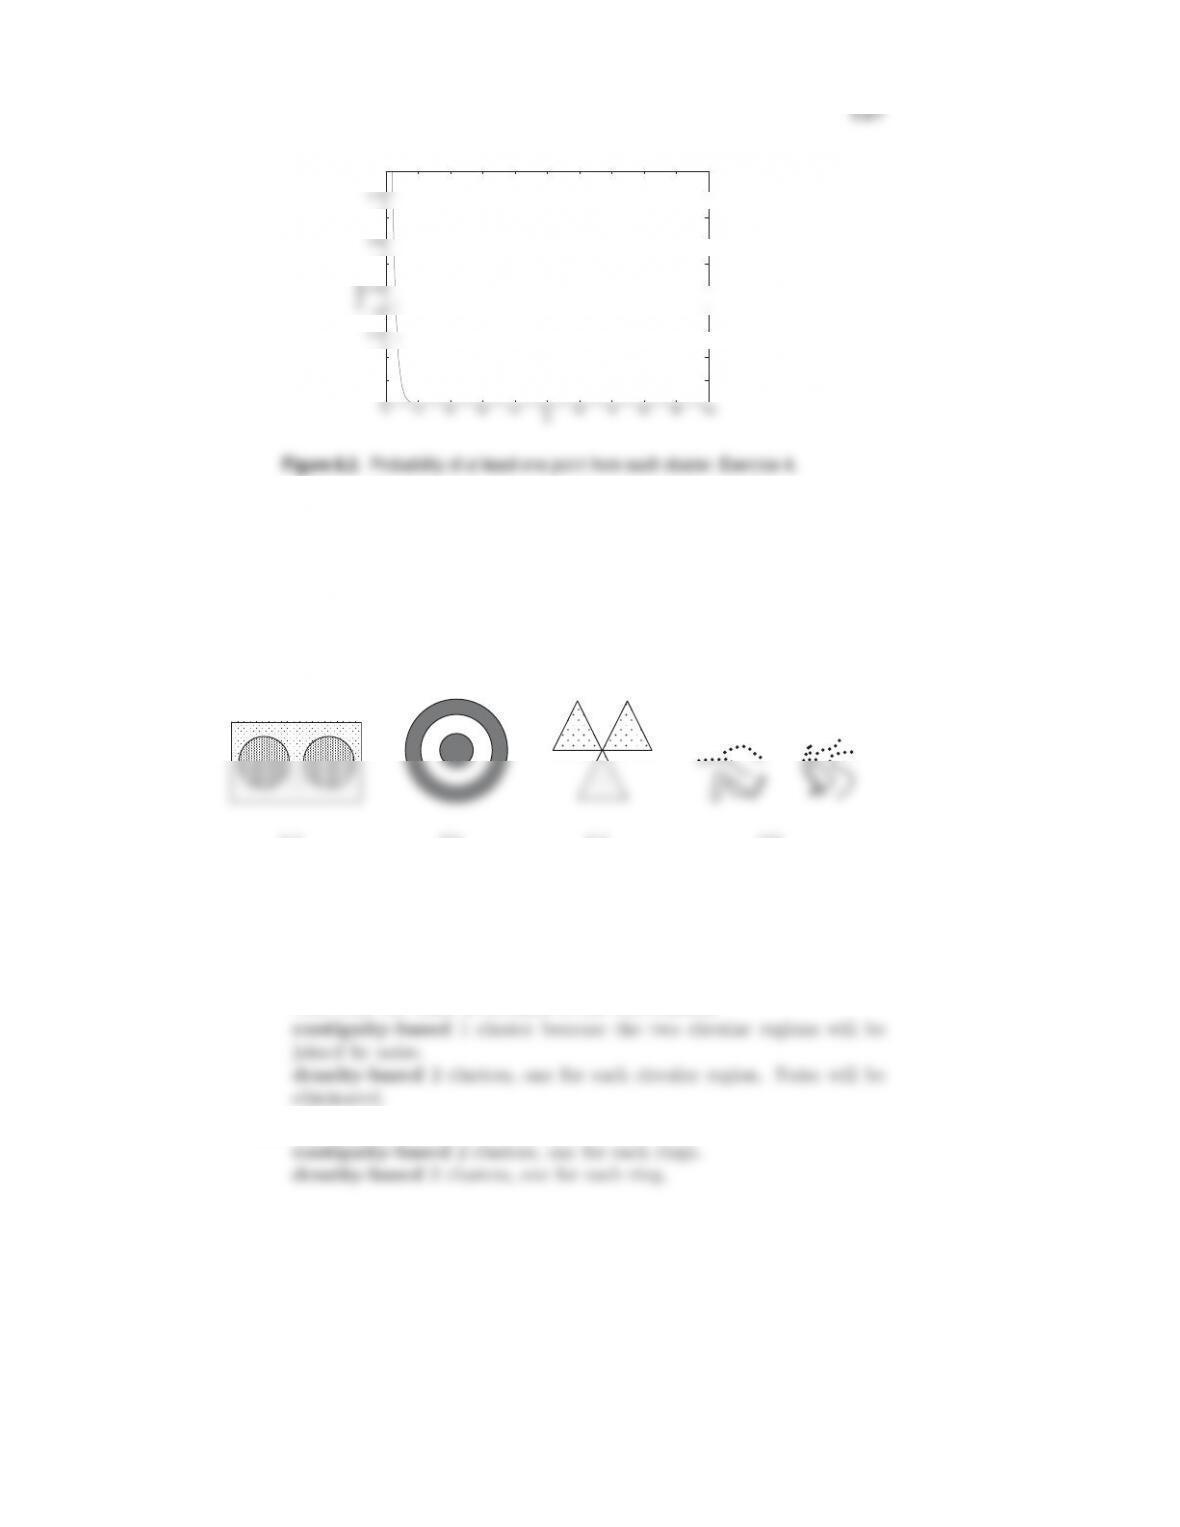
5. Identify the clusters in Figure 8.3 using the center-, contiguity-, and density-
based definitions. Also indicate the number of clusters for each case and
give a brief indication of your reasoning. Note that darkness or the number
of dots indicates density. If it helps, assume center-based means K-means,
contiguity-based means single link, and density-based means DBSCAN.
(a) (b)
(c) (d)
Figure 8.3. Clusters for Exercise 5.
(a) center-based 2 clusters. The rectangular region will be split in half.
Note that the noise is included in the two clusters.
(b) center-based 1 cluster that includes both rings.
128 Chapter 8 Cluster Analysis: Basic Concepts and Algorithms
(c) center-based 3 clusters, one for each triangular region. One cluster is
(d) center-based 2 clusters. The two groups of lines will be split in two.
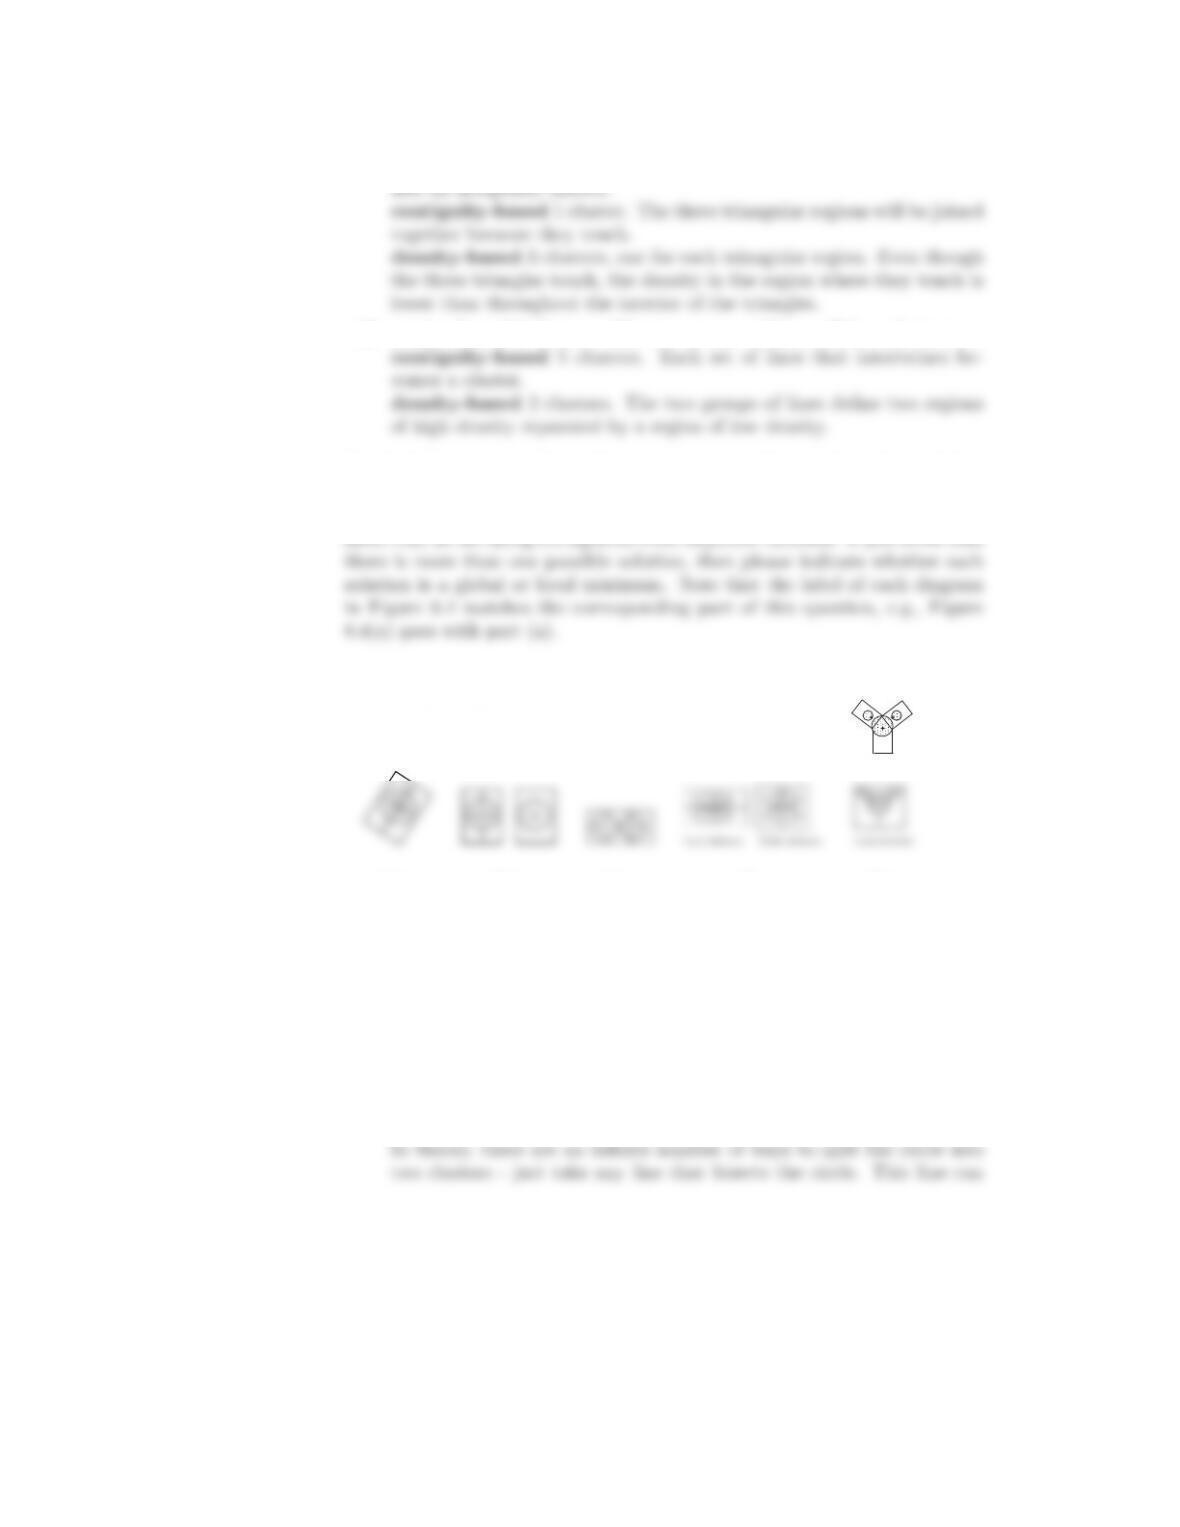
6. For the following sets of two-dimensional points, (1) provide a sketch of how
they would be split into clusters by K-means for the given number of clusters
and (2) indicate approximately where the resulting centroids would be. As-
(a)
(b)
(c)
(d)
Global minimum
(e)
Figure 8.4. Diagrams for Exercise 6.
(a) K= 2. Assuming that the points are uniformly distributed in the circle,
how many possible ways are there (in theory) to partition the points
into two clusters? What can you say about the positions of the two
centroids? (Again, you don’t need to provide exact centroid locations,
just a qualitative description.)
129
(b) K= 3. The distance between the edges of the circles is slightly greater
than the radii of the circles.
(c) K= 3. The distance between the edges of the circles is much less than
the radii of the circles.
(d) K=2.
(e) K= 3. Hint: Use the symmetry of the situation and remember that
we are looking for a rough sketch of what the result would be.
For the solution shown in the top figure, the two top clusters are en-
closed in two boxes, while the third cluster is enclosed by the regions
defined by a triangle and a rectangle. (The two smaller clusters in the
7. Suppose that for a data set
•there are mpoints and Kclusters,
•half the points and clusters are in “more dense” regions,
•half the points and clusters are in “less dense” regions, and
•the two regions are well-separated from each other.
130 Chapter 8 Cluster Analysis: Basic Concepts and Algorithms
For the given data set, which of the following should occur in order to mini-
mize the squared error when finding Kclusters:
8. Consider the mean of a cluster of objects from a binary transaction data
set. What are the minimum and maximum values of the components of the
mean? What is the interpretation of components of the cluster mean? Which
components most accurately characterize the objects in the cluster?
(a) The components of the mean range between 0 and 1.
(b) For any specific component, its value is the fraction of the objects in
the cluster that have a 1 for that component. If we have asymmetric
9. Give an example of a data set consisting of three natural clusters, for which
(almost always) K-means would likely find the correct clusters, but bisecting
K-means would not.
10. Would the cosine measure be the appropriate similarity measure to use with
K-means clustering for time series data? Why or why not? If not, what
similarity measure would be more appropriate?
131
11. Total SSE is the sum of the SSE for each separate attribute. What does it
mean if the SSE for one variable is low for all clusters? Low for just one
cluster? High for all clusters? High for just one cluster? How could you use
the per variable SSE information to improve your clustering?
(a) If the SSE of one attribute is low for all clusters, then the variable is
12. The leader algorithm (Hartigan [4]) represents each cluster using a point,
known as a leader, and assigns each point to the cluster corresponding to
the closest leader, unless this distance is above a user-specified threshold. In
that case, the point becomes the leader of a new cluster.
Note that the algorithm described here is not quite the leader algorithm
described in Hartigan, which assigns a point to the first leader that is within
the threshold distance. The answers apply to the algorithm as stated in the
problem.
(a) What are the advantages and disadvantages of the leader algorithm as
compared to K-means?
132 Chapter 8 Cluster Analysis: Basic Concepts and Algorithms
(b) Suggest ways in which the leader algorithm might be improved.
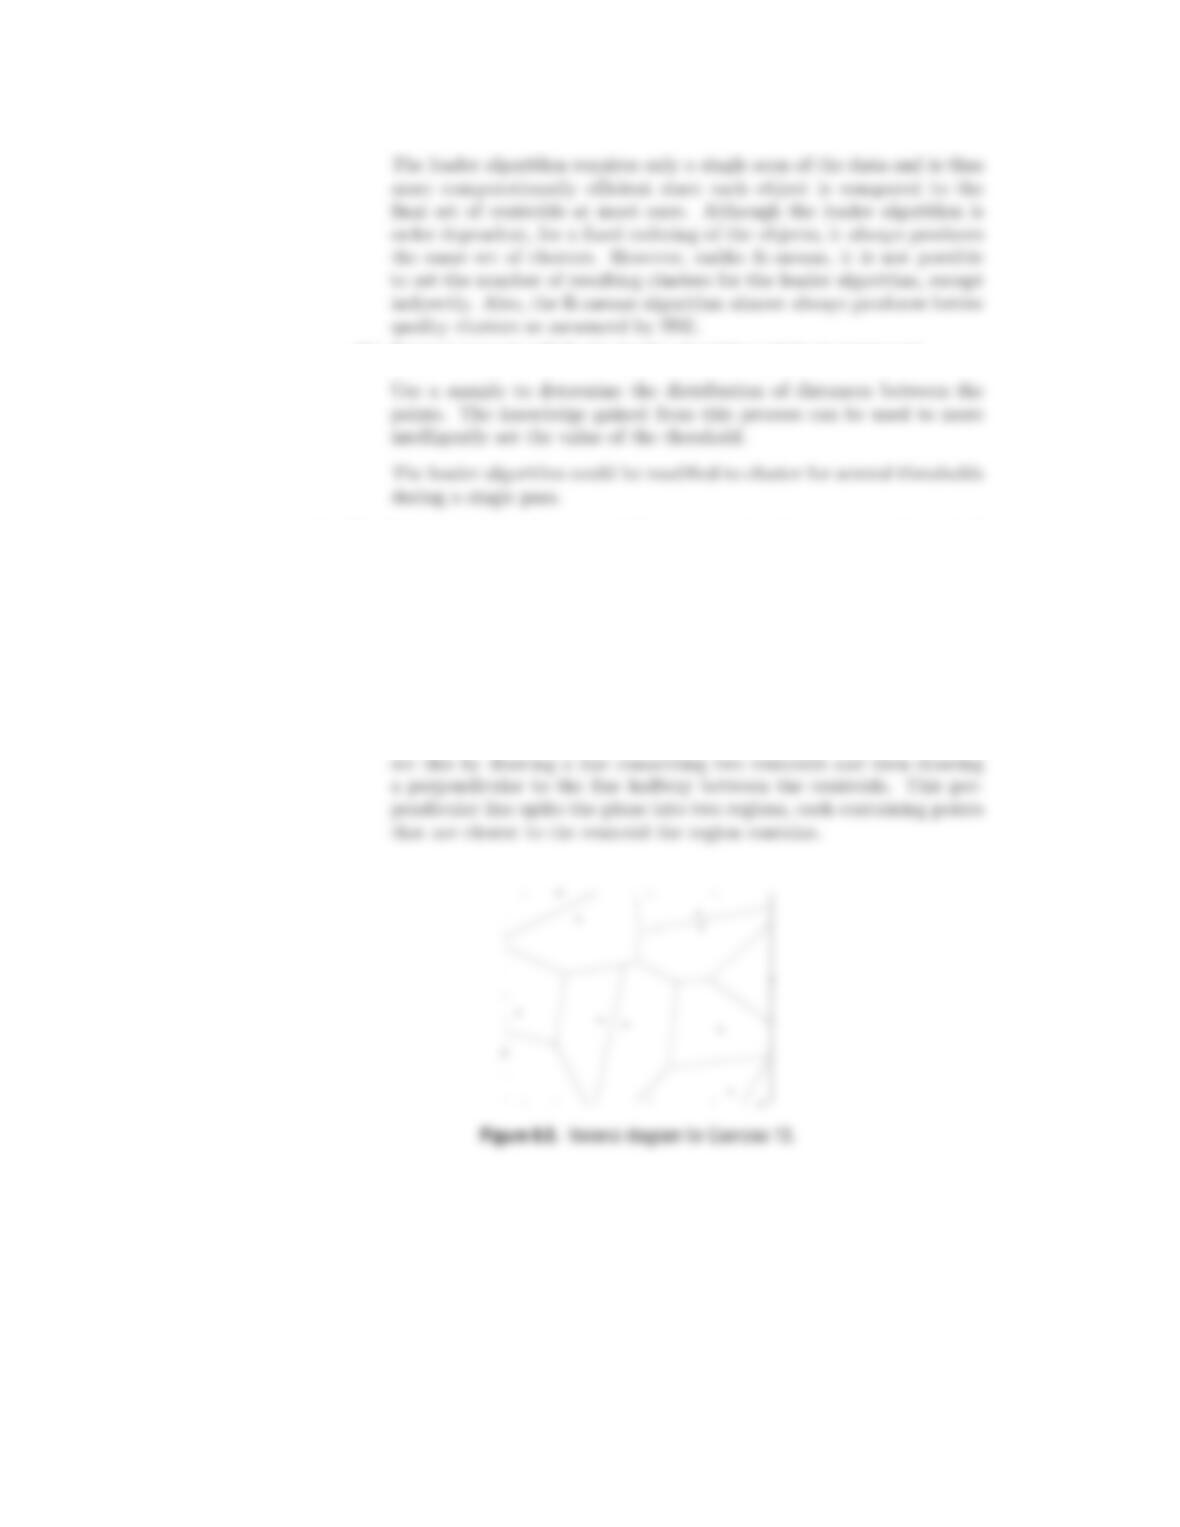
13. The Voronoi diagram for a set of Kpoints in the plane is a partition of all
the points of the plane into Kregions, such that every point (of the plane) is
assigned to the closest point among the Kspecified points. (See Figure 8.5.)
What is the relationship between Voronoi diagrams and K-means clusters?
What do Voronoi diagrams tell us about the possible shapes of K-means
clusters?
(a) If we have KK-means clusters, then the plane is divided into KVoronoi
regions that represent the points closest to each centroid.
(b) The boundaries between clusters are piecewise linear. It is possible to
14. You are given a data set with 100 records and are asked to cluster the data.
You use K-means to cluster the data, but for all values of K,1≤K≤100,
the K-means algorithm returns only one non-empty cluster. You then apply
an incremental version of K-means, but obtain exactly the same result. How
is this possible? How would single link or DBSCAN handle such data?
(a) The data consists completely of duplicates of one object.
(b) Single link (and many of the other agglomerative hierarchical schemes)
15. Traditional agglomerative hierarchical clustering routines merge two clusters
at each step. Does it seem likely that such an approach accurately captures
the (nested) cluster structure of a set of data points? If not, explain how
you might postprocess the data to obtain a more accurate view of the cluster
structure.
(a) Such an approach does not accurately capture the nested cluster struc-
ture of the data. For example, consider a set of three clusters, each of
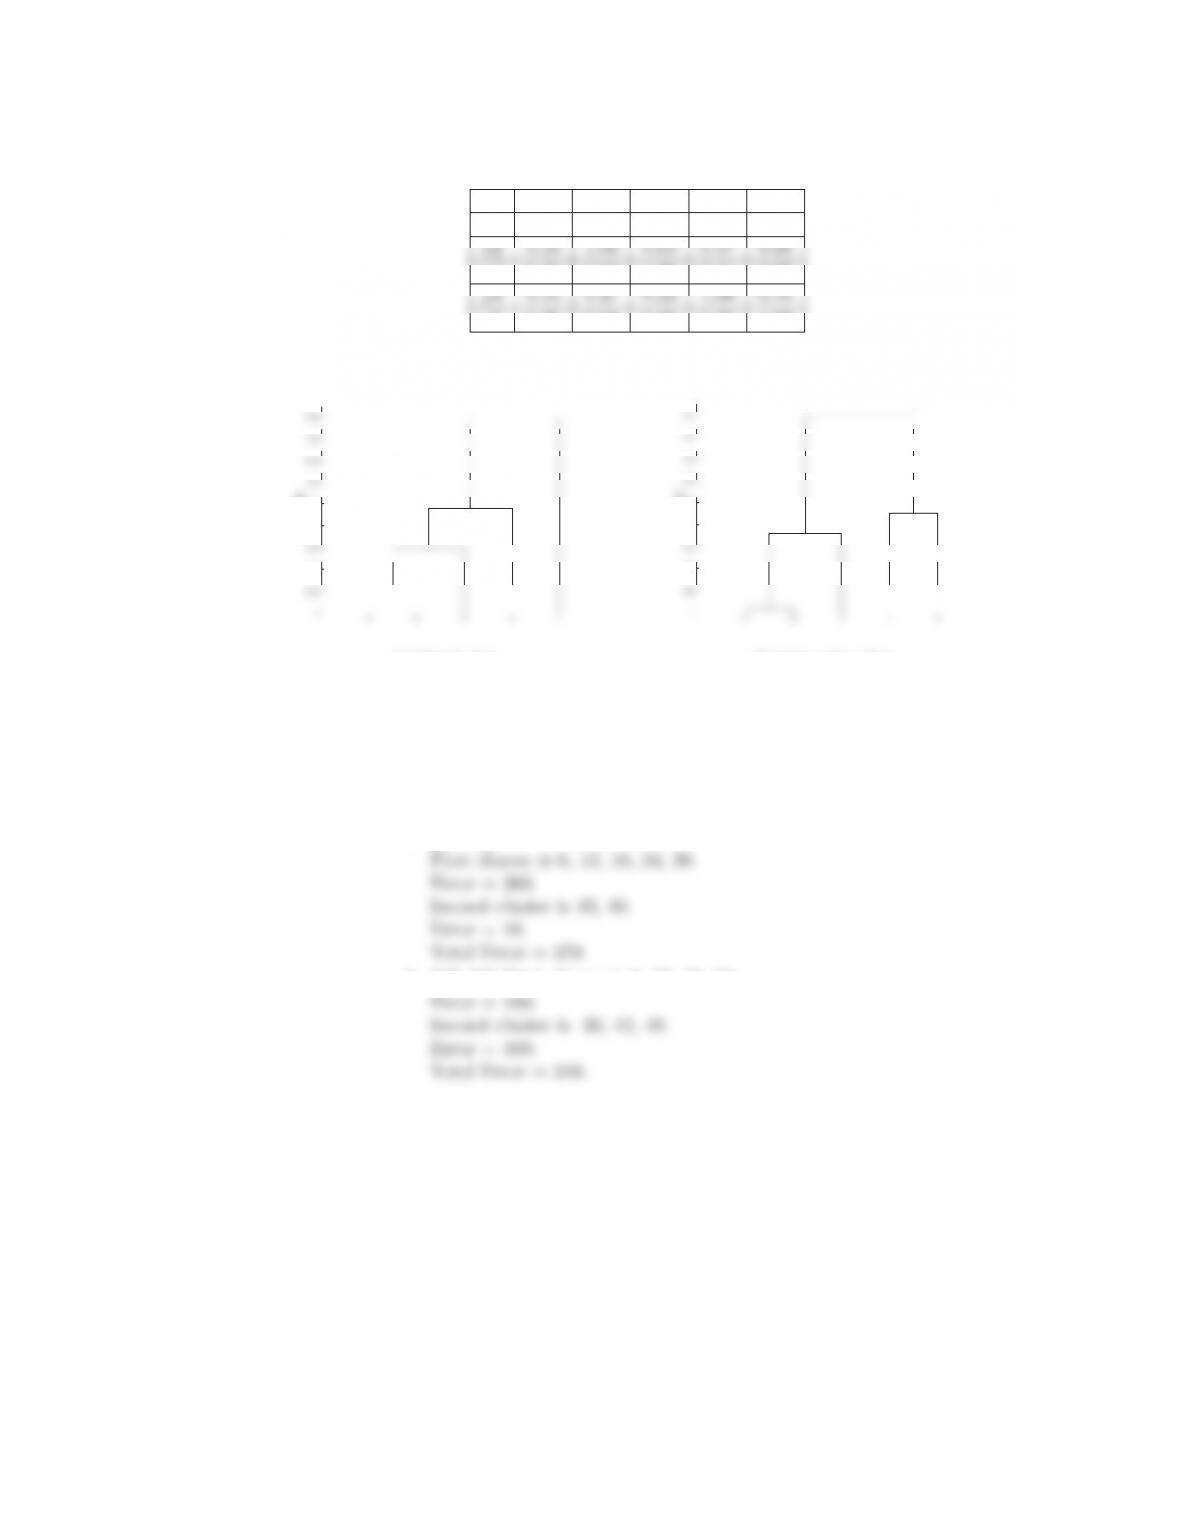
16. Use the similarity matrix in Table 8.1 to perform single and complete link
17. Hierarchical clustering is sometimes used to generate Kclusters, K>1by
taking the clusters at the Kth level of the dendrogram. (Root is at level
1.) By looking at the clusters produced in this way, we can evaluate the
behavior of hierarchical clustering on different types of data and clusters,
and also compare hierarchical approaches to K-means.
The following is a set of one-dimensional points: {6,12,18,24,30,42,48}.
(a) For each of the following sets of initial centroids, create two clusters
by assigning each point to the nearest centroid, and then calculate the
134 Chapter 8 Cluster Analysis: Basic Concepts and Algorithms
Table 8.1. Similarity matrix for Exercise 16.
p1 p2 p3 p4 p5
p1 1.00 0.10 0.41 0.55 0.35
p3 0.41 0.64 1.00 0.44 0.85
p5 0.35 0.98 0.85 0.76 1.00
2 5 3 4 1
1
0.95
0.9
0.8
0.75
0.7
0.65
0.6
0.55
Similarity
(a) Single link.
25314
1
0.9
0.8
0.6
0.5
0.4
0.3
0.2
0.1
Similarity
(b) Complete link.
Figure 8.6. Dendrograms for Exercise 16.
total squared error for each set of two clusters. Show both the clusters
and the total squared error for each set of centroids.
i. {18,45}
ii. {15,40}First cluster is 6, 12, 18, 24 .
(b) Do both sets of centroids represent stable solutions; i.e., if the K-means
algorithm was run on this set of points using the given centroids as the
starting centroids, would there be any change in the clusters generated?
135
(c) What are the two clusters produced by single link?
(d) Which technique, K-means or single link, seems to produce the “most
natural” clustering in this situation? (For K-means, take the clustering
with the lowest squared error.)
(e) What definition(s) of clustering does this natural clustering correspond
to? (Well-separated, center-based, contiguous, or density.)
(f) What well-known characteristic of the K-means algorithm explains the
previous behavior?
18. Suppose we find Kclusters using Ward’s method, bisecting K-means, and
ordinary K-means. Which of these solutions represents a local or global
minimum? Explain.
19. Hierarchical clustering algorithms require O(m2log(m)) time, and conse-
quently, are impractical to use directly on larger data sets. One possible
technique for reducing the time required is to sample the data set. For ex-