136 Chapter 8 Cluster Analysis: Basic Concepts and Algorithms
For each of the following types of data or clusters, discuss briefly if (1) sam-
pling will cause problems for this approach and (2) what those problems are.
Assume that the sampling technique randomly chooses points from the to-
tal set of mpoints and that any unmentioned characteristics of the data or
clusters are as optimal as possible. In other words, focus only on problems
caused by the particular characteristic mentioned. Finally, assume that Kis
very much less than m.
(a) Data with very different sized clusters.
(b) High-dimensional data.
(c) Data with outliers, i.e., atypical points.
(d) Data with highly irregular regions.
(e) Data with globular clusters.
(f) Data with widely different densities.
137
(g) Data with a small percentage of noise points.
(h) Non-Euclidean data.
(i) Euclidean data.
(j) Data with many and mixed attribute types.
20. Consider the following four faces shown in Figure 8.7. Again, darkness or
number of dots represents density. Lines are used only to distinguish regions
and do not represent points.
(a) (b)
(c) (d)
Figure 8.7. Figure for Exercise 20.
(a) For each figure, could you use single link to find the patterns represented
by the nose, eyes, and mouth? Explain.
(b) For each figure, could you use K-means to find the patterns represented
by the nose, eyes, and mouth? Explain.
138 Chapter 8 Cluster Analysis: Basic Concepts and Algorithms
(c) What limitation does clustering have in detecting all the patterns formed
by the points in Figure 8.7(c)?
21. Compute the entropy and purity for the confusion matrix in Table 8.2.
Table 8.2. Confusion matrix for Exercise 21.
Cluster Entertainment Financial Foreign Metro National Sports Total Entropy Purity
22. You are given two sets of 100 points that fall within the unit square. One set
of points is arranged so that the points are uniformly spaced. The other set
of points is generated from a uniform distribution over the unit square.
(a) Is there a difference between the two sets of points?
(b) If so, which set of points will typically have a smaller SSE for K=10
clusters?
(c) What will be the behavior of DBSCAN on the uniform data set? The
random data set?
23. Using the data in Exercise 24, compute the silhouette coefficient for each
point, each of the two clusters, and the overall clustering.
Table 8.3. Table of distances for Exercise 23
.
P1 P2 P3 P4
P2 0.10 00.70 0.60
P4 0.55 0.60 0.30 0
Let aindicate the average distance of a point to other points in its cluster.
Let bindicate the minimum of the average distance of a point to points in
another cluster.
24. Given the set of cluster labels and similarity matrix shown in Tables 8.4 and
8.5, respectively, compute the correlation between the similarity matrix and
the ideal similarity matrix, i.e., the matrix whose ijth entry is 1 if two objects
belong to the same cluster, and 0 otherwise.
Table 8.4. Table of cluster labels for Exercise 24.
Point Cluster Label
P1 1
Table 8.5. Similarity matrix for Exercise 24.
Point P1 P2 P3 P4
P1 1 0.8 0.65 0.55
We need to compute the correlation between the vector x=<1,0,0,0,0,1>
and the vector y=<0.8,0.65,0.55,0.7,0.6,0.3>, which is the correlation
between the off-diagonal elements of the distance matrix and the ideal simi-
larity matrix.
We get:
140 Chapter 8 Cluster Analysis: Basic Concepts and Algorithms
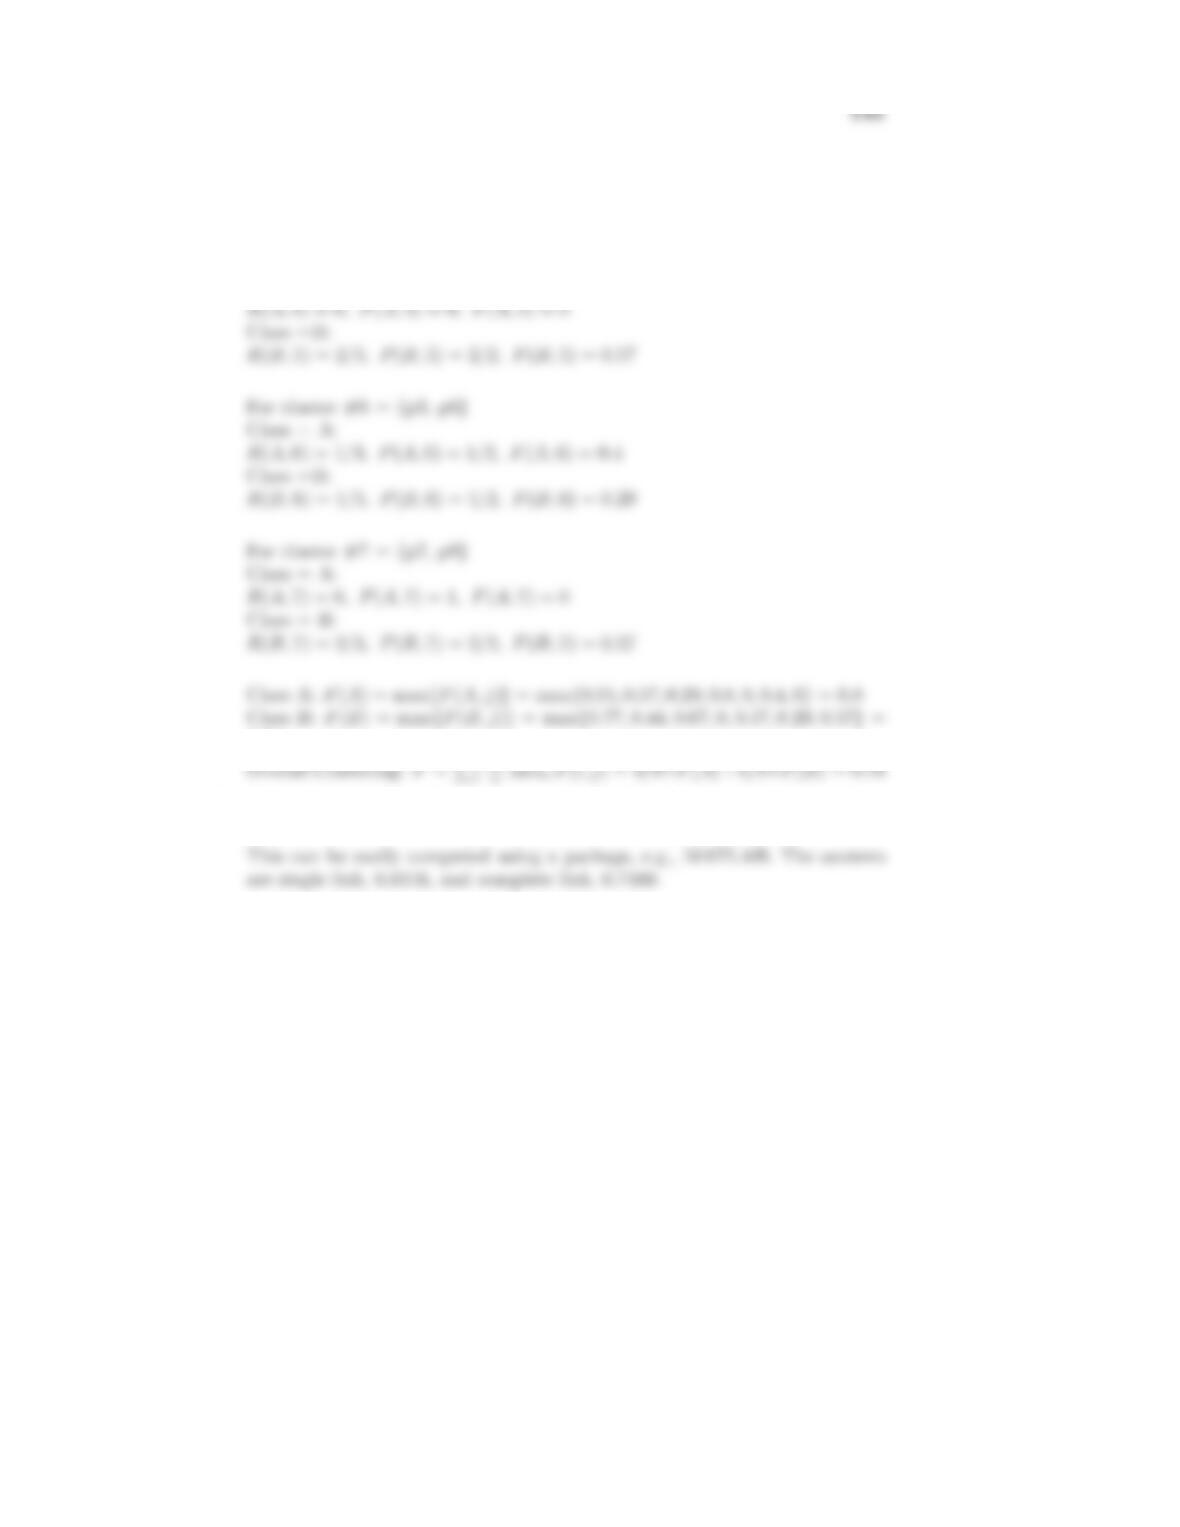
25. Compute the hierarchical F-measure for the eight objects {p1, p2, p3, p4, p5,
p6, p7, p8}and hierarchical clustering shown in Figure 8.8. Class A contains
points p1, p2, and p3, while p4, p5, p6, p7, and p8 belong to class B.
{p1, p2, p3, p4, p5, p6, p7, p8}
{p3, p6, p7, p8}
{p1, p2} {p4, p5} {p3, p6} {p7, p8}
{p1, p2, p4, p5,}
Figure 8.8. Hierarchical clustering for Exercise 25.
Let R(i, j)=nij /niindicate the recall of class iwith respect to cluster j.
R(B,1) = 5/5=1,P(A, 1) = 5/8=0.625,F(A, 1) = 0.77
For cluster #2= {p1,p2,p4,p5}
Class = A:
R(A, 2) = 2/3,P(A, 2) = 2/4,F(A, 2) = 0.57
R(A, 4) = 2/3,P(A, 4) = 2/2,F(A, 4) = 0.8
Class =B:
R(B,4) = 0/5,P(B, 4) = 0/2,F(B,4) = 0
For cluster #5 = {p4, p5}
Class = A:
0.77
ni
26. Compute the cophenetic correlation coefficient for the hierarchical clusterings
in Exercise 16. (You will need to convert the similarities into dissimilarities.)
27. Prove Equation 8.14.
142 Chapter 8 Cluster Analysis: Basic Concepts and Algorithms
1
2|Ci|
(x−y)2=1
2|Ci|
((x−ci)−(y−ci))2
28. Prove Equation 8.15.
1
K
K
K
|Ci|(cj−ci)2=1
2K
K
K
|Ci|((m−ci)−(m−cj))2
K
K
K
29. Prove that K
i=1 x∈Ci(x−mi)(m−mi) = 0. This fact was used in the
proof that TSS = SSE + SSB on page 557.
30. Clusters of documents can be summarized by finding the top terms (words)
for the documents in the cluster, e.g., by taking the most frequent kterms,
where kis a constant, say 10, or by taking all terms that occur more fre-
quently than a specified threshold. Suppose that K-means is used to find
clusters of both documents and words for a document data set.
(a) How might a set of term clusters defined by the top terms in a document
cluster differ from the word clusters found by clustering the terms with
K-means?
(b) How could term clustering be used to define clusters of documents?
31. We can represent a data set as a collection of object nodes and a collection
of attribute nodes, where there is a link between each object and each at-
tribute, and where the weight of that link is the value of the object for that
attribute. For sparse data, if the value is 0, the link is omitted. Bipartite
clustering attempts to partition this graph into disjoint clusters, where each
cluster consists of a set of object nodes and a set of attribute nodes. The
objective is to maximize the weight of links between the object and attribute
nodes of a cluster, while minimizing the weight of links between object and
attribute links in different clusters. This type of clustering is also known
as co-clustering since the objects and attributes are clustered at the same
time.
(a) How is bipartite clustering (co-clustering) different from clustering the
sets of objects and attributes separately?
144 Chapter 8 Cluster Analysis: Basic Concepts and Algorithms
(b) Are there any cases in which these approaches yield the same clusters?
Yes. For example, if a set of attributes is associated only with the
objects in one particular cluster, i.e., has 0 weight for objects in all other
(c) What are the strengths and weaknesses of co-clustering as compared to
ordinary clustering?
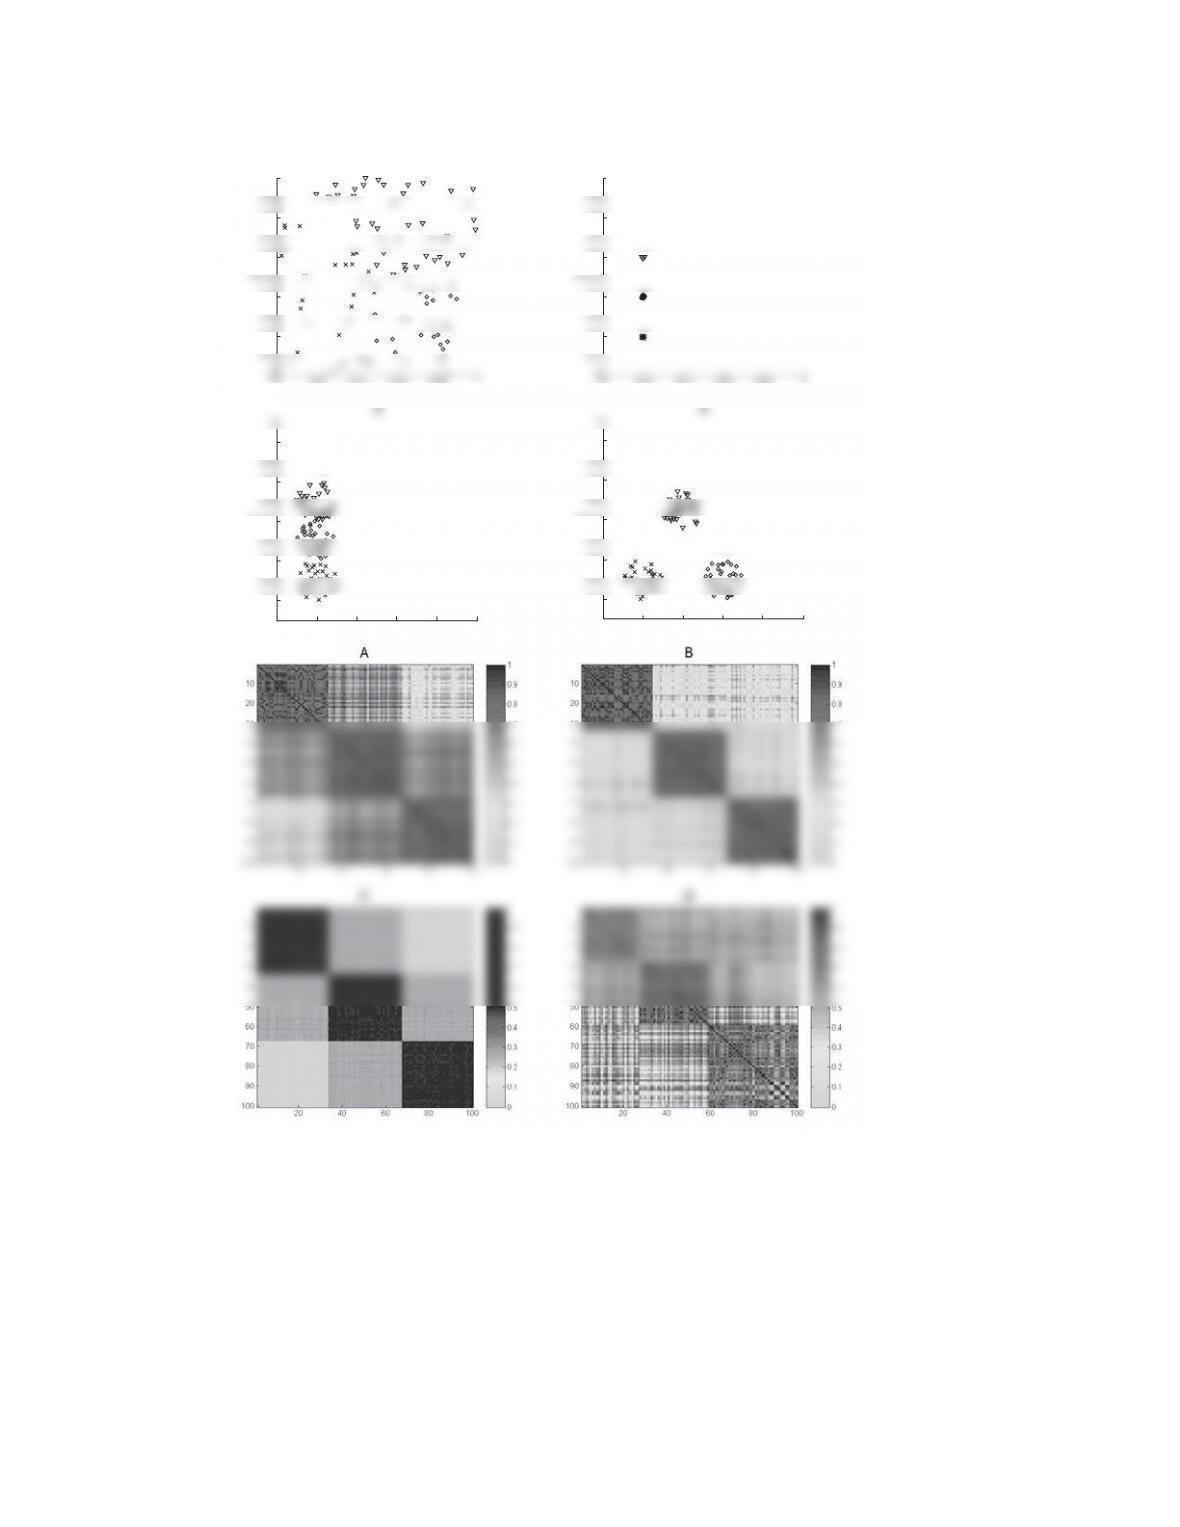
32. In Figure 8.9, match the similarity matrices, which are sorted according to
cluster labels, with the sets of points. Differences in shading and marker
shape distinguish between clusters, and each set of points contains 100 points
and three clusters. In the set of points labeled 2, there are three very tight,
equal-sized clusters.
145
1
0.8
0.6
1
0.8
0.6
0.9
0.7
0.5
0.3
0.1
0
0 0.2 0.4 0.6 0.8 1
x
y
0.9
0.7
0.5
0.3
0.1
0
0 0.2 0.4 0.6 0.8 1
x
y
1
2
Figure 8.9. Points and similarity matrices for Exercise 32.