83
null
(b) How many leaf nodes are there in the candidate hash tree? How many
internal nodes are there?
(c) Consider a transaction that contains the following items: {1,2,3,5,6}.
Using the hash tree constructed in part (a), which leaf nodes will be
checked against the transaction? What are the candidate 3-itemsets
contained in the transaction?
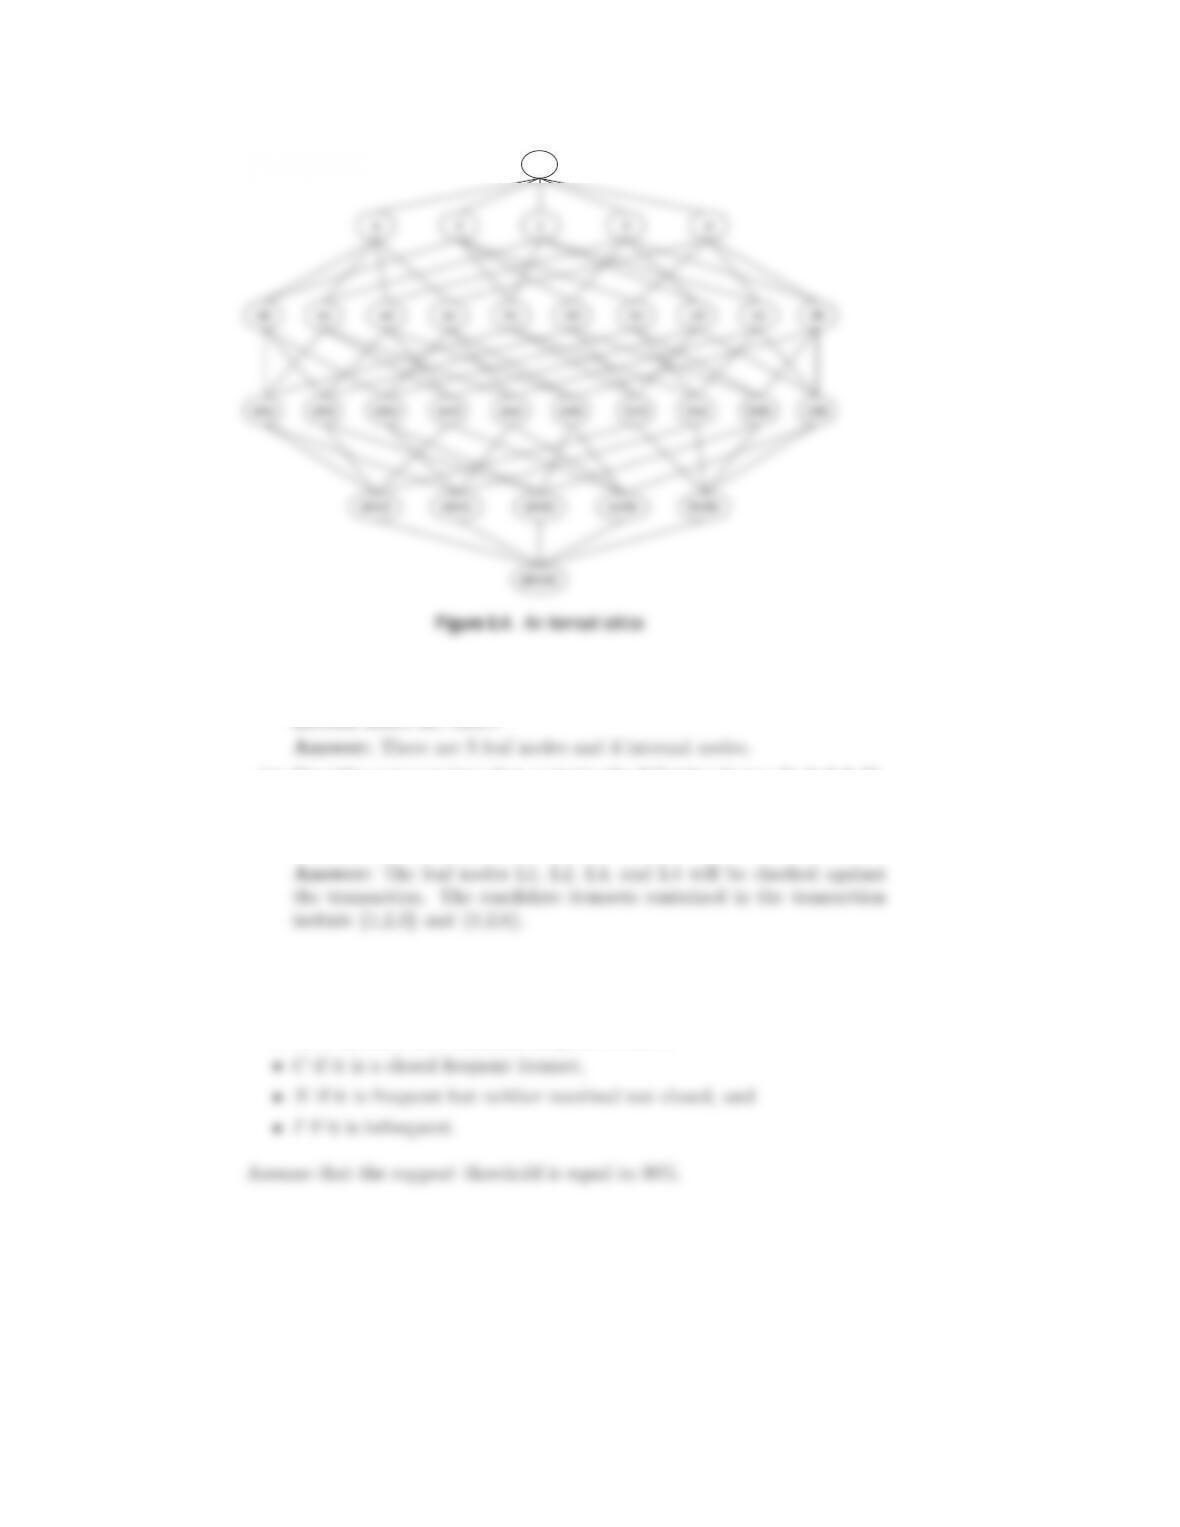
11. Given the lattice structure shown in Figure 6.4 and the transactions given in
Table 6.3, label each node with the following letter(s):
•Mif the node is a maximal frequent itemset,

84 Chapter 6 Association Analysis
Answer:
The lattice structure is shown below.
null
A B C D E
CC C C F
C
Figure 6.5. Solution for Exercise 11.
12. The original association rule mining formulation uses the support and confi-
dence measures to prune uninteresting rules.
(a) Draw a contingency table for each of the following rules using the trans-
actions shown in Table 6.4.
Rules: {b}−→{c},{a}−→{d},{b}−→{d},{e}−→{c},
{c}−→{a}.
Answer:
c c
d d
d d
(b) Use the contingency tables in part (a) to compute and rank the rules
in decreasing order according to the following measures.

Table 6.4. Example of market basket transactions.
Transaction ID Items Bought
1{a, b, d, e}
2{b, c, d}
3{a, b, d, e}
4{a, c, d, e}
5{b, c, d, e}
6{b, d, e}
7{c, d}
8{a, b, c}
9{a, d, e}
10 {b, d}
i. Support.
Answer:
Rules Support Rank
ii. Confidence.
Answer:
Rules Confidence Rank
b−→ c3/7 3
iii. Interest(X−→ Y)=P(X,Y )
P(X)P(Y).
Answer:
Rules Interest Rank
b−→ c0.214 3
a−→ d0.72 2
iv. IS(X−→ Y)= P(X,Y )
√P(X)P(Y).
Answer:

86 Chapter 6 Association Analysis
Rules IS Rank
v. Klosgen(X−→ Y)=P(X, Y )×(P(Y|X)−P(Y)), where P(Y|X)=
P(X,Y )
P(X).
Answer:
Rules Klosgen Rank
b−→ c-0.039 2
vi. Odds ratio(X−→ Y)=P(X,Y )P(X,Y)
P(X,Y)P(X,Y ).
Answer:
Rules Odds Ratio Rank
b−→ c0.375 2
13. Given the rankings you had obtained in Exercise 12, compute the correla-
tion between the rankings of confidence and the other five measures. Which
measure is most highly correlated with confidence? Which measure is least
correlated with confidence?
Answer:
Correlation(Confidence, Support) = 0.97.
Correlation(Confidence, Interest) = 1.
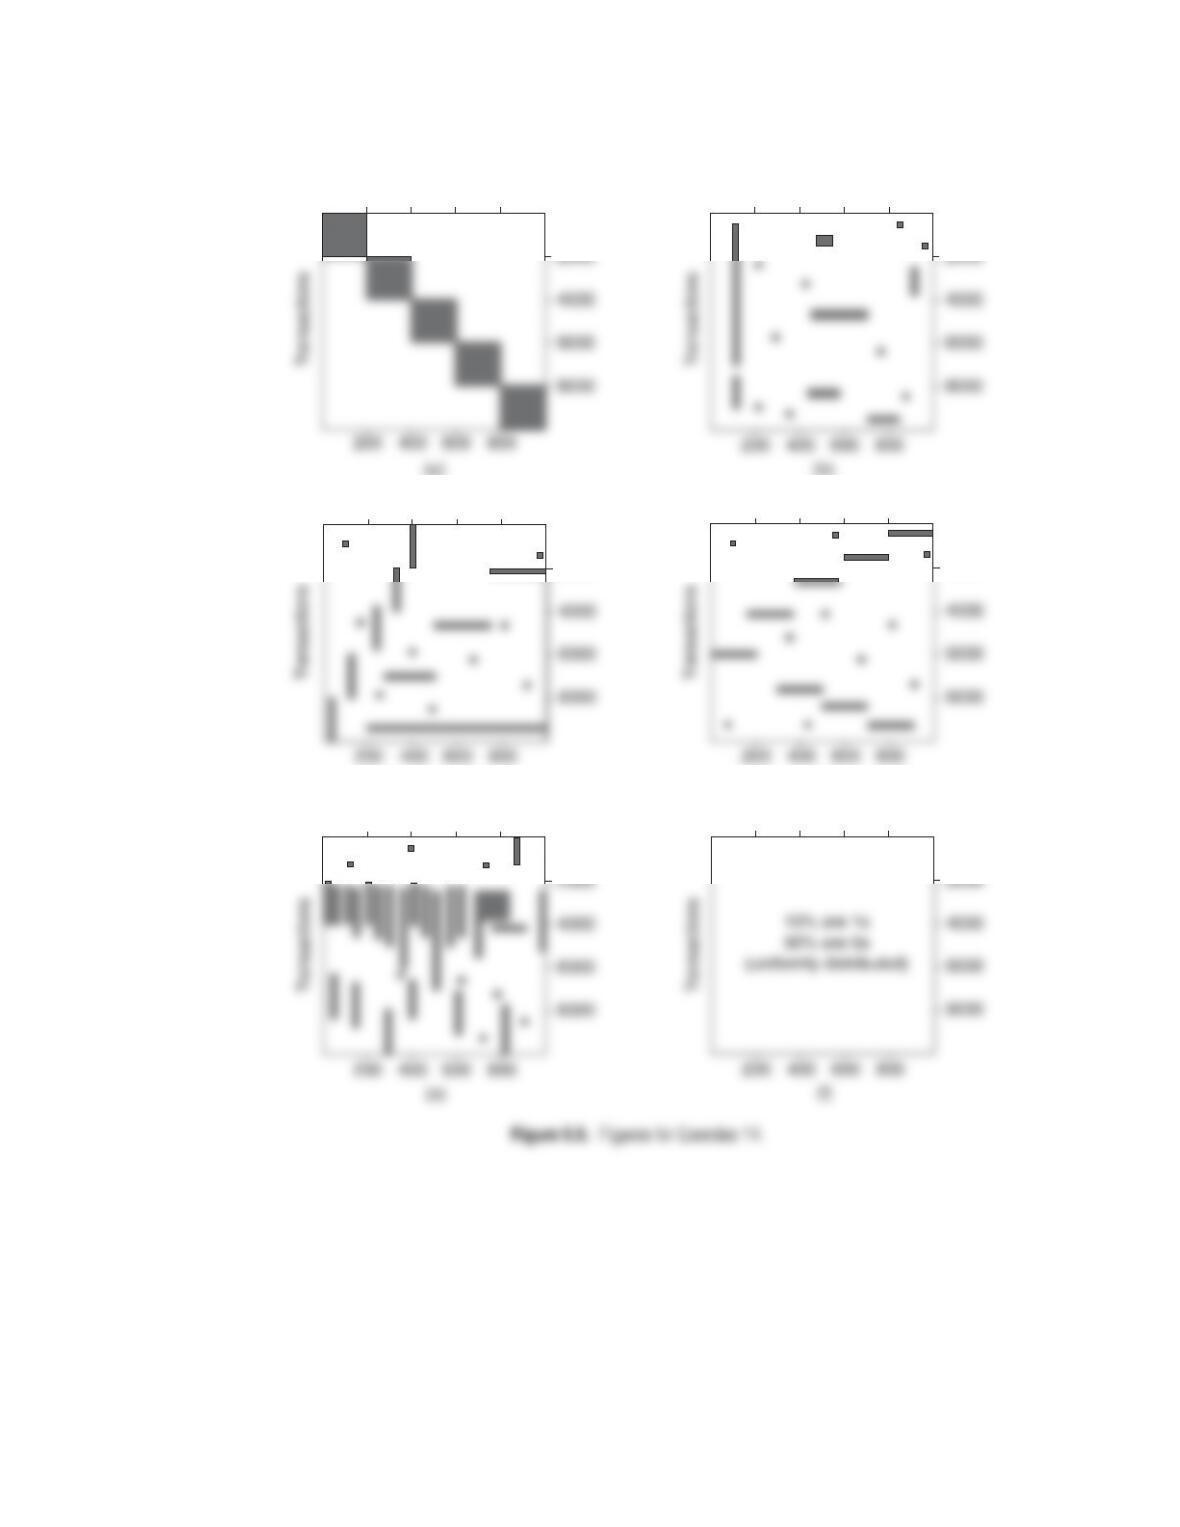
14. Answer the following questions using the data sets shown in Figure 6.6.
Note that each data set contains 1000 items and 10,000 transactions. Dark
cells indicate the presence of items and white cells indicate the absence of
87
items. We will apply the Apriori algorithm to extract frequent itemsets with
minsup = 10% (i.e., itemsets must be contained in at least 1000 transac-
tions)?
(a) Which data set(s) will produce the most number of frequent itemsets?
(b) Which data set(s) will produce the fewest number of frequent itemsets?
(c) Which data set(s) will produce the longest frequent itemset?
(d) Which data set(s) will produce frequent itemsets with highest maximum
support?
(e) Which data set(s) will produce frequent itemsets containing items with
wide-varying support levels (i.e., items with mixed support, ranging
from less than 20% to more than 70%).
15. (a) Prove that the φcoefficient is equal to 1 if and only if f11 =f1+ =f+1.
Answer:
Instead of proving f11 =f1+ =f+1, we will show that P(A, B)=
P(A)=P(B), where P(A, B)=f11/N ,P(A)=f1+/N ,andP(B)=
88 Chapter 6 Association Analysis
600 800400200
Items
600 800400200
Items
(a) (b)
2000
600 800400200
Items
(c)
2000
600 800400200
Items
(d)
2000
4000
6000
600 800400200
Items
2000
4000
6000
600 800400200
Items
10% are 1s
90% are 0s
(uniformly distributed)
89
where β=1−P(A)+2P(A, B). Note that the second solution, in
which the second term on the left hand side is positive, is not a feasible
(b) Show that if Aand Bare independent, then P(A, B)×P(A, B)=
P(A, B)×P(A, B).
Answer:
When Aand Bare independent, P(A, B)=P(A)×P(B) or equiva-
lently:
(c) Show that Yule’s Qand Ycoefficients
Q=f11f00 −f10f01
f11f00 +f10f01
Y=√f11f00 −√f10f01
√f11f00 +√f10f01
are normalized versions of the odds ratio.
Answer:
Odds ratio can be written as:
90 Chapter 6 Association Analysis
In both cases, Qand Yincrease monotonically with α.Furthermore,
when α=0,Q=Y=−1 to represent perfect negative correlation.
When α= 1, which is the condition for attribute independence, Q=
Y= 1. Finally, when α=∞,Q=Y= +1. This suggests that Qand
Yare normalized versions of α.
(d) Write a simplified expression for the value of each measure shown in
Tables 6.11 and 6.12 when the variables are statistically independent.
Answer:
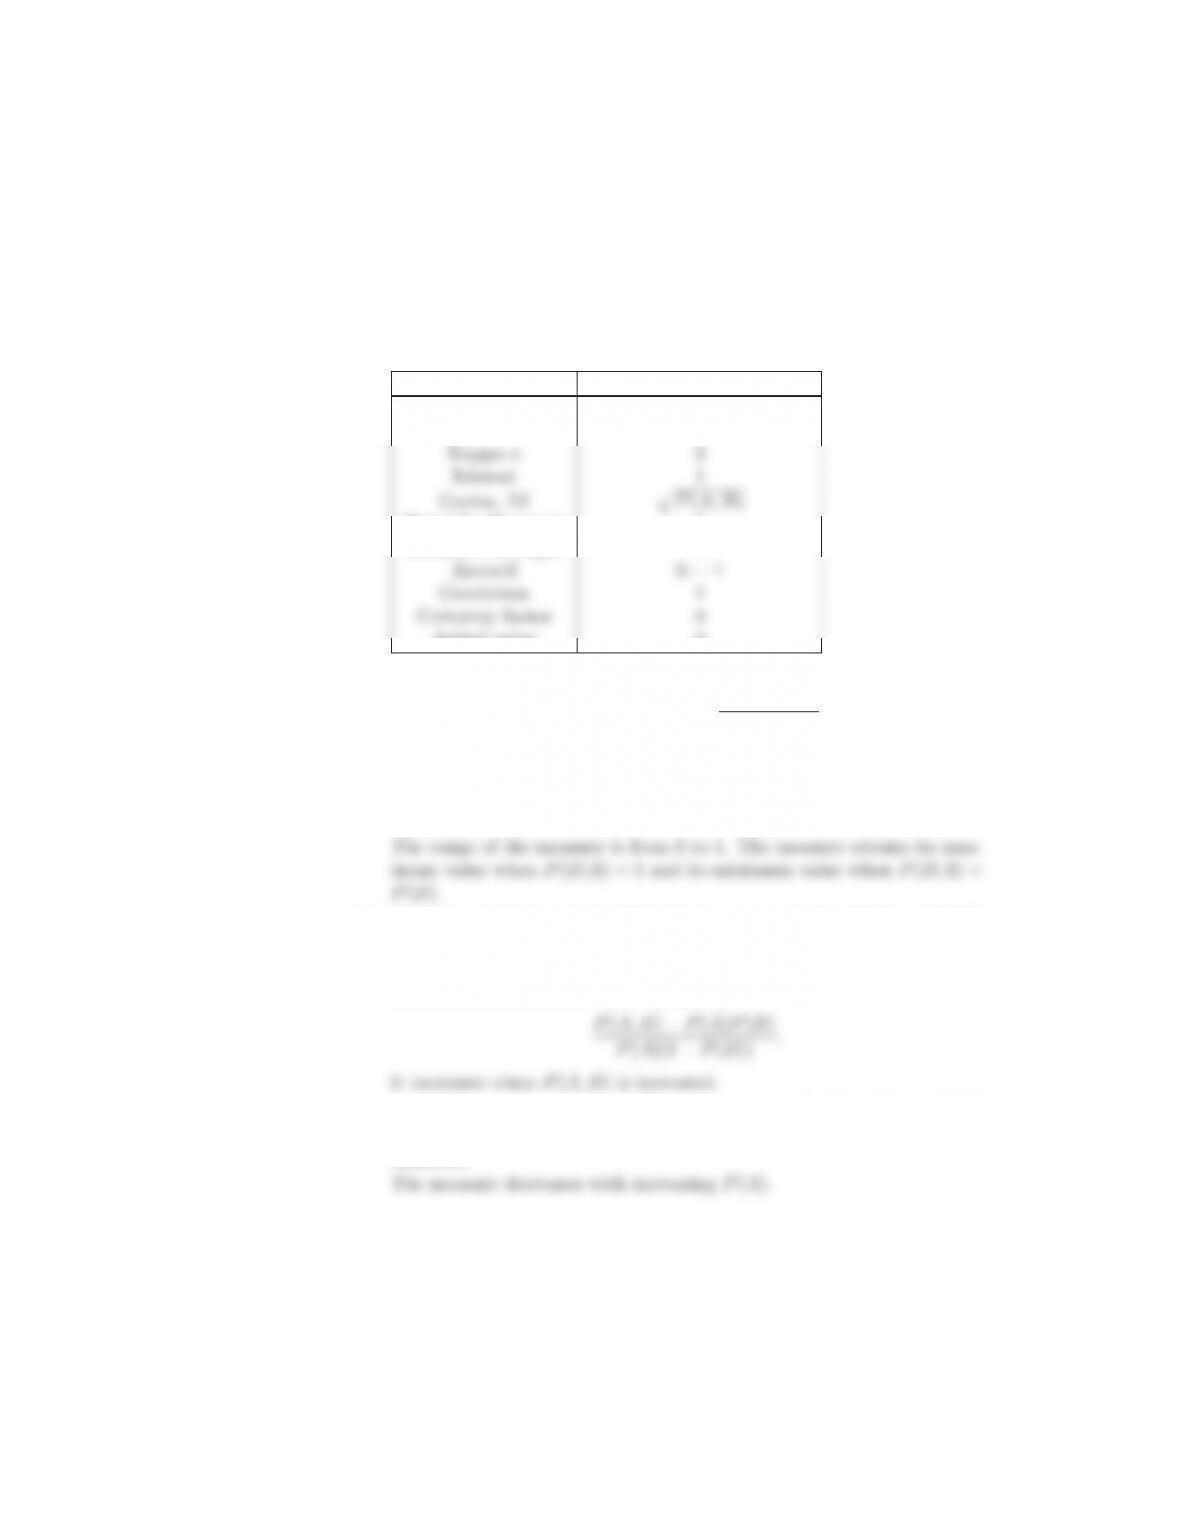
Measure Value under independence
φ-coefficient 0
Odds ratio 1
Piatetsky-Shapiro’s 0
Collective strength 1
Added value 0
16. Consider the interestingness measure, M=P(B|A)−P(B)
1−P(B), for an association
rule A−→ B.
(a) What is the range of this measure? When does the measure attain its
maximum and minimum values?
Answer:
(b) How does Mbehave when P(A, B) is increased while P(A)andP(B)
remain unchanged?
Answer:
The measure can be rewritten as follows:
(c) How does Mbehave when P(A) is increased while P(A, B)andP(B)
remain unchanged?
Answer:

91
(d) How does Mbehave when P(B) is increased while P(A, B)andP(A)
remain unchanged?
Answer:
(e) Is the measure symmetric under variable permutation?
(f) What is the value of the measure when Aand Bare statistically inde-
pendent?
(g) Is the measure null-invariant?
(h) Does the measure remain invariant under row or column scaling oper-
ations?
(i) How does the measure behave under the inversion operation?
17. Suppose we have market basket data consisting of 100 transactions and 20
items. If the support for item ais 25%, the support for item bis 90% and the
support for itemset {a, b}is 20%. Let the support and confidence thresholds
be 10% and 60%, respectively.
(a) Compute the confidence of the association rule {a}→{b}.Istherule
interesting according to the confidence measure?
Answer:
(b) Compute the interest measure for the association pattern {a, b}.De–
scribe the nature of the relationship between item aand item bin terms
of the interest measure.
Answer:
(c) What conclusions can you draw from the results of parts (a) and (b)?
Answer:
(d) Prove that if the confidence of the rule {a}−→{b}is less than the
support of {b}, then:
i. c({a}−→{b})>c({a}−→{b}),
ii. c({a}−→{b})>s({b}),
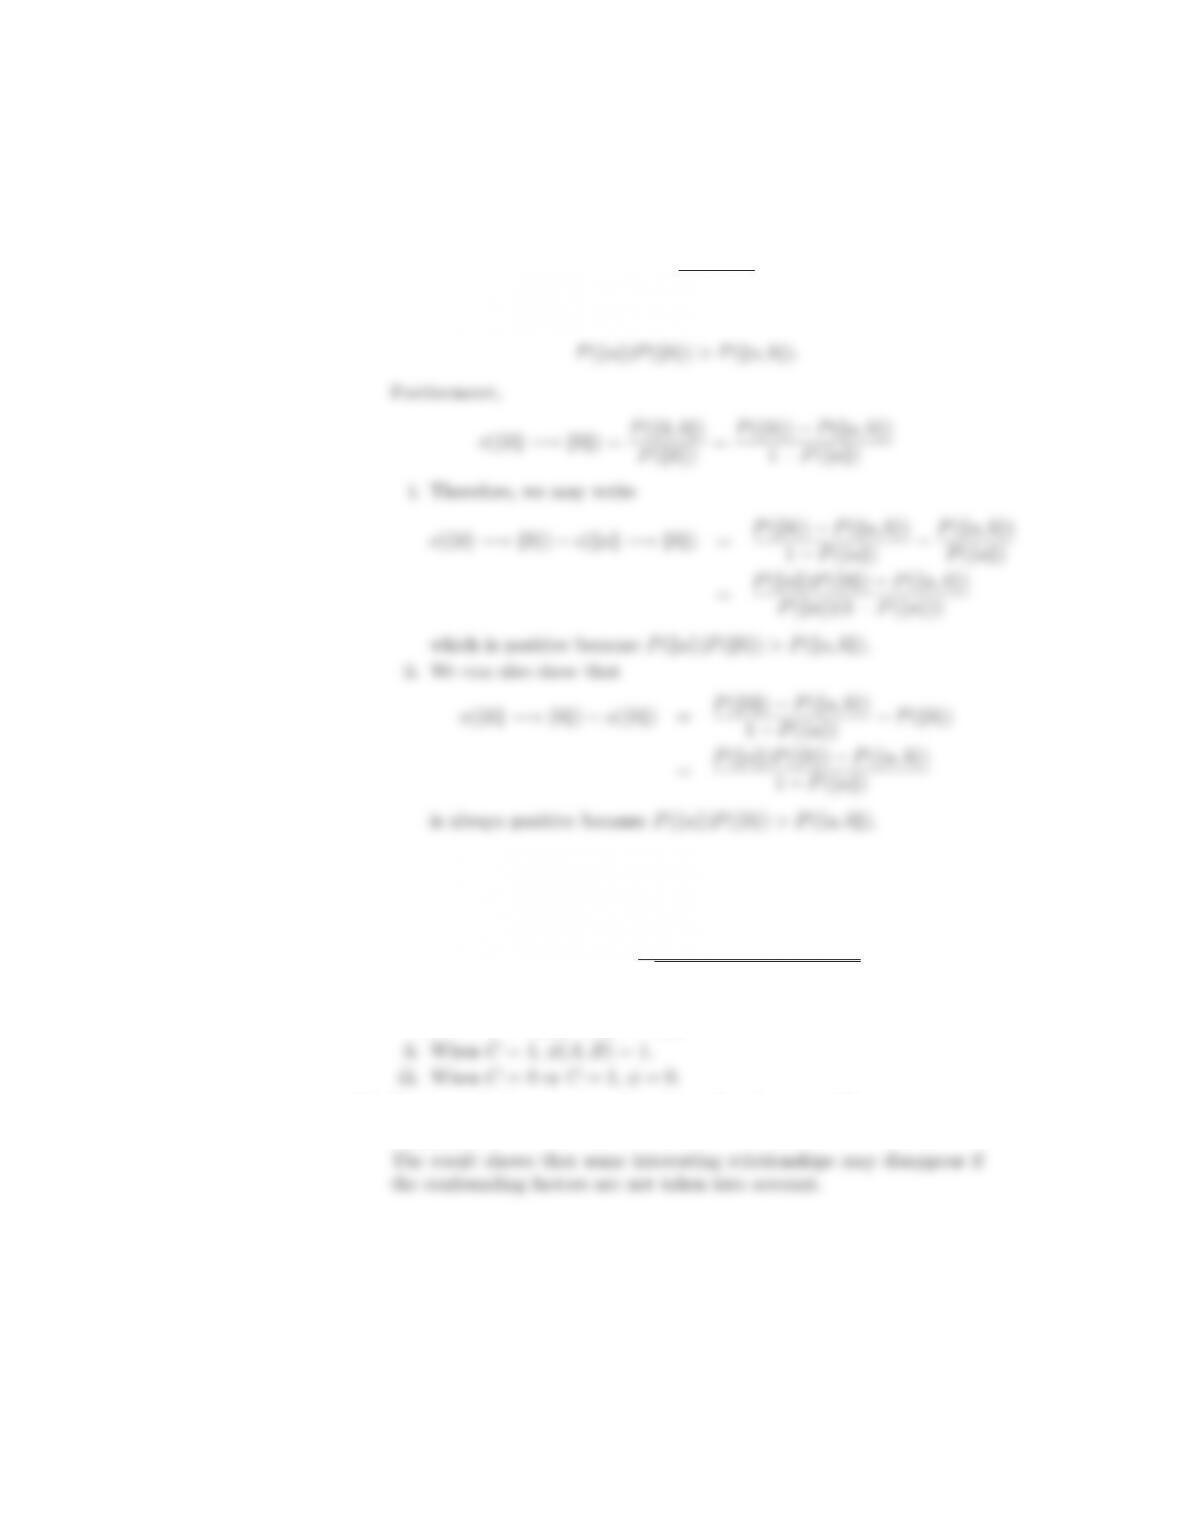
92 Chapter 6 Association Analysis
where c(·) denote the rule confidence and s(·) denote the support of an
itemset.
Answer:
Let
c({a}−→{b})=P({a, b})
P({a})<P({b}),
which implies that
18. Table 6.5 shows a 2 ×2×2contingencytableforthebinaryvariablesAand
Bat different values of the control variable C.
(a) Compute the φcoefficient for Aand Bwhen C=0,C=1,andC=0
or 1. Note that φ({A, B})= P(A,B)−P(A)P(B)
√P(A)P(B)(1−P(A))(1−P(B)) .
Answer:
i. When C=0,φ(A, B)=−1/3.
(b) What conclusions can you draw from the above result?
Answer:
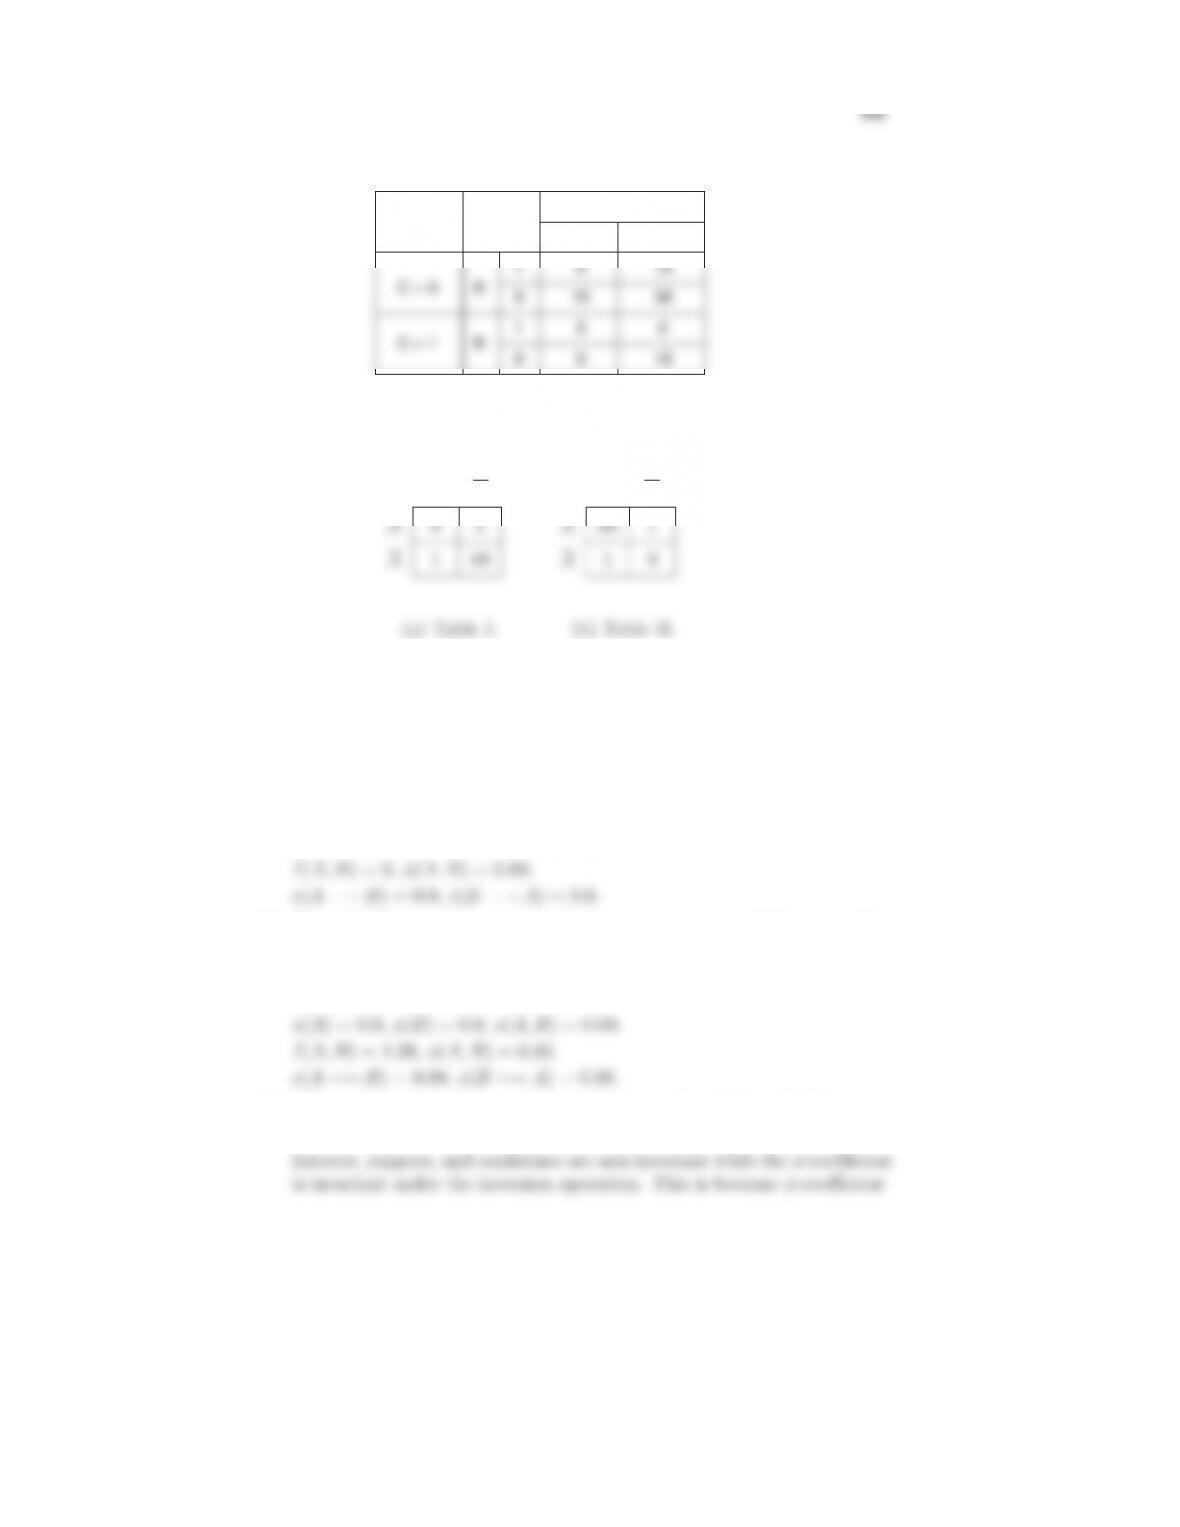
Table 6.5. A Contingency Table.
A
1
0
1
15
0
Table 6.6. Contingency tables for Exercise 19.
BBBB
19. Consider the contingency tables shown in Table 6.6.
(a) For table I, compute support, the interest measure, and the φcorrela-
tion coefficient for the association pattern {A, B}. Also, compute the
confidence of rules A→Band B→A.
Answer:
s(A)=0.1, s(B)=0.9, s(A, B)=0.09.
(b) For table II, compute support, the interest measure, and the φcorrela-
tion coefficient for the association pattern {A, B}. Also, compute the
confidence of rules A→Band B→A.
Answer:
(c) What conclusions can you draw from the results of (a) and (b)?
Answer:

20. Consider the relationship between customers who buy high-definition televi-
sions and exercise machines as shown in Tables 6.19 and 6.20.
(a) Compute the odds ratios for both tables.
Answer:
(b) Compute the φ-coefficient for both tables.
Answer:
(c) Compute the interest factor for both tables.
Answer:
For each of the measures given above, describe how the direction of associa-
tion changes when data is pooled together instead of being stratified.
Answer: