3
Exploring Data
1. Obtain one of the data sets available at the UCI Machine Learning Repository
and apply as many of the different visualization techniques described in the
chapter as possible. The bibliographic notes and book Web site provide
pointers to visualization software.
2. Identify at least two advantages and two disadvantages of using color to
visually represent information.
Advantages: Color makes it much easier to visually distinguish visual el-
3. What are the arrangement issues that arise with respect to three-dimensional
plots?
4. Discuss the advantages and disadvantages of using sampling to reduce the
number of data objects that need to be displayed. Would simple random
sampling (without replacement) be a good approach to sampling? Why or
why not?
5. Describe how you would create visualizations to display information that
describes the following types of systems.
Be sure to address the following issues:
•Representation. How will you map objects, attributes, and relation-
ships to visual elements?
•Arrangement. Are there any special considerations that need to be
taken into account with respect to how visual elements are displayed?
Specific examples might be the choice of viewpoint, the use of trans-
parency, or the separation of certain groups of objects.
•Selection. How will you handle a large number of attributes and data
objects?
The following solutions are intended for illustration.
(a) Computer networks. Be sure to include both the static aspects of the
network, such as connectivity, and the dynamic aspects, such as traffc.
(b) The distribution of specific plant and animal species around the world
for a specific moment in time.
21
(c) The use of computer resources, such as processor time, main memory,
and disk, for a set of benchmark database programs.
(d) The change in occupation of workers in a particular country over the
last thirty years. Assume that you have yearly information about each
person that also includes gender and level of education.
6. Describe one advantage and one disadvantage of a stem and leaf plot with
respect to a standard histogram.
7. How might you address the problem that a histogram depends on the number
and location of the bins?

22 Chapter 3 Exploring Data
8. Describe how a box plot can give information about whether the value of an
attribute is symmetrically distributed. What can you say about the symme-
try of the distributions of the attributes shown in Figure 3.11?
9. Compare sepal length, sepal width, petal length, and petal width, using
Figure 3.12.
10. Comment on the use of a box plot to explore a data set with four attributes:
age, weight, height, and income.
11. Give a possible explanation as to why most of the values of petal length and
width fall in the buckets along the diagonal in Figure 3.9.
12. Use Figures 3.14 and 3.15 to identify a characteristic shared by the petal
width and petal length attributes.
13. Simple line plots, such as that displayed in Figure 2.12 on page 56, which
shows two time series, can be used to effectively display high-dimensional
data. For example, in Figure 56 it is easy to tell that the frequencies of the
two time series are different. What characteristic of time series allows the
effective visualization of high-dimensional data?
14. Describe the types of situations that produce sparse or dense data cubes.
Illustrate with examples other than those used in the book.
Any set of data for which all combinations of values are unlikely to occur
would produce sparse data cubes. This would include sets of continuous
15. How might you extend the notion of multidimensional data analysis so that
the target variable is a qualitative variable? In other words, what sorts of
summary statistics or data visualizations would be of interest?
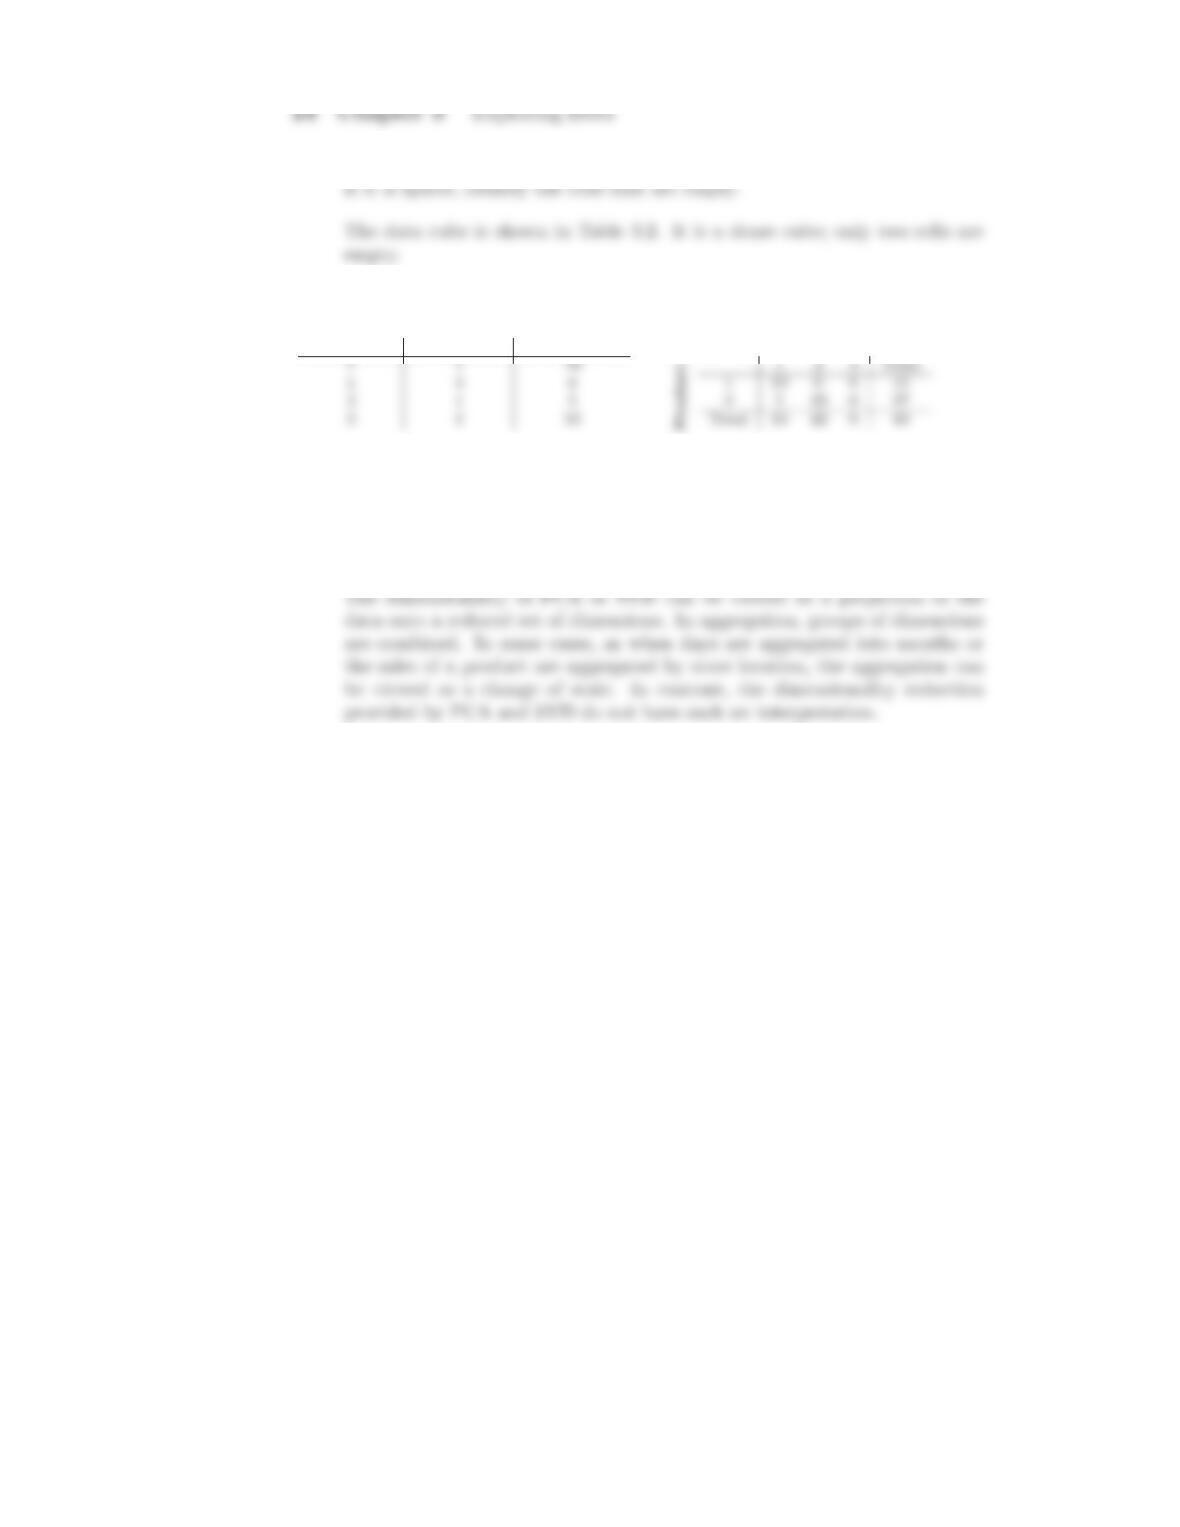
16. Construct a data cube from Table 3.1. Is this a dense or sparse data cube?
Table 3.1. Fact table for Exercise 16.
Product ID Location ID Number Sold
Table 3.2. Data cube for Exercise 16.
Location ID
17. Discuss the differences between dimensionality reduction based on aggrega-
tion and dimensionality reduction based on techniques such as PCA and
SVD.