Chapter 28: Data Mining Concepts
1
CHAPTER 28: DATA MINING CONCEPTS
Answers to Selected Exercises
28.14 – Apply the Apriori algorithm to the following data set:
Trans ID
Items Purchased
101
milk, bread, eggs
102
milk, juice
103
juice, butter
104
milk, bread, eggs
105
coffee, eggs
106
coffee
107
coffee, juice
108
milk, bread, cookies, eggs
109
cookies, butter
110
milk, bread
The set of items is {milk, bread, cookies, eggs, butter, coffee, juice}. Use 0.2 for the
minimum support value.
Answer:
First, we compute the support for 1-item sets
(e.g., milk appears in 5 out of the 10 transactions, support is 0.5):
1-ITEM SETS SUPPORT
milk 0.5
eggs 0.4
coffee 0.3
The min support required is 0.2, so all 1-item sets satisfy
Chapter 28: Data Mining Concepts
3
. . . . butter 2 …………. .
. . . . . . .
… . ..>|milk :5| . …..>|juice :1|.. |coffee:3| |cookies:1|<…
. . . ——- —– . . . ——– . — ——-– ——— .
. . . | \ . . . | …../……. | | .
. . . V V V . V V V V V V .
. . . ——- ——- ——– —— ——- ——– .
....>|eggs :3| …….…………………... .
. ——- .
28.18 – Apply the FP-growth algorithm to the FP tree from Exercise 28.17 and show the
frequent itemsets.
Answer:
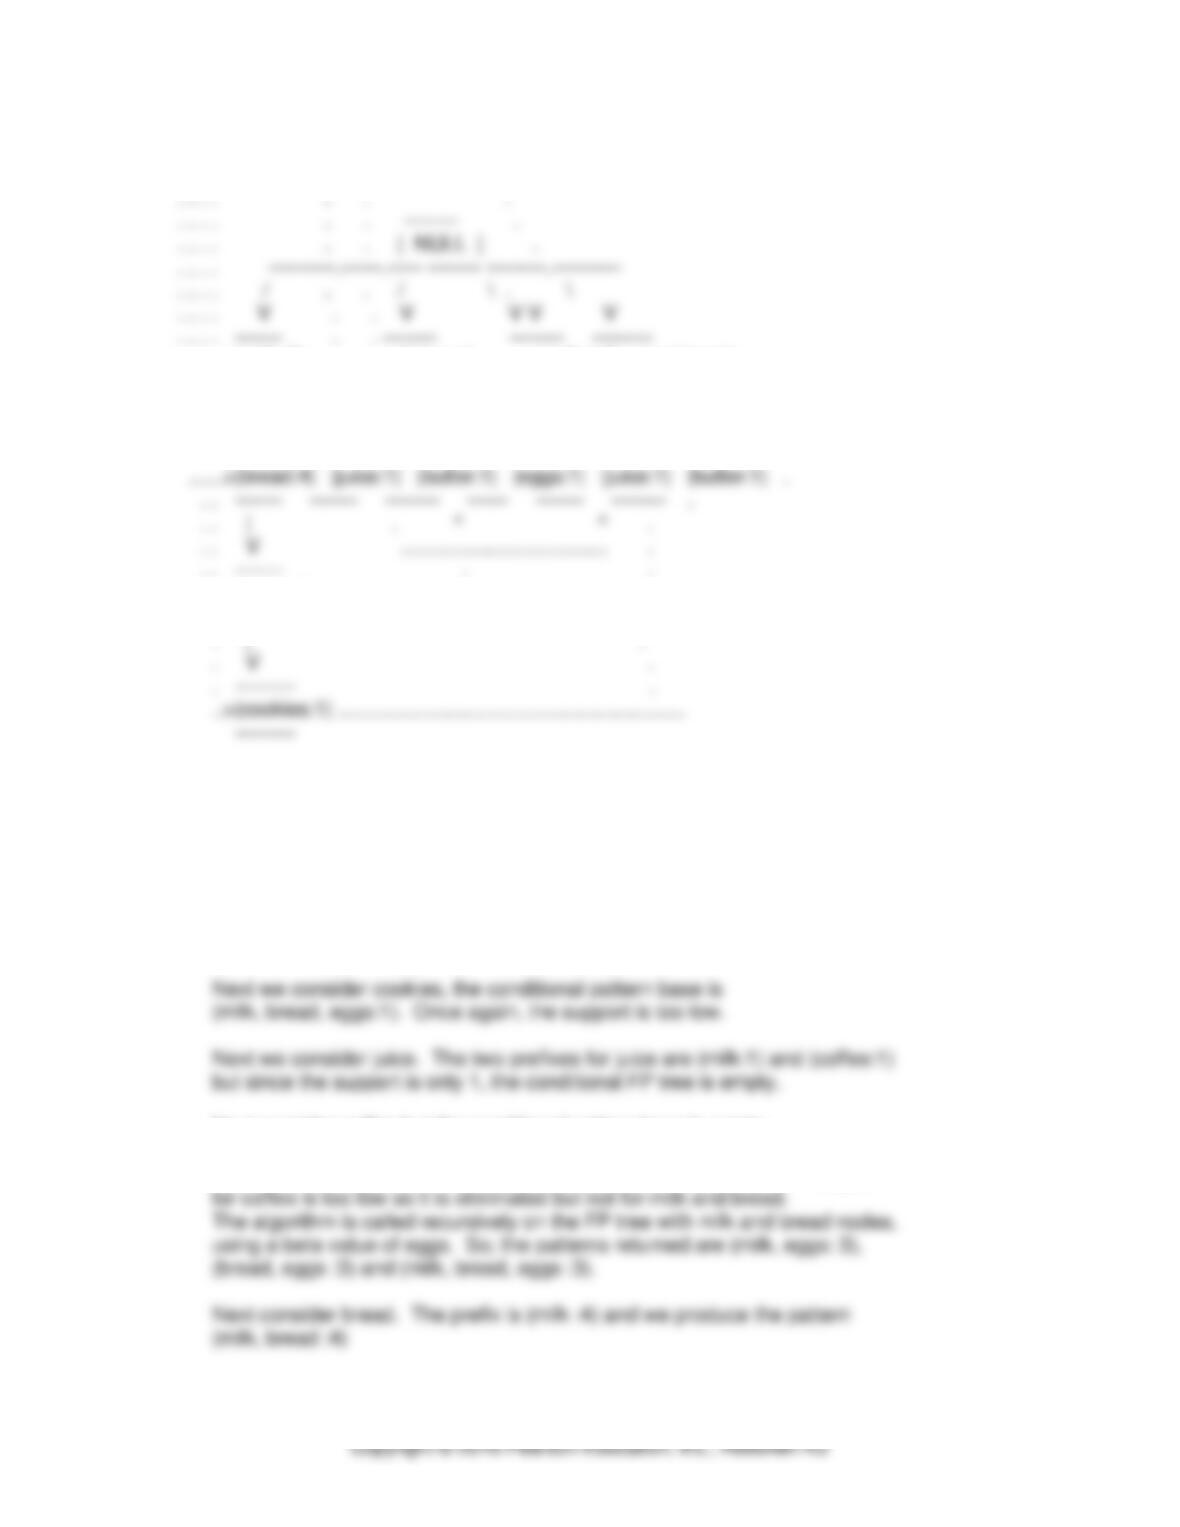
We start with butter. There are two prefixes (juice:1) and (cookies:1).
Since support is only 1, the conditional FP tree is empty.
Next consider coffee but the conditional pattern base is empty.
Next consider eggs. We have (milk, bread :3) and (coffee :1). The support
Chapter 28: Data Mining Concepts
4
Finally, consider milk, which has no prefix, so we are done.
28.19 – Apply the classification algorithm to the following set of data records. The class
attribute is Repeat Customer.
RID
Age
City
Gender
Education
Repeat
Customer
101
20..30
NY
F
College
YES
102
20..30
SF
M
Graduate
YES
103
31..40
NY
F
College
YES
104
51..30
NY
F
College
NO
105
31..40
LA
M
High school
NO
106
41..50
NYY
F
College
YES
107
41..50
NY
F
Graduate
YES
108
20..30
LA
M
College
YES
109
20..30
NY
F
High school
NO
110
20..30
NY
F
college
YES
Answer:
We start by computing the entropy for the entire set. We have 7 positive
samples and 3 negative samples.
The entropy, I(7,3), is -(7/10 * log (7/10) + 3/10 * log(3/10)) = 0.88
We consider the first attribute AGE. There are 4 values for age
31..40 appears 2 times
I(s12, s22) = -(1/2 * log(1/2) + 1/2 * log(1/2)) = 1
51..60 appears 1 time
I(s14, s24) = -(1/1 * log(1/1) = 0
E(AGE) = 5/10 * 0.72 + 2/10 * 1 + 2/10 * 0 + 1/10 * 0 = 0.56
GAIN(AGE) = 0.88 – 0.56 = 0.32
We consider the second attribute CITY. There are 3 values for city
Copyright © 2016 Pearson Education, Inc., Hoboken NJ
F occurs 7 times
I(s11, s21) = -(2/7 * log(2/7) + 5/7 * log(5/7)) = 0.86
M occurs 3 times
I(s12, s22) = -(1/3 * log(1/3) + 2/3 * log(2/3)) = 0.92
E(GENDER) = 0.88
The greatest gain is for the EDUCATION attribute.
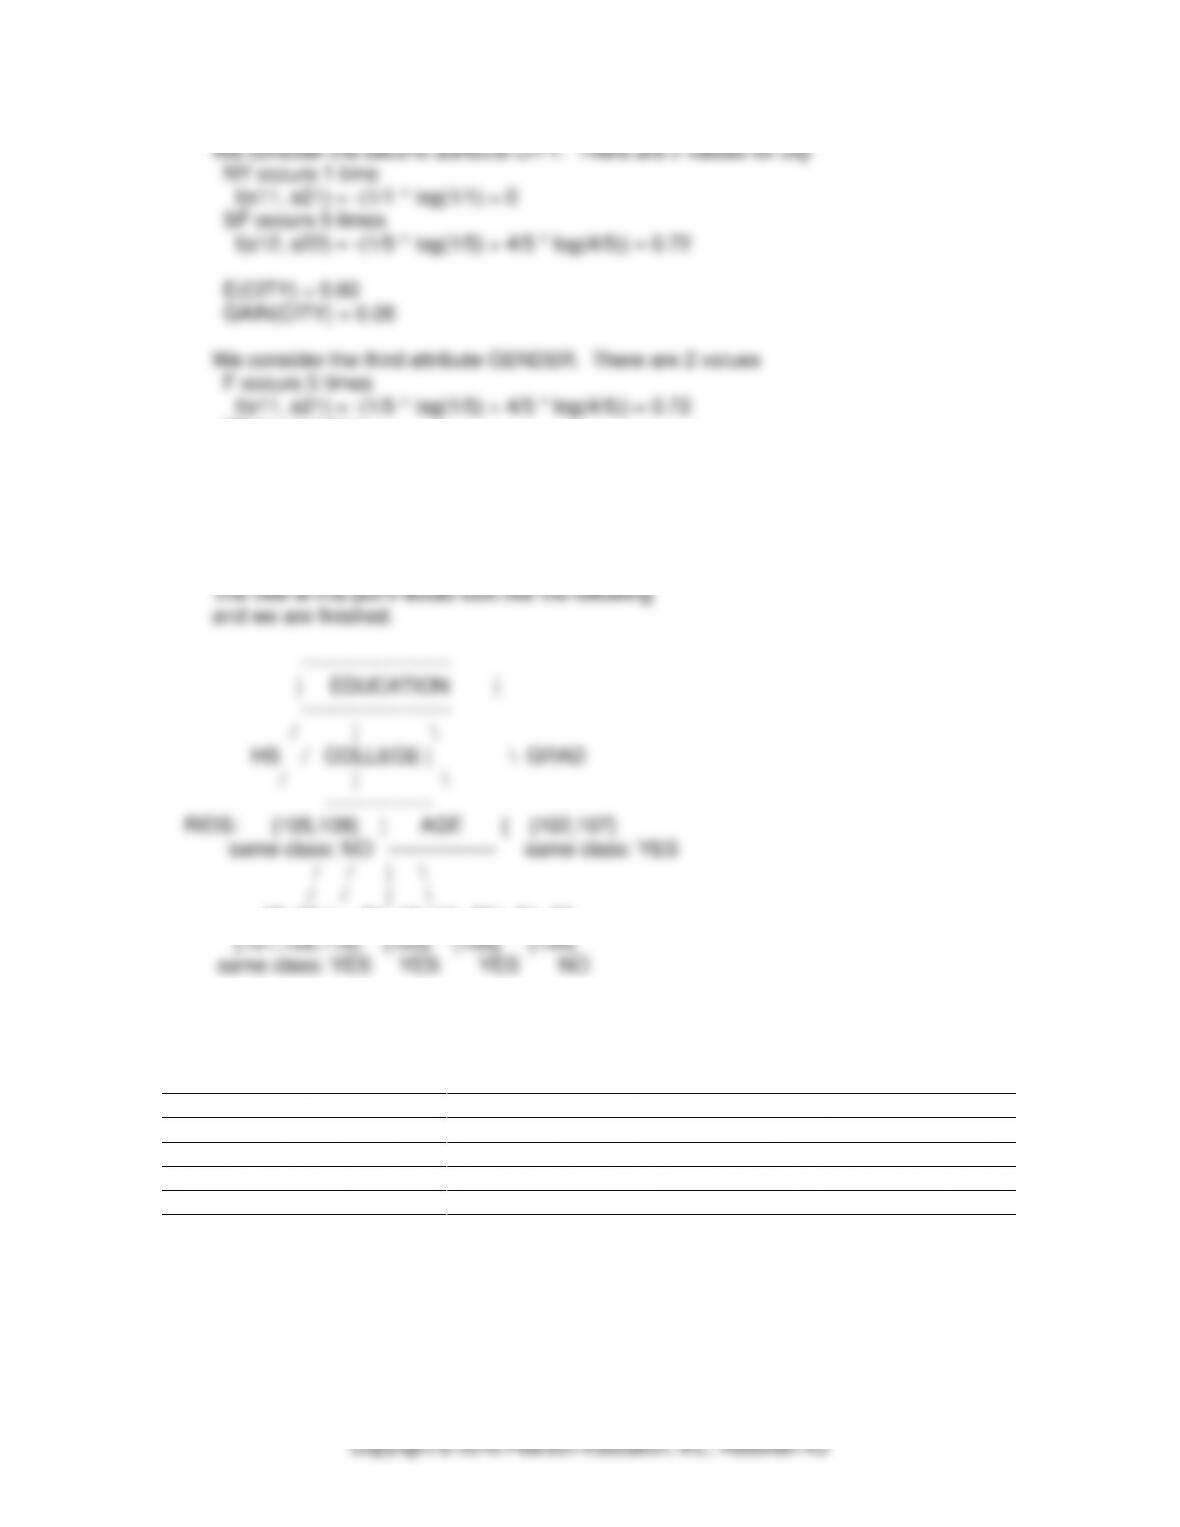
The tree at this point would look like the following:
——-————
| EDUCATION |
——-————
20..30 appears 3 times
I(s11, s21) = -(3/3 * log(3/3) = 0
41..50 appears 1 time
I(s13, s23) = -(1/1 * log(1/1) = 0
51..60 appears 1 time
I(s14, s24) = -(1/1 * log(1/1) = 0
E(AGE) = 0
GAIN(AGE) = 0.65
Chapter 28: Data Mining Concepts
6
M occurs 1 time
I(s12, s22) = -(1/1 * log(1/1) = 0
E(GENDER) = 0.60
GAIN(GENDER) = 0.05
The greatest gain is for the AGE attribute.
20..30 / /31..40 |41..50 \ 51..60
28.20 – Consider the following set of two-dimensional records:
RID
Dimension 1
Dimension 2
1
8
4
2
5
4
3
2
4
4
2
6
5
2
8
6
8
6
Also consider two different clustering schemes: (1) where Cluster 1 contains records {1, 2, 3}
and Cluster 2 contains records {4, 5, 6} and (2) where Cluster 1 contains records {1, 6} and
Cluster 2 contains records {2, 3, 4, 5}. Which scheme is better and why?
Chapter 28: Data Mining Concepts
7
Answer:
Compare the error of the two clustering schemes. The scheme with the
smallest error is better.
M2 = ((2+2+8)/3, (6+8+6)/3) = (4,6.66)
2 2 2 2 2 2
C2_error = (2-4) + (6-6.66) + (2-4) (8-6.66) + (8-4) + (6-6.66)
= 26.67
C1_error + C2_error = 44.67
For SCHEME (2) we have C1 = {1,6} and C2 = {2,3,4,5}
= 17.74
28.21 – Use the K-means algorithm to cluster the data from Exercise 28.20. We can use a
value of 3 for K and can assume that the records with RIDs 1, 3, and 5 are used for the initial
cluster centroids (means).
Chapter 28: Data Mining Concepts
8
Answer:
We start by specifying the centroid for each of the 3 clusters.
C1’s centroid is (8,4) , i.e., record with rid = 1
C2’s centroid is (2,4) , i.e., record with rid = 3
C3’s centroid is (2,8) , i.e., record with rid = 5
2 2
SQROOT( |2-5| + |4-4| ) = 3
The distance between record 2 and centroid for C3 is
2 2
in C1.
The distance between record 4, i.e., point (2,6), and centroid for C1 is
2 2
in C2.
The distance between record 6, i.e., point (8,6), and centroid for C1 is
2 2
SQROOT( |8-8| + |4-6| ) = 2
The distance between record 6 and centroid for C2 is
Copyright © 2016 Pearson Education, Inc., Hoboken NJ
28.22 – The k-Means algorithm uses a similarly metric of distance between a record and a
cluster centroid. If the attributes of the records are not quantitative but categorical in nature,
such as Income Level with values {low, medium, high} or Married with values {yes, no} or
State of Residence with values {Alabama, Alaska,…, Wyoming} then the distance metric is
not meaningful. Define a more suitable similarity metric that can be used for clustering data
records that contain categorical data.
Answer:
We can define a distance metric or rather a similarity metric between
two records based on the number of common values the two records have
across all dimensions.
For example, consider the following 3 records:
RID INCOME LEVEL MARRIED STATE
1 high yes ny

Copyright © 2016 Pearson Education, Inc., Hoboken NJ