
2
Data
1. In the initial example of Chapter 2, the statistician says, “Yes, fields 2 and
3 are basically the same.” Can you tell from the three lines of sample data
that are shown why she says that?
2. Classify the following attributes as binary, discrete, or continuous. Also
classify them as qualitative (nominal or ordinal) or quantitative (interval or
ratio). Some cases may have more than one interpretation, so briefly indicate
your reasoning if you think there may be some ambiguity.
(a) Time in terms of AM or PM. Binary, qualitative, ordinal
(g) Number of patients in a hospital. Discrete, quantitative, ratio
(h) ISBN numbers for books. (Look up the format on the Web.) Discrete,
qualitative, nominal (ISBN numbers do have order information, though)

6 Chapter 2 Data
3. You are approached by the marketing director of a local company, who be-
lieves that he has devised a foolproof way to measure customer satisfaction.
He explains his scheme as follows: “It’s so simple that I can’t believe that
no one has thought of it before. I just keep track of the number of customer
complaints for each product. I read in a data mining book that counts are
ratio attributes, and so, my measure of product satisfaction must be a ratio
attribute. But when I rated the products based on my new customer satisfac-
tion measure and showed them to my boss, he told me that I had overlooked
the obvious, and that my measure was worthless. I think that he was just
mad because our best-selling product had the worst satisfaction since it had
the most complaints. Could you help me set him straight?”
(a) Who is right, the marketing director or his boss? If you answered, his
boss, what would you do to fix the measure of satisfaction?
(b) What can you say about the attribute type of the original product
satisfaction attribute?
4. A few months later, you are again approached by the same marketing director
as in Exercise 3. This time, he has devised a better approach to measure the
extent to which a customer prefers one product over other, similar products.
He explains, “When we develop new products, we typically create several
variations and evaluate which one customers prefer. Our standard procedure
is to give our test subjects all of the product variations at one time and then

7
ask them to rank the product variations in order of preference. However, our
test subjects are very indecisive, especially when there are more than two
products. As a result, testing takes forever. I suggested that we perform
the comparisons in pairs and then use these comparisons to get the rankings.
Thus, if we have three product variations, we have the customers compare
variations 1 and 2, then 2 and 3, and finally 3 and 1. Our testing time with
my new procedure is a third of what it was for the old procedure, but the
employees conducting the tests complain that they cannot come up with a
consistent ranking from the results. And my boss wants the latest product
evaluations, yesterday. I should also mention that he was the person who
came up with the old product evaluation approach. Can you help me?”
(a) Is the marketing director in trouble? Will his approach work for gener-
ating an ordinal ranking of the product variations in terms of customer
(b) Is there a way to fix the marketing director’s approach? More generally,
what can you say about trying to create an ordinal measurement scale
based on pairwise comparisons?
One solution: For three items, do only the first two comparisons. A
(c) For the original product evaluation scheme, the overall rankings of each
product variation are found by computing its average over all test sub-
jects. Comment on whether you think that this is a reasonable ap-
proach. What other approaches might you take?
5. Can you think of a situation in which identification numbers would be useful
for prediction?
6. An educational psychologist wants to use association analysis to analyze test
results. The test consists of 100 questions with four possible answers each.
8 Chapter 2 Data
(a) How would you convert this data into a form suitable for association
analysis?
Association rule analysis works with binary attributes, so you have to
convert original data into binary form as follows:
(b) In particular, what type of attributes would you have and how
many of them are there?
7. Which of the following quantities is likely to show more temporal autocorre-
lation: daily rainfall or daily temperature? Why?
A feature shows spatial auto-correlation if locations that are closer to each
8. Discuss why a document-term matrix is an example of a data set that has
asymmetric discrete or asymmetric continuous features.
The ijth entry of a document-term matrix is the number of times that term
9. Many sciences rely on observation instead of (or in addition to) designed ex-
periments. Compare the data quality issues involved in observational science
with those of experimental science and data mining.

10. Discuss the difference between the precision of a measurement and the terms
single and double precision, as they are used in computer science, typically
to represent floating-point numbers that require 32 and 64 bits, respectively.
11. Give at least two advantages to working with data stored in text files instead
of in a binary format.
(1) Text files can be easily inspected by typing the file or viewing it with a
(2) Text files are more portable than binary files, both across systems and
programs.
12. Distinguish between noise and outliers. Be sure to consider the following
questions.
(a) Is noise ever interesting or desirable? Outliers?
(b) Can noise objects be outliers?
(c) Are noise objects always outliers?
(d) Are outliers always noise objects?
(e) Can noise make a typical value into an unusual one, or vice versa?

13. Consider the problem of finding the Knearest neighbors of a data object. A
programmer designs Algorithm 2.1 for this task.
Algorithm 2.1 Algorithm for finding Knearest neighbors.
1: for i=1tonumber of data objects do
2: Find the distances of the ith object to all other objects.
3: Sort these distances in decreasing order.
(Keep track of which object is associated with each distance.)
4: return the objects associated with the first Kdistances of the sorted list
5: end for
(a) Describe the potential problems with this algorithm if there are dupli-
cate objects in the data set. Assume the distance function will only
return a distance of 0 for objects that are the same.
There are several problems. First, the order of duplicate objects on a
(b) How would you fix this problem?
14. The following attributes are measured for members of a herd of Asian ele-
phants: weight, height, tusk length, trunk length, and ear area. Based on
these measurements, what sort of similarity measure from Section 2.4 would
you use to compare or group these elephants? Justify your answer and ex-
plain any special circumstances.
15. You are given a set of mobjects that is divided into Kgroups, where the ith
group is of size mi. If the goal is to obtain a sample of size n<m, what is the
difference between the following two sampling schemes? (Assume sampling
with replacement.)

11
(a) We randomly select n∗mi/m elements from each group.
16. Consider a document-term matrix, where tfij is the frequency of the ith word
(term) in the jth document and mis the number of documents. Consider
the variable transformation that is defined by
tf
ij =tfij ∗log m
df i
,(2.1)
where df iis the number of documents in which the ith term appears and is
known as the document frequency of the term. This transformation is
known as the inverse document frequency transformation.
(a) What is the effect of this transformation if a term occurs in one docu-
ment? In every document?
(b) What might be the purpose of this transformation?
17. Assume that we apply a square root transformation to a ratio attribute x
to obtain the new attribute x∗. As part of your analysis, you identify an
interval (a, b)inwhichx∗has a linear relationship to another attribute y.
2)
18. This exercise compares and contrasts some similarity and distance measures.
(a) For binary data, the L1 distance corresponds to the Hamming distance;
that is, the number of bits that are different between two binary vec-
tors. The Jaccard similarity is a measure of the similarity between two
binary vectors. Compute the Hamming distance and the Jaccard simi-
larity between the following two binary vectors.

12 Chapter 2 Data
(b) Which approach, Jaccard or Hamming distance, is more similar to the
Simple Matching Coefficient, and which approach is more similar to the
cosine measure? Explain. (Note: The Hamming measure is a distance,
while the other three measures are similarities, but don’t let this confuse
you.)
(c) Suppose that you are comparing how similar two organisms of different
species are in terms of the number of genes they share. Describe which
measure, Hamming or Jaccard, you think would be more appropriate
for comparing the genetic makeup of two organisms. Explain. (Assume
that each animal is represented as a binary vector, where each attribute
is 1 if a particular gene is present in the organism and 0 otherwise.)
(d) If you wanted to compare the genetic makeup of two organisms of the
same species, e.g., two human beings, would you use the Hamming
distance, the Jaccard coefficient, or a different measure of similarity or
distance? Explain. (Note that two human beings share >99.9% of the
same genes.)
19. For the following vectors, xand y, calculate the indicated similarity or dis-
tance measures.
(a) x=(1,1,1,1),y=(2,2,2,2) cosine, correlation, Euclidean

13
(c) x=(0,−1,0,1),y=(1,0,−1,0) cosine, correlation, Euclidean
20. Here, we further explore the cosine and correlation measures.
(a) What is the range of values that are possible for the cosine measure?
(b) If two objects have a cosine measure of 1, are they identical? Explain.
(c) What is the relationship of the cosine measure to correlation, if any?
(Hint: Look at statistical measures such as mean and standard devia-
tion in cases where cosine and correlation are the same and different.)
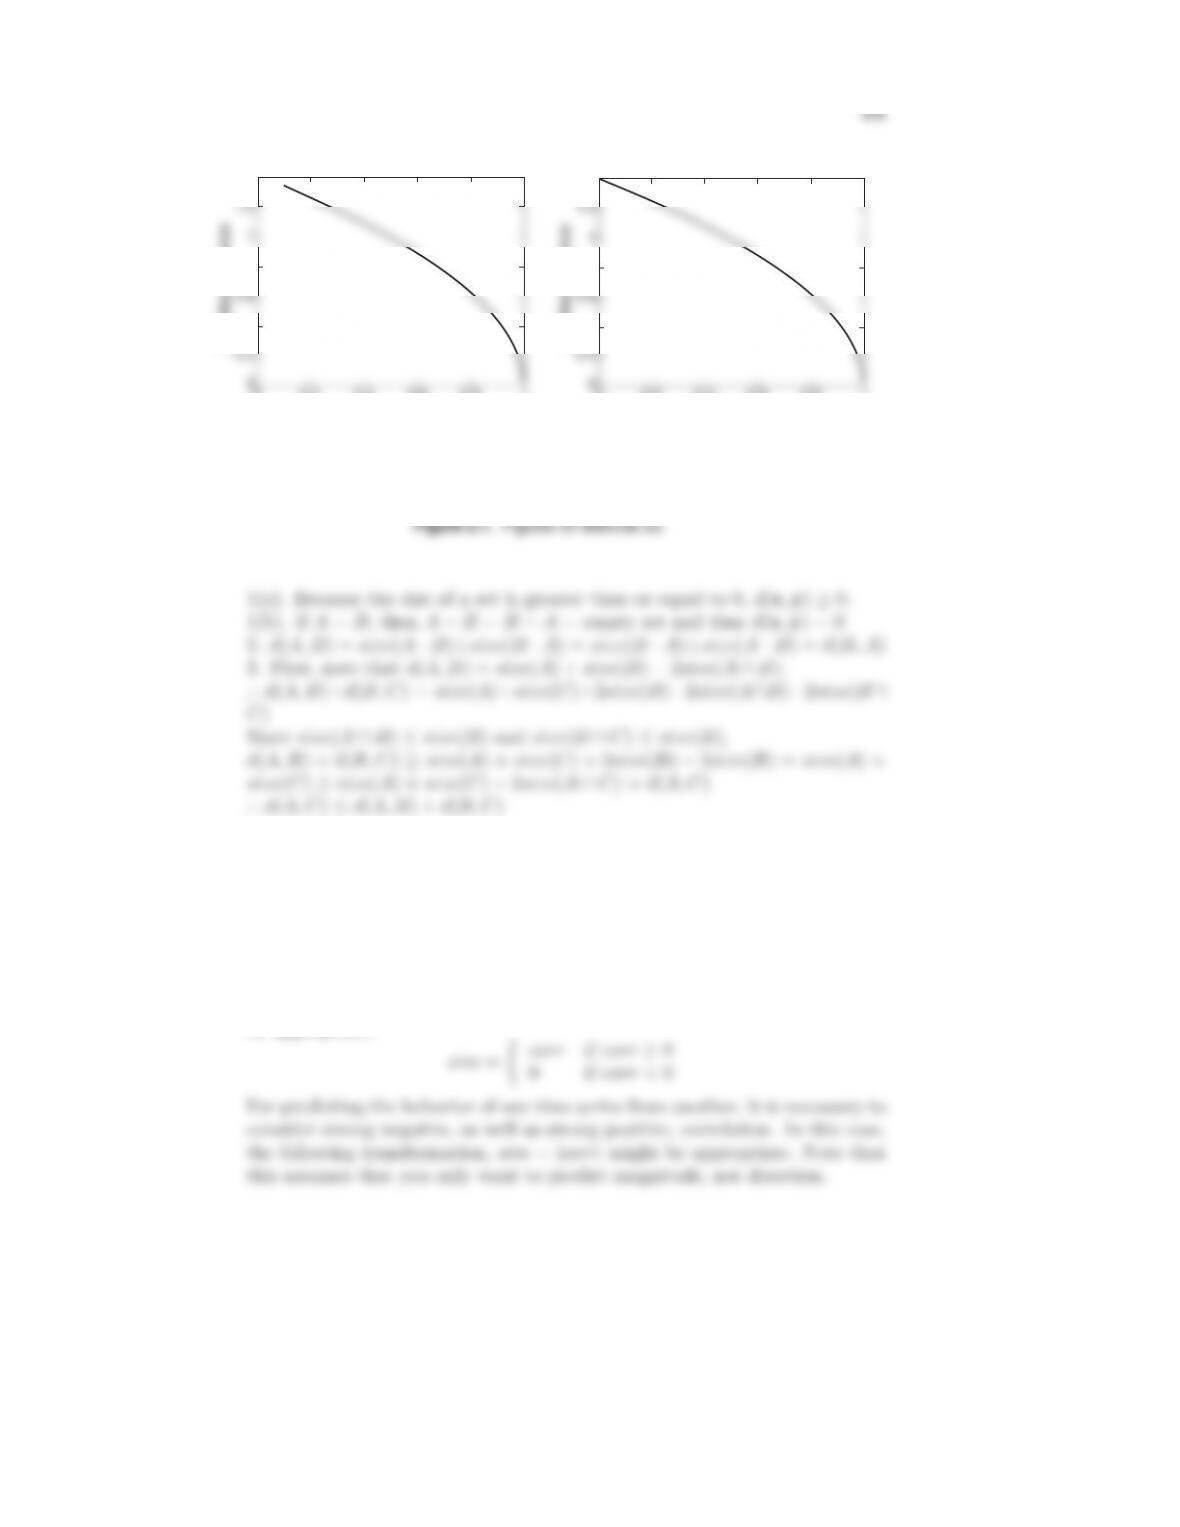
(d) Figure 2.1(a) shows the relationship of the cosine measure to Euclidean
distance for 100,000 randomly generated points that have been normal-
ized to have an L2 length of 1. What general observation can you make
about the relationship between Euclidean distance and cosine similarity
when vectors have an L2 norm of 1?
Since all the 100,000 points fall on the curve, there is a functional rela-
tionship between Euclidean distance and cosine similarity for normal-
(e) Figure 2.1(b) shows the relationship of correlation to Euclidean distance
for 100,000 randomly generated points that have been standardized
to have a mean of 0 and a standard deviation of 1. What general
observation can you make about the relationship between Euclidean
distance and correlation when the vectors have been standardized to
have a mean of 0 and a standard deviation of 1?
14 Chapter 2 Data
(f) Derive the mathematical relationship between cosine similarity and Eu-
clideandistancewheneachdataobjecthasanL
2length of 1.
Let xand ybe two vectors where each vector has an L2length of 1.
For such vectors, the variance is just ntimes the sum of its squared
attribute values and the correlation between the two vectors is their
dot product divided by n.
n
(g) Derive the mathematical relationship between correlation and Euclidean
distance when each data point has been been standardized by subtract-
ing its mean and dividing by its standard deviation.
Let xand ybe two vectors where each vector has an a mean of 0
and a standard deviation of 1. For such vectors, the variance (standard
deviation squared) is just ntimes the sum of its squared attribute values
and the correlation between the two vectors is their dot product divided
by n.
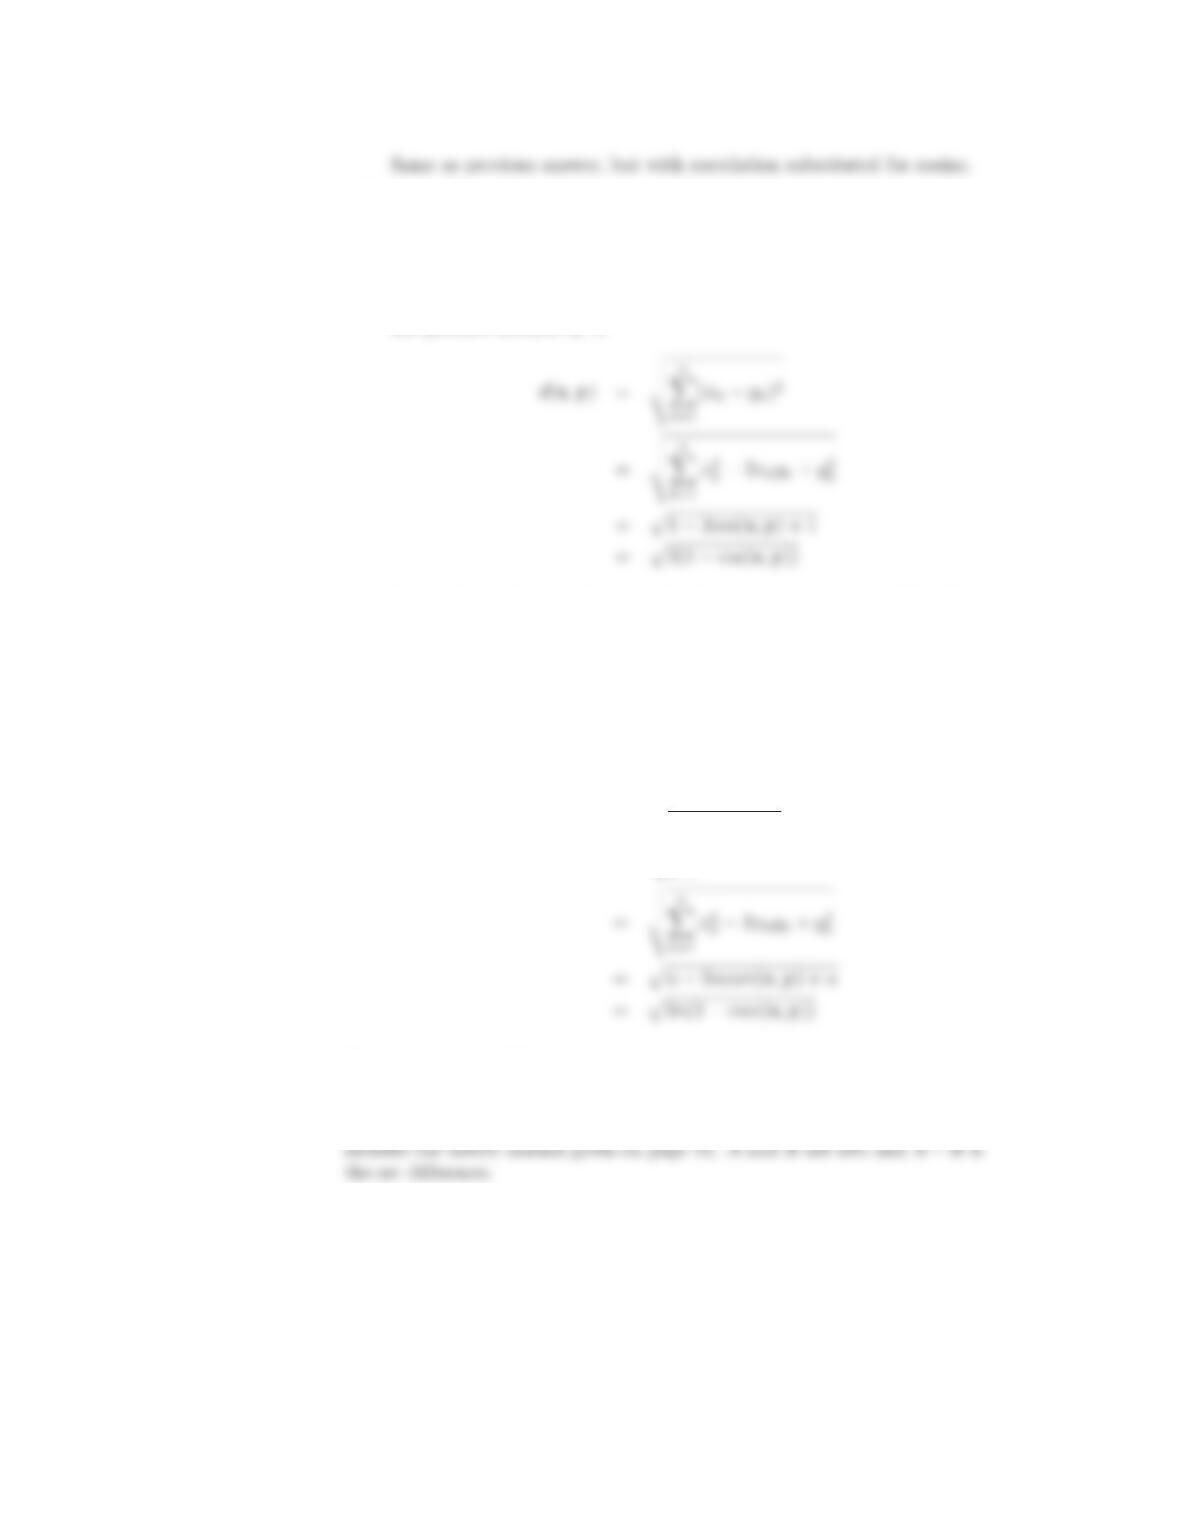
d(x,y)=
n
k=1
(xk−yk)2
n
21. Show that the set difference metric given by
d(A, B)=size(A−B)+size(B−A)
0 0.2 0.4 0.6 0.8 1
Cosine Similarity
1.4
0.8
0.4
Euclidean Distance
(a) Relationship between Euclidean
distance and the cosine measure.
0 0.2 0.4 0.6 0.8 1
Correlation
1.4
0.8
0.4
Euclidean Distance
(b) Relationship between Euclidean
distance and correlation.
22. Discuss how you might map correlation values from the interval [−1,1] to the
interval [0,1]. Note that the type of transformation that you use might depend
on the application that you have in mind. Thus, consider two applications:
clustering time series and predicting the behavior of one time series given
another.
For time series clustering, time series with relatively high positive correlation
should be put together. For this purpose, the following transformation would
be appropriate:

16 Chapter 2 Data
23. Given a similarity measure with values in the interval [0,1] describe two ways
to transform this similarity value into a dissimilarity value in the interval
[0,∞].
24. Proximity is typically defined between a pair of objects.
(a) Define two ways in which you might define the proximity among a group
of objects.
(b) How might you define the distance between two sets of points in Eu-
clidean space?
(c) How might you define the proximity between two sets of data objects?
(Make no assumption about the data objects, except that a proximity
measure is defined between any pair of objects.)
Note that the cohesion of a cluster is related to the notion of the proximity
of a group of objects among themselves and that the separation of clusters
25. You are given a set of points Sin Euclidean space, as well as the distance of
each point in Stoapointx. (It does not matter if x∈S.)
(a) If the goal is to find all points within a specified distance εof point y,
y=x, explain how you could use the triangle inequality and the al-
ready calculated distances to xto potentially reduce the number of dis-
tance calculations necessary? Hint: The triangle inequality, d(x,z)≤
d(x,y)+d(y,x), can be rewritten as d(x,y)≥d(x,z)−d(y,z).

17
(b) In general, how would the distance between xand yaffect the number
of distance calculations?
(c) Suppose that you can find a small subset of points S
, from the original
data set, such that every point in the data set is within a specified
distance εof at least one of the points in S
, and that you also have
the pairwise distance matrix for S
. Describe a technique that uses this
information to compute, with a minimum of distance calculations, the
set of all points within a distance of βof a specified point from the data
set.
Let xand ybe the two points and let x∗and y∗be the points in S
that are closest to the two points, respectively. If d(x∗,y∗)+2≤β,
26. Show that 1 minus the Jaccard similarity is a distance measure between two
data objects, xand y, that satisfies the metric axioms given on page 70.
Specifically, d(x,y)=1−J(x,y).
1(a). Because J(x,y)≤1,d(x,y)≥0.
1(b). Because J(x,x)=1,d(x,x)=0

18 Chapter 2 Data
27. Show that the distance measure defined as the angle between two data vec-
tors, xand y, satisfies the metric axioms given on page 70. Specifically,
d(x,y) = arccos(cos(x,y)).
Note that angles are in the range 0 to 180◦.
xand zmust be less than or equal to the sum of the angles between xand
28. Explain why computing the proximity between two attributes is often simpler
than computing the similarity between two objects.
In general, an object can be a record whose fields (attributes) are of different
types. To compute the overall similarity of two objects in this case, we need