
INSTRUCTOR’S MANUAL
TO ACCOMPANY
40th Anniversary Edition
DATABASE PROCESSING
Fundamentals, Design, and Implementation
15th Edition
Appendix J
Business Intelligence Systems
David M. Kroenke | David J. Auer | Scott L. Vandenberg | Robert C. Yoder
Appendix J – Business Intelligence Systems
Page J-2
❖ CHAPTER OBJECTIVES
• To learn the basic concepts of business intelligence (BI) systems
• To learn the basic concepts of data warehouses and data marts
❖ CHAPTER ERRATA
There are no known errors at this time. Any errors that are discovered in the future will
❖ TEACHING SUGGESTIONS
• Explain to your students that business intelligence (BI) systems already have an
important role in business operations, and the importance of this role should only
increase over time. If you know of any local examples, use them to illustrate your
point.
• Ask the students to think about ways in which data can be made more useful to
decision makers. How can data be made more relevant? Think about a continuum
of ways that data can be brought closer—downloading, data warehouses, etc.
• Many firms refer to their data or their information system as a data warehouse.
Discuss the integration required to be considered a warehouse then explain why
other databases would not be considered warehouses.
Appendix J – Business Intelligence Systems
• There are many freely-available real-world data sets that students can download and
experiment with using data mining/business intelligence applications. Organizations
providing such datasets include University of California-Irvine, Kaggle, the Pew
Research Center, the US Government (catalog.data.gov), kdnuggets, and r-dir.
❖ ANSWERS TO REVIEW QUESTIONS
J.1 What are BI systems?
Business Intelligence (BI) systems are information systems that assist managers and other
J.2 How do BI systems differ from transaction processing systems?
BI systems differ from transaction processing systems in that they do not support normal
J.3 Name and describe the two main categories of BI systems.
The two main categories of BI systems are: (1) reporting and (2) data mining. Reporting involves
J.4 What are the three sources of data for BI systems?
BI systems obtain data in three ways:
(1) Data from operational databases – BI systems read and process operational
DBMS data, but do not insert, modify, or delete the data.
J.5 Summarize the problems with operational databases that inhibit their usefulness for BI
applications.
The problems that inhibit the usefulness of operational databases for BI applications are:
(1) Dirty data
Appendix J – Business Intelligence Systems
Page J-4
(2) Missing values
J.6 What is an ETL system, and what functions does it perform?
An Extract, Transform, and Load (ETL) system is the system used to read data from
J.7 What problems in operational data create the need to clean data before loading the data
into a data warehouse?
Operational data often cannot be directly loaded into BI applications—the data may be
problematic. Some of the problems of using operational data for BI processing include:
• “Dirty data” (for example, problematic data such as value of “G” for customer gender, a
value of “213” for customer age, a value of “999-999-9999” for a U.S. phone number, or a
part color of “gren”).
J.8 What does it mean to transform data? Give an example other than the ones used in this
book.
Data may need to be changed or transformed for use in a data warehouse. For example, the
J.9 Why are data warehouses necessary?
Appendix J – Business Intelligence Systems
Page J-5
J.10 Give examples of data warehouse metadata.
Data warehouse metadata includes data source, data format, data assumptions, and constraints.
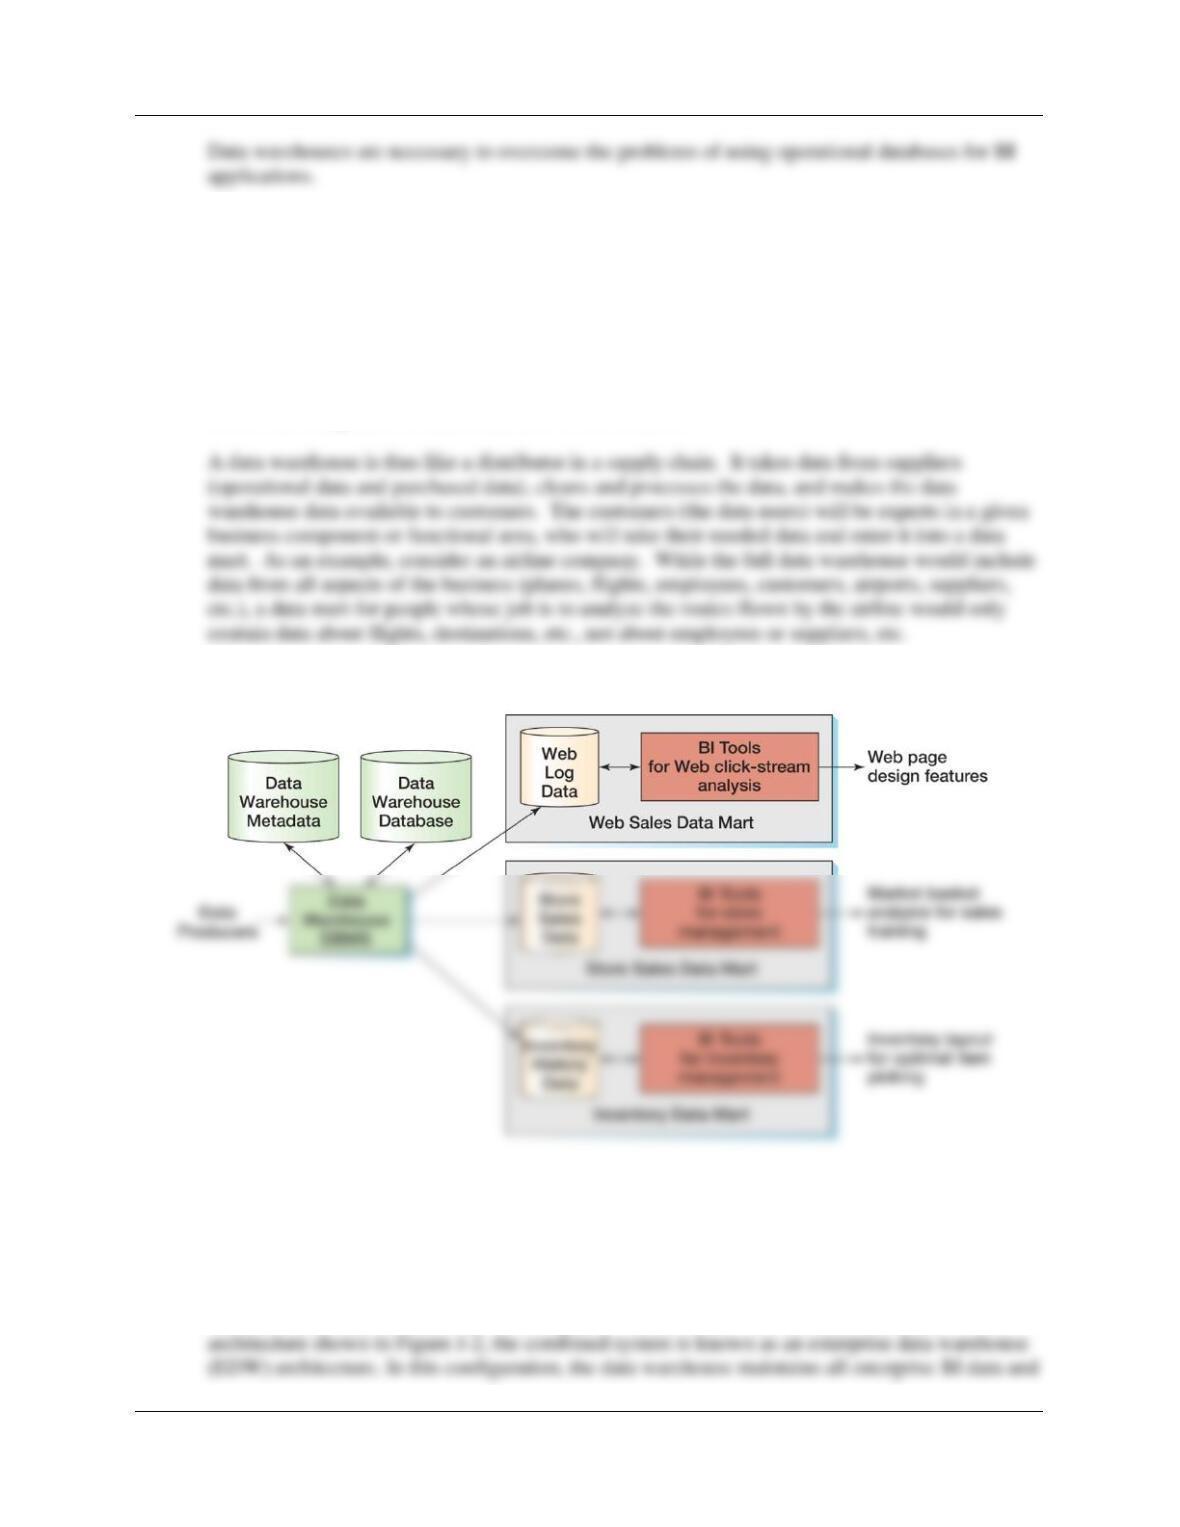
J.11 Explain the difference between a data warehouse and a data mart. Give an example
other than the ones used in this book.
A data warehouse stores data that reflect the entire business, whereas a data mart stores data that
reflect one component or functional area of the business.
Figure J-3 in the text reflects this pattern:
J.12 What is the enterprise data warehouse (EDW) architecture?
When the data mart structure shown in Figure J-3 is combined with the data warehouse
Appendix J – Business Intelligence Systems
Page J-6
J.13 State the purpose of a reporting system.
The purpose of a reporting system is: (1) to create meaningful information from various data
sources and (2) to deliver that information to the appropriate users in a timely manner.
J.14 In RFM analysis, what do the letters RFM stand for?
R = Recent – when was the customer’s most recent purchase
J.15 Describe, in general terms, how to perform an RFM Analysis.
To perform an RFM analysis:
(1) Sort the customer purchase records (CPRs) on the R basis into five groups, where each
group contains 20% of the CPRs. The ranked CPRs are each assigned an R score as
follows:
(2) Re-sort the customer purchase records (CPRs) on the F basis into five groups, where each
group contains 20% of the CPRs. The ranked CPRs are each assigned an F score as
follows:
(3) Re-sort the customer purchase records (CPRs) on the M basis into five groups, where
each group contains 20% of the CPRs. The ranked CPRs are each assigned an M score as
follows:
(4) Analyze the results (See question J.16 below)
Appendix J – Business Intelligence Systems
Page J-7
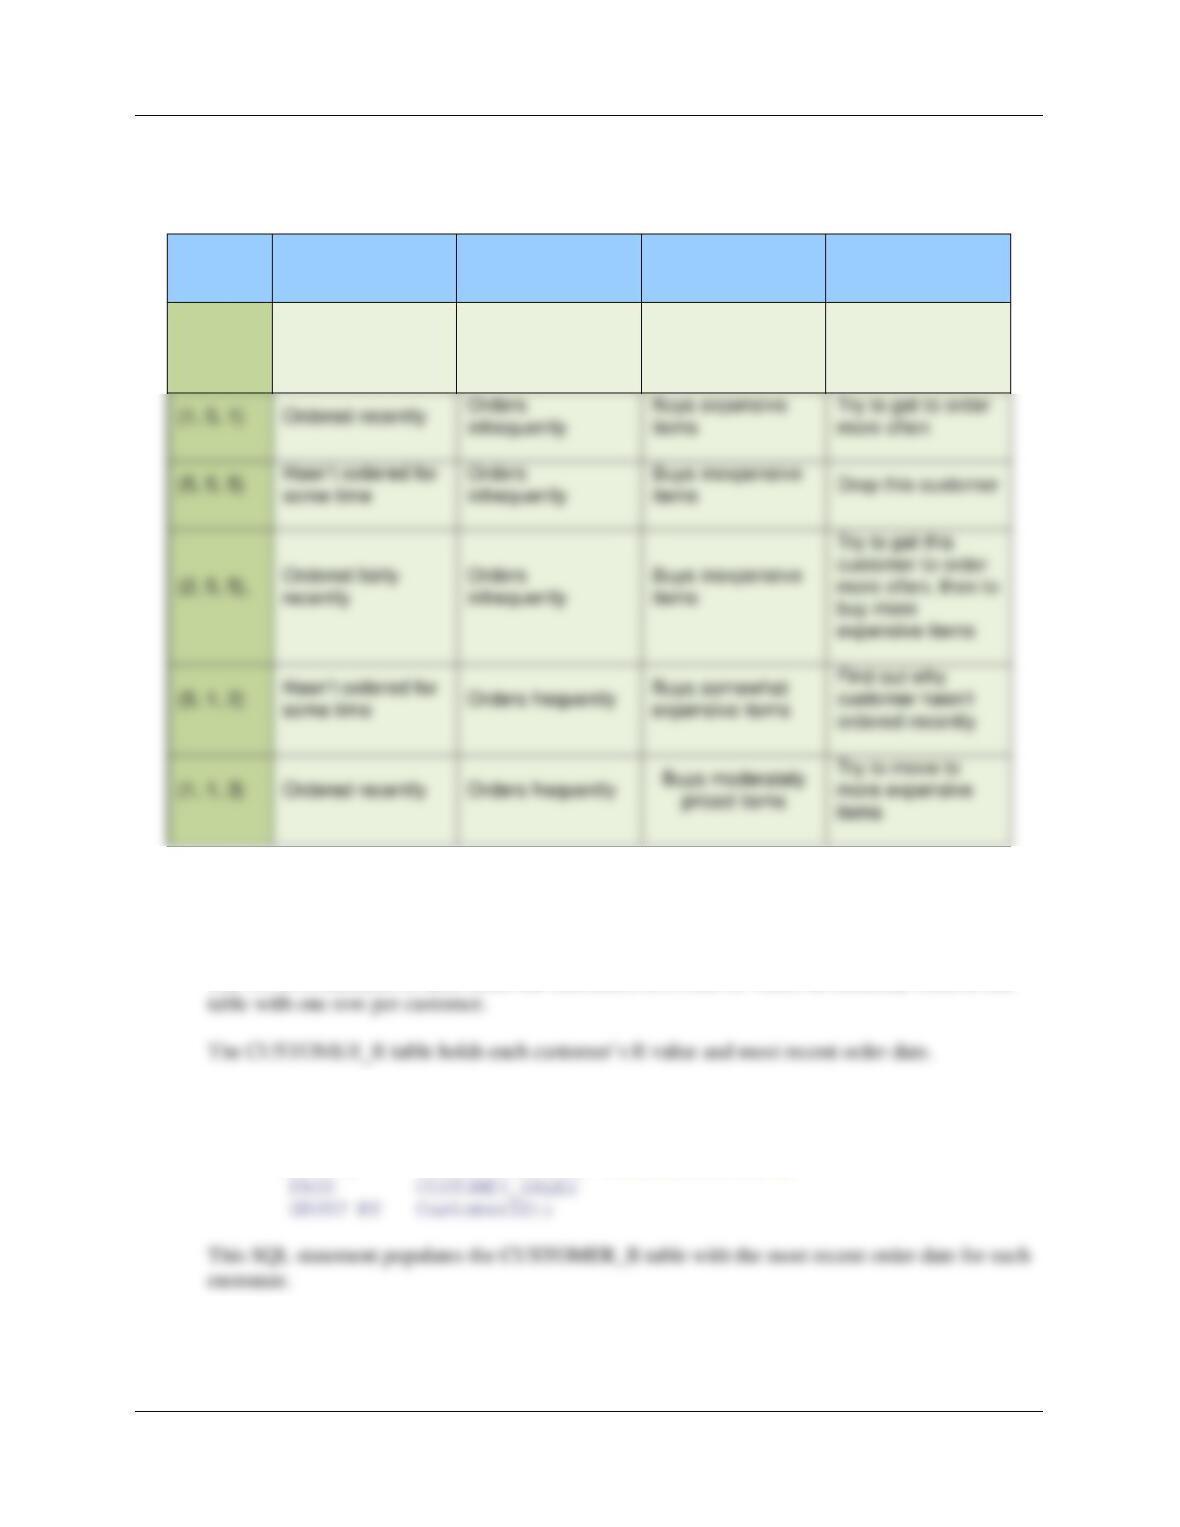
J.16 Explain the characteristics of customers that have the following RFM scores:
{1 1 5}, {1 5 1}, {5 5 5}, {2 5 5}, {5 1 2}, {1 1 3}.
RFM
SCORE
R
F
M
Comments
{1, 1, 5}
Ordered recently
Orders frequently
Buys inexpensive
items
Try to move to
more expensive
items
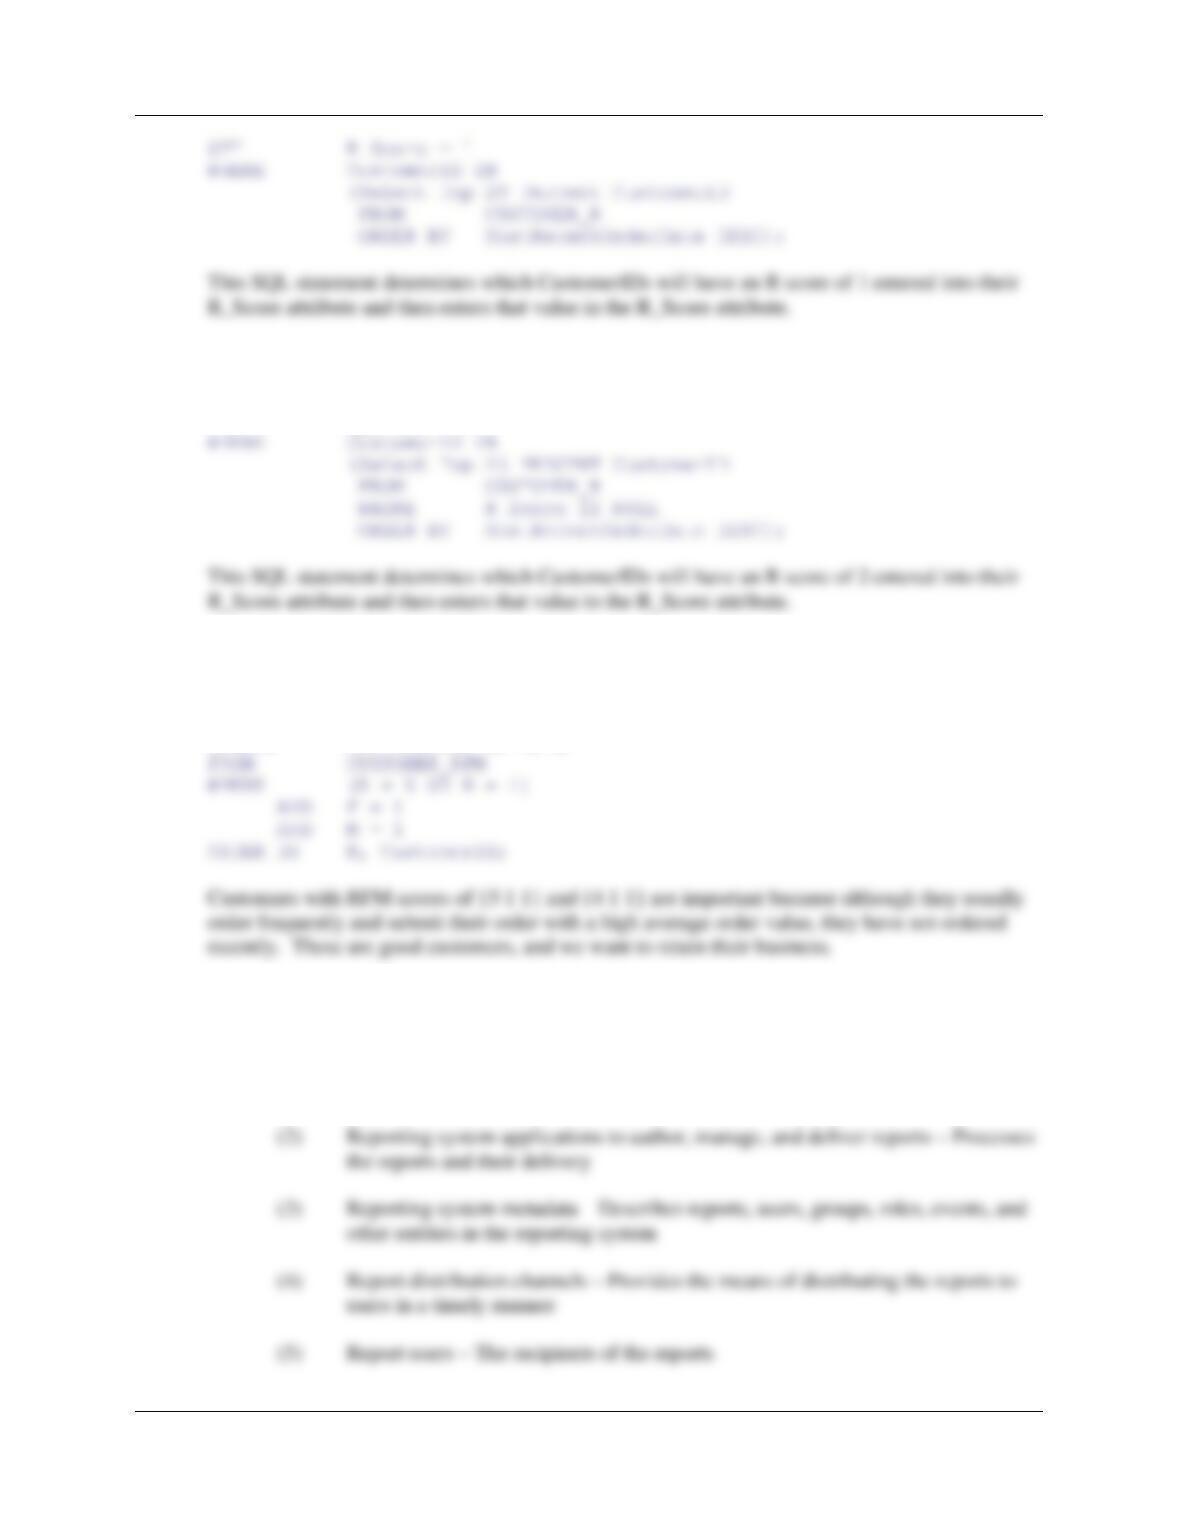
J.17 In the RFM analysis in Figures J-7 through J–10, what role does the CUSTOMER_RFM
table serve? What role does the CUSTOMER_R table serve?
The CUSTOMER_RFM table holds the calculated R, F, and M values in summary form in one
J.18 Explain the purpose of the following SQL statement from Figure J-9:
INSERT INTO CUSTOMER_R (CustomerID, MostRecentOrderDate)
(SELECT CustomerID, Max (TransactionDate)
J.19 Explain the purpose and operation of the following SQL statement from Figure J-9:
UPDATE CUSTOMER_R
Orders
infrequently
Buys expensive
items
Try to get to order
more often
some time
infrequently
items
{2, 5, 5},
recently
infrequently
items
more often, then to
buy more
expensive items
{5, 1, 2}
Orders frequently
ordered recently
Appendix J – Business Intelligence Systems
Page J-8
J.20 Explain the purpose and operation of the following SQL statement from Figure J-9:
UPDATE CUSTOMER_R
SET R_Score = 2
J.21 Write an SQL statement to query the CUSTOMER_RFM table and display the
CustomerID values for all customers having an RFM score of {5 1 1} or {4 1 1}. Why are
these customers important?
SELECT CustomerID, R, F, M
J.22 Name and describe the purpose of the major components of a reporting system.
The major components of a reporting system are:
(1) Report data sources – Provide the data to the data systems
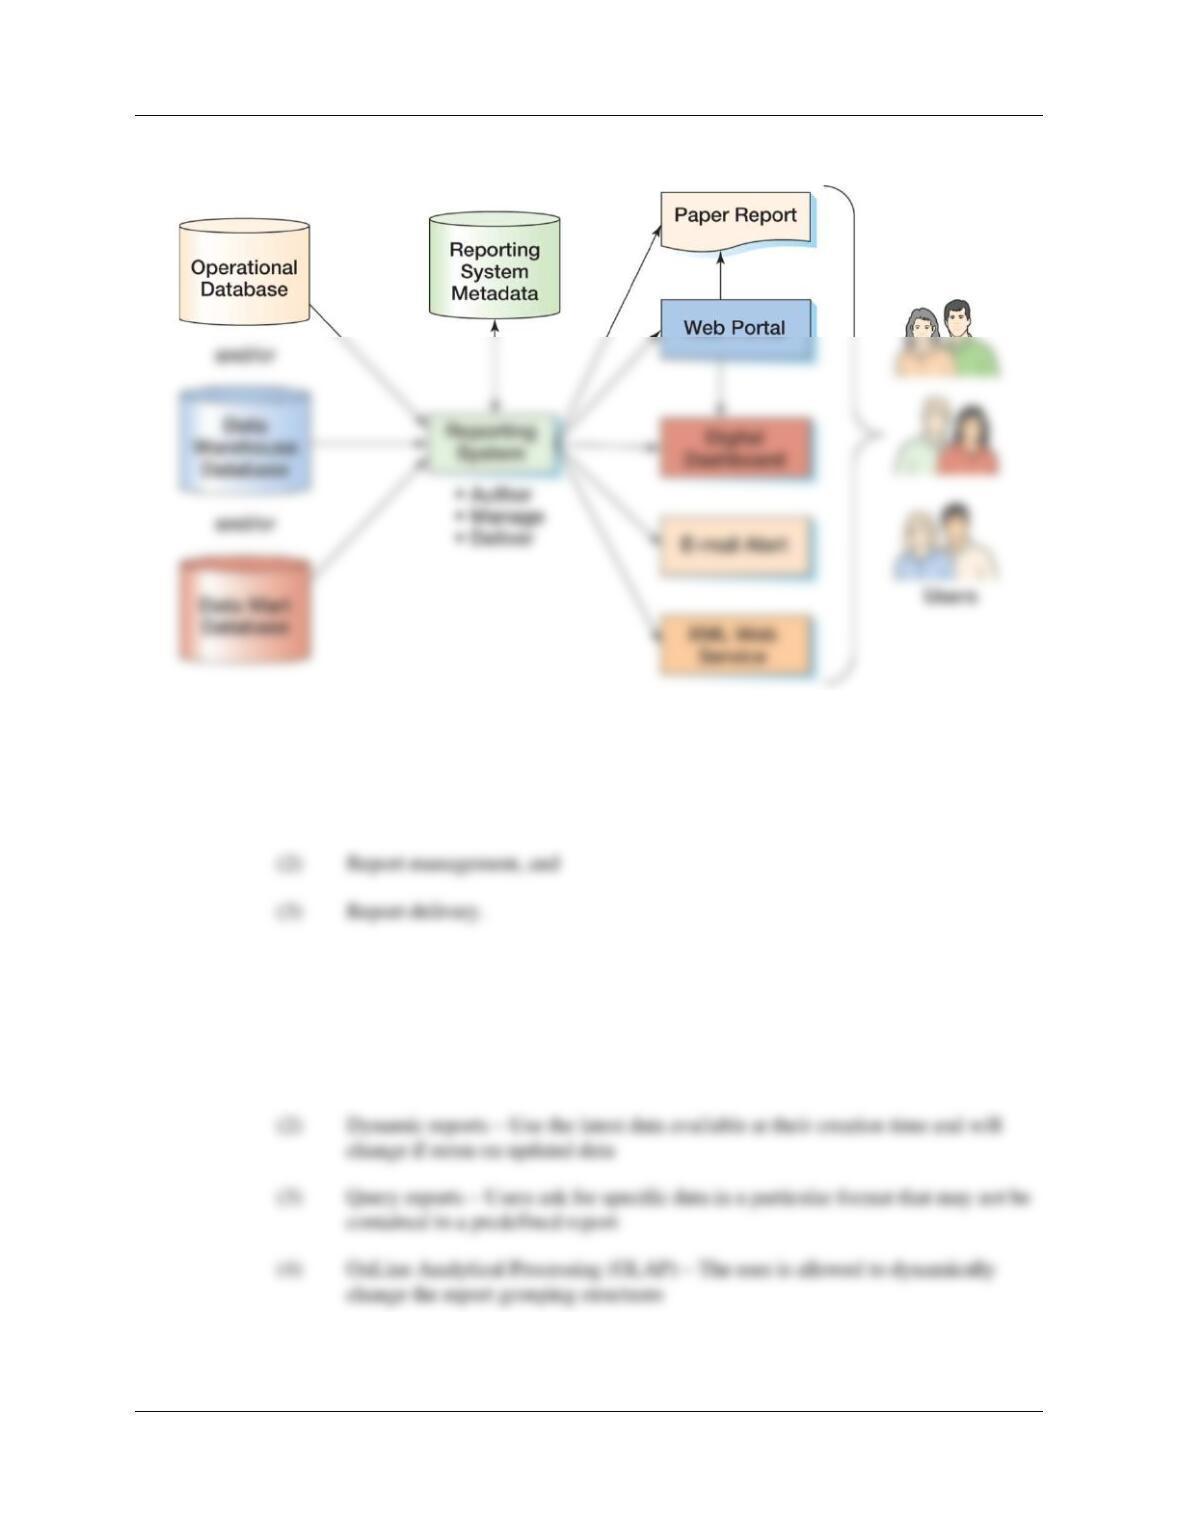
Appendix J – Business Intelligence Systems
Page J-9
These are illustrated in Figure J-11 in the text:
J.23 What are the major functions of a reporting system?
The major functions of a reporting system are:
(1) Report authoring,
J.24 Summarize the types of reports described in this appendix.
There are four types of reports:
(1) Static reports – Are prepared once from available data at a given time and do not
change
J.25 Describe the various media used to deliver reports.
Appendix J – Business Intelligence Systems
There are five media for reports:
(1) Paper – Printed reports
J.26 Summarize the modes of reports described in this chapter.
There are two modes for reports:
(1) Push – The report is delivered to the user on a predetermined schedule.
J.27 Describe the major tasks in report management. Explain the role of report metadata in
report management.
The major tasks of report management are defining who receives what reports, when, how (report
media), and by what means (report mode).
Report metadata would be used to store:
(1) User accounts.
J.28 Name three tasks of report authoring.
The three tasks of report authoring are:
(1) Connecting to the required data sources,
J.29 Describe the major tasks in report delivery.
Report delivery has these major tasks:
(1) Pushing reports or allowing report pulling based on report system metadata
Appendix J – Business Intelligence Systems
Page J-11
(2) Delivering reports via appropriate media
J.30 What does OLAP stand for?
OLAP stands for Online Analytical Processing.
J.31 Define data mining.
Data mining is the use of mathematical and statistical techniques to find patterns and relationships
J.32 Explain the difference between unsupervised and supervised data mining.
In unsupervised data mining, data mining techniques are applied to data before any
explanations, models, or hypotheses are developed about the relationships in the data.
J.33 Name five popular data mining techniques.
Five popular data mining techniques are cluster analysis, market basket analysis, decision trees,
logistic regression, and neural networks.
❖ ANSWERS TO EXERCISES
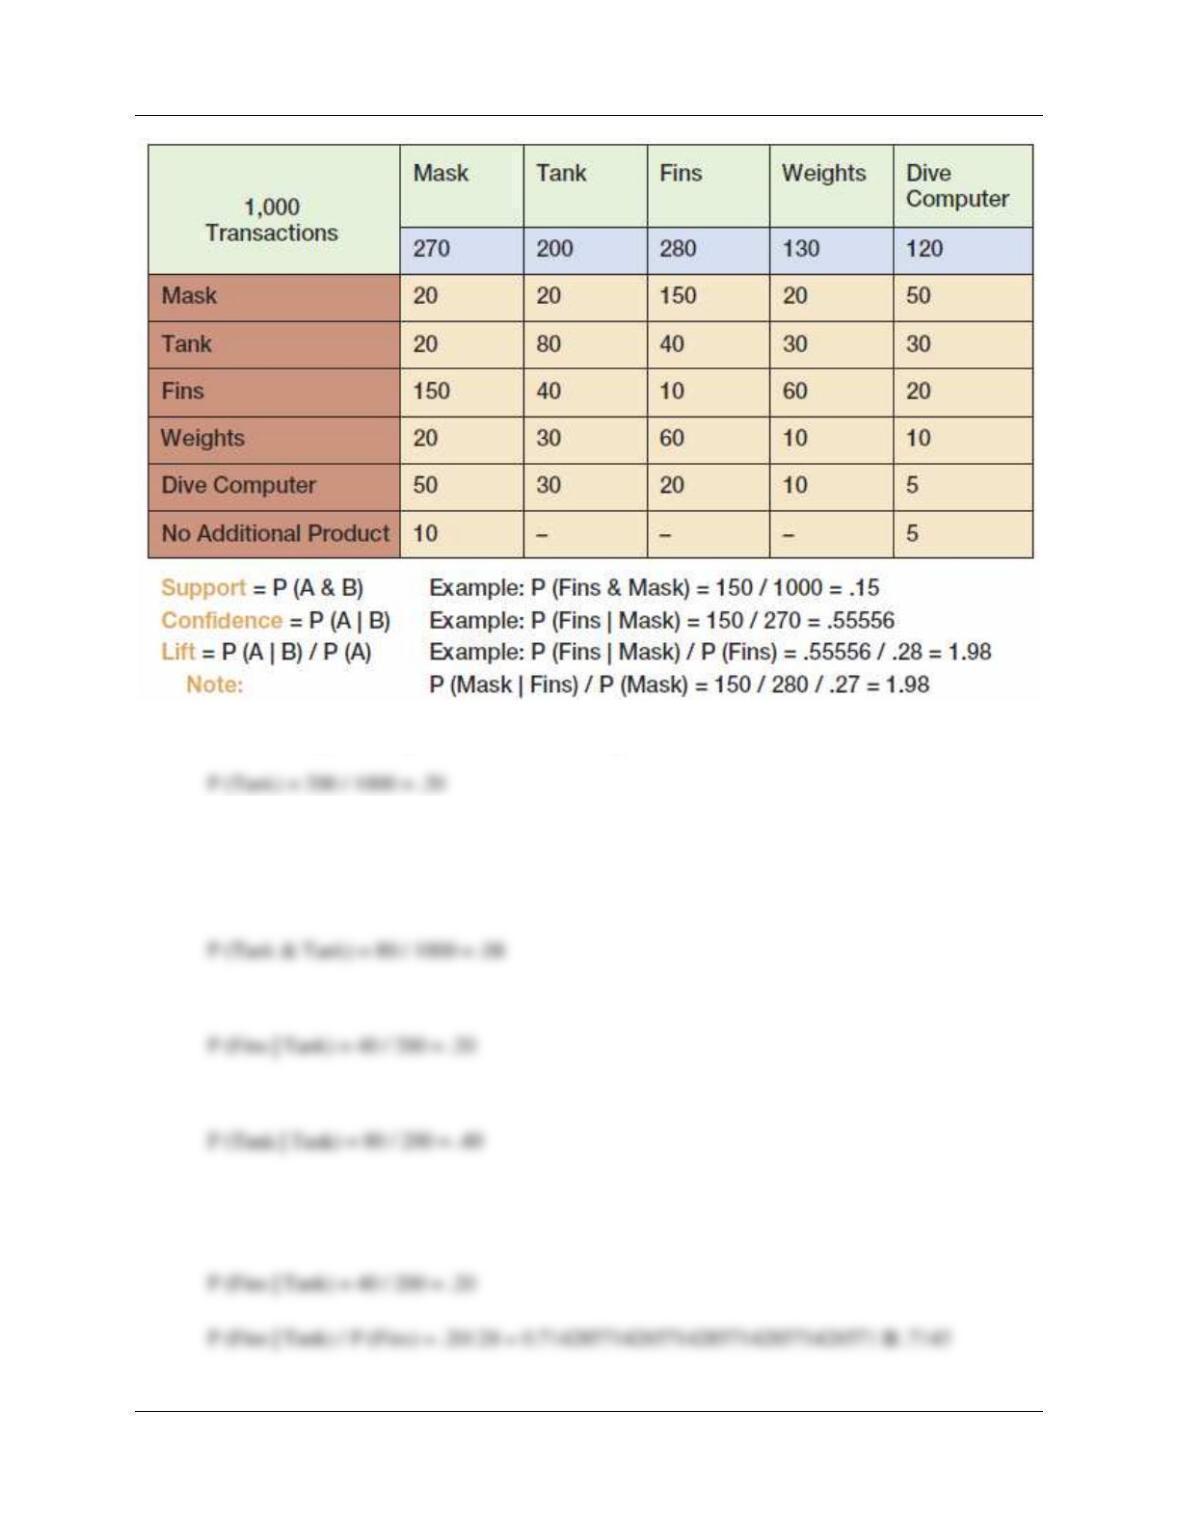
Use the data in Figure J-18 to answer questions J.34 through J.40:
Appendix J – Business Intelligence Systems
Page J-12
J.34 What is the probability that someone will buy a tank?
J.35 What is the support for buying a tank and fins? What is the support for buying two
tanks?
P (Tank & Fins) = 40 /1000 = .04
J.36 What is the confidence for fins, given that a tank has been purchased?
J.37 What is the confidence for a second tank, given that a tank has been purchased?
J.38 What is the lift for fins, given that a tank has been purchased?
P (Fins) = 280 / 1000 = .28
Appendix J – Business Intelligence Systems
Page J-13
J.39 What is the lift for a second tank, given that a tank has been purchased?
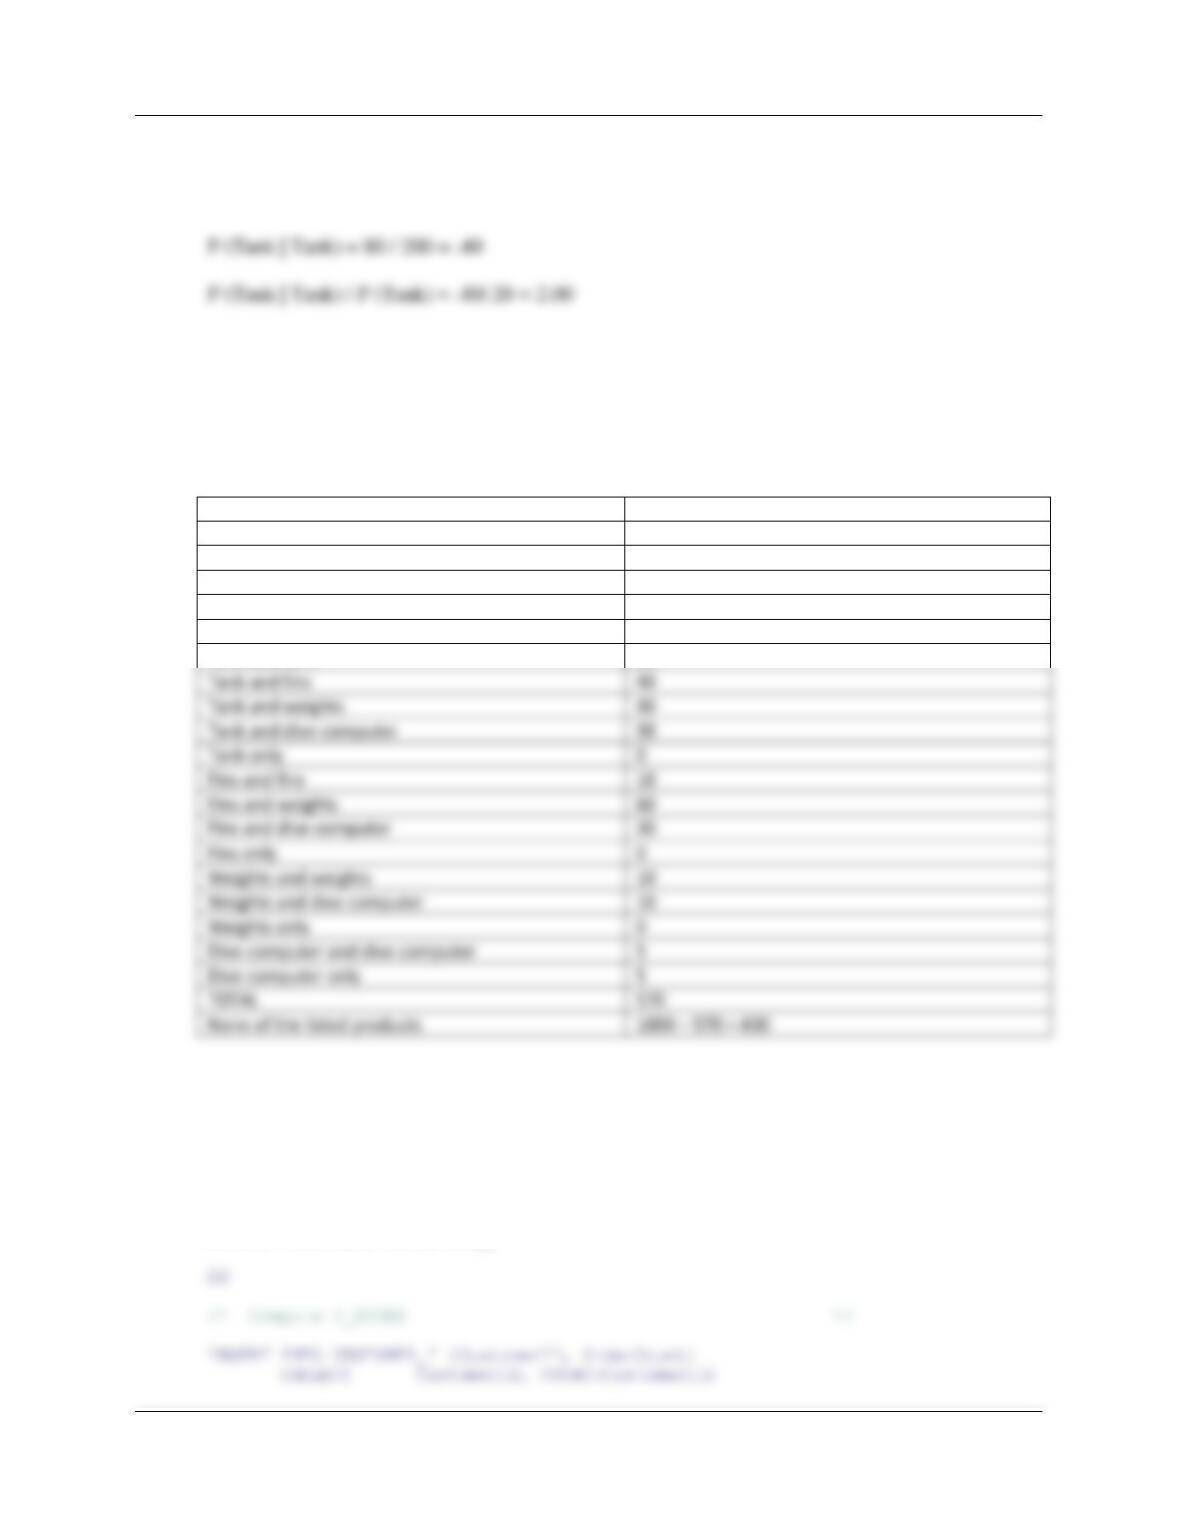
P (Tank) = 200 / 1000 = .20
J.40 How many transactions are there (among the 1,000) that involve none of the five
products mentioned in the table (mask, fins, tanks, dive computer, and weights)?
430. Since we know that every transaction includes 1 or 2 items total, we can enumerate all the
possible combinations of items in a transaction (remember that “mask and tank” is the same as
“tank and mask”, etc.):
Mask and mask
20
Mask and tank
20
Mask and fins
150
Mask and weights
20
Mask and dive computer
50
Mask only
10
Tank and tank
80
Tank and fins
40
Tank and weights
30
Tank and dive computer
30
Tank only
0
Fins and fins
10
Fins and weights
60
Fins and dive computer
20
Fins only
0
Weights and weights
10
Weights and dive computer
10
Weights only
0
Dive computer and dive computer
5
Dive computer only
5
TOTAL
570
None of the listed products
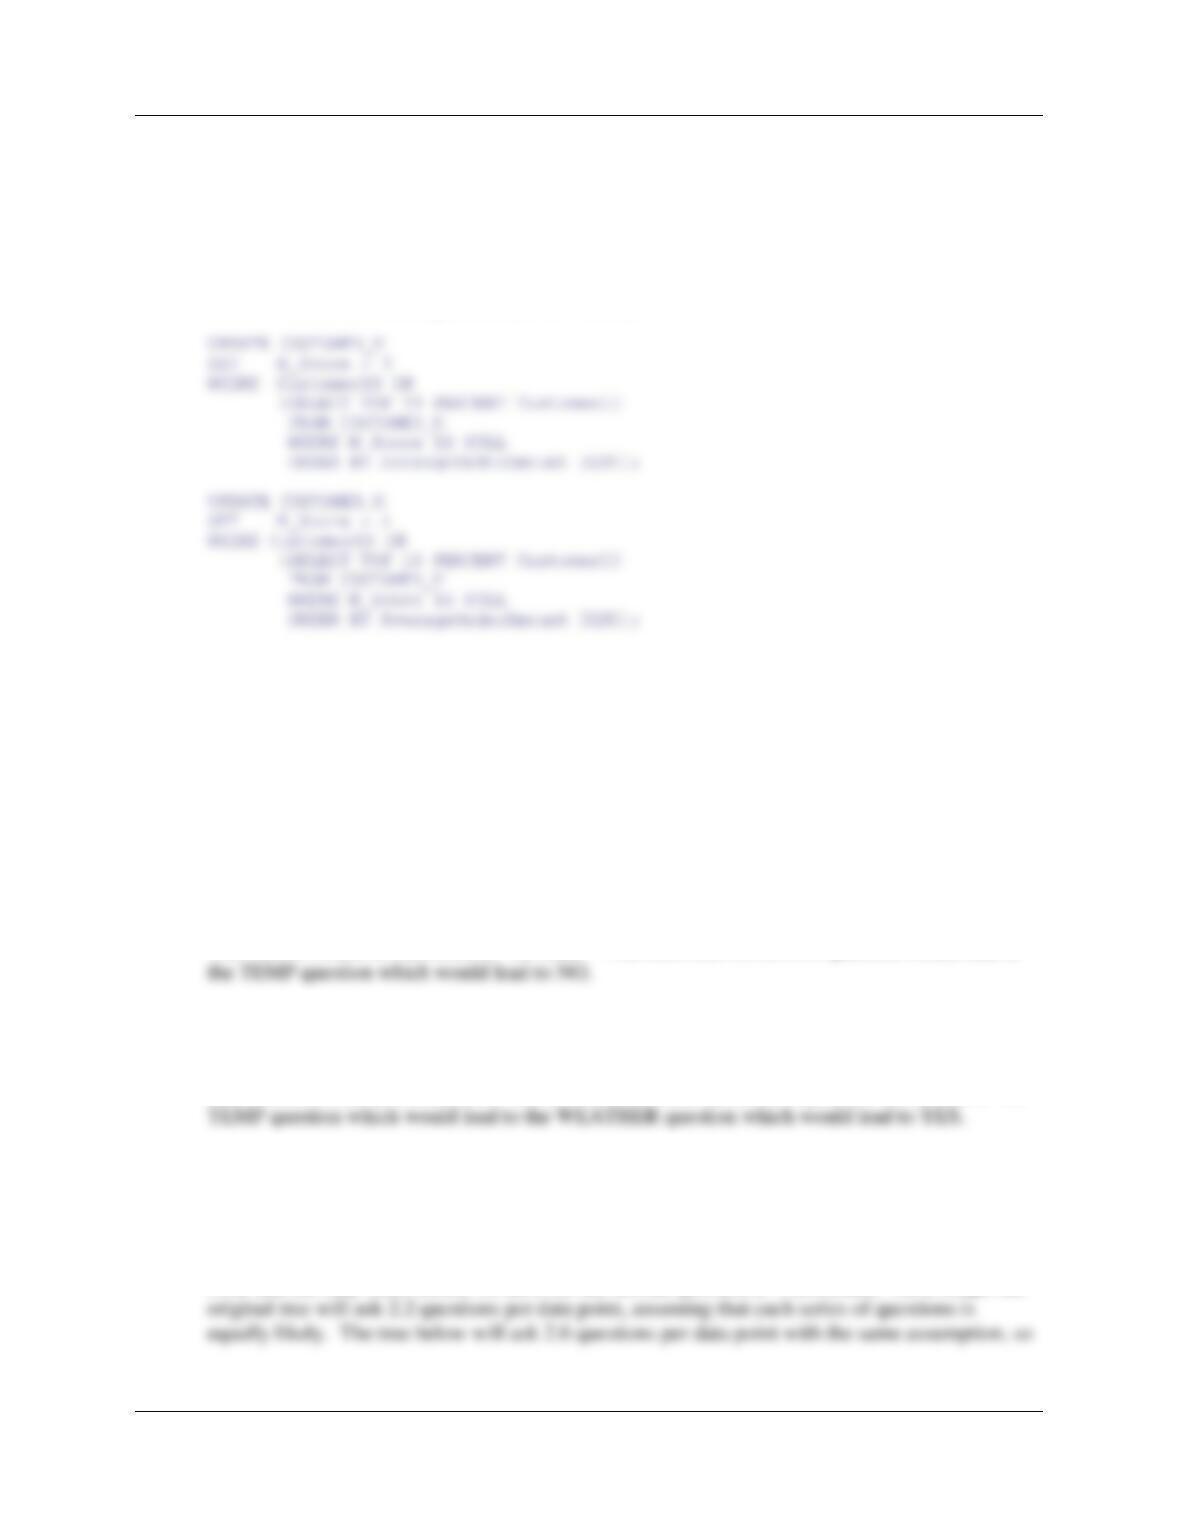
J.41 Using the code in Figure J-9 as an example, write the procedures Calculate_F and
Calculate_M that are called from the Calculate_RFM stored procedure in Figure J-8.
These solutions are also in the file DBP-e15-RFM-Create-Stored-Procedures.sql available in the
Instructors Resource Center.
CREATE PROCEDURE Calculate_F

Appendix J – Business Intelligence Systems
Page J-14
UPDATE CUSTOMER_F
SET F_Score = 3
WHERE CustomerID IN
(SELECT TOP 33 PERCENT CustomerID
FROM CUSTOMER_F
WHERE F_Score IS NULL
ORDER BY OrderCount DESC);
UPDATE CUSTOMER_F
SET F_Score = 4
WHERE CustomerID IN
(SELECT TOP 50 PERCENT CustomerID
FROM CUSTOMER_F
WHERE F_Score IS NULL
ORDER BY OrderCount DESC);
CREATE PROCEDURE Calculate_M
AS
/* Compute M_SCORE */
Appendix J – Business Intelligence Systems
Page J-15
ORDER BY AverageOrderAmount DESC);
UPDATE CUSTOMER_M
SET M_Score = 2
WHERE CustomerID IN
(SELECT TOP 25 PERCENT CustomerID
FROM CUSTOMER_M
WHERE M_Score IS NULL
ORDER BY AverageOrderAmount DESC);
UPDATE CUSTOMER_M
SET M_Score = 5
WHERE CustomerID IN
(SELECT CustomerID
FROM CUSTOMER_M
WHERE M_Score IS NULL);
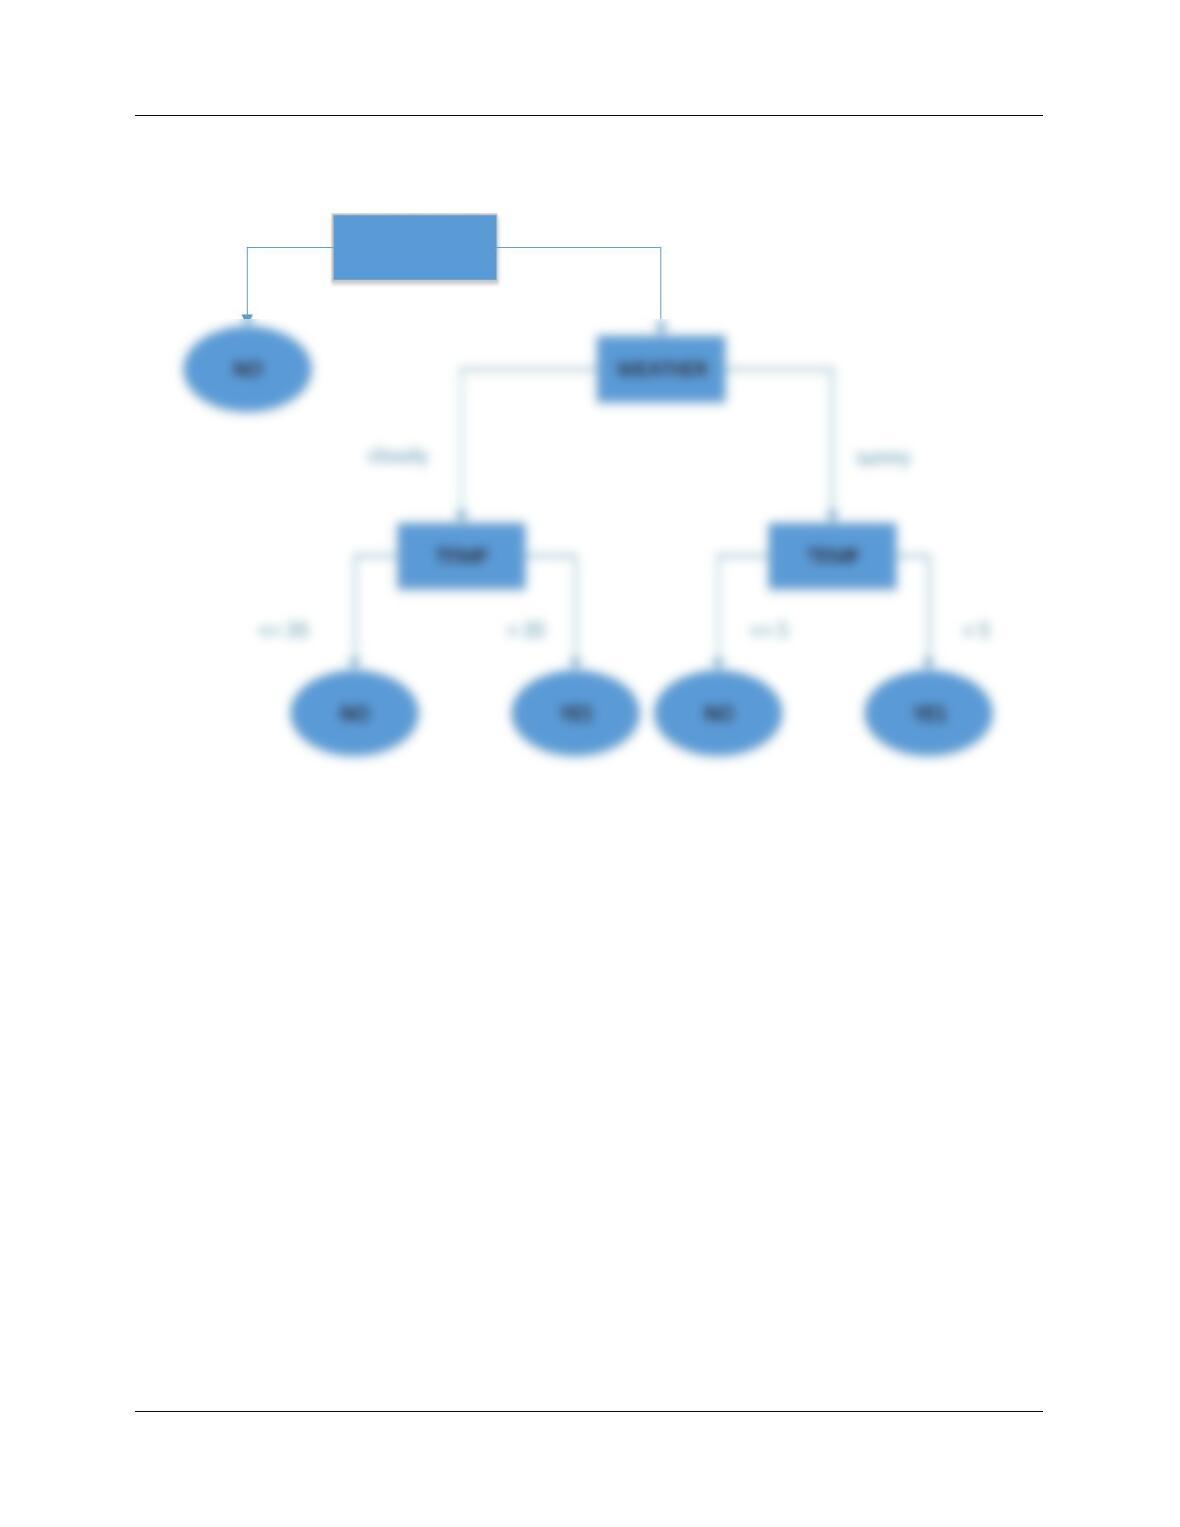
Use the decision tree in Figure J-22 to answer questions J.42 through J.44.
J.42 Would the new data point (record) (cloudy, –3, 16) be classified as “skate” or “no skate”?
Which nodes (questions) in the tree would be asked of this new record?
This record would be classified as “no skate”. The root ICEFISHDAYS question would lead to
J.43 Would the new data point (record) (sunny, 5, 22) be classified as “skate” or “no skate”?
Which nodes (questions) in the tree would be asked of this new record?
This record would be classified as “skate”. The root ICEFISHDAYS question would lead to the
J.44 Draw a different decision tree, based on the same data, by basing the second question
on a different attribute. Does your tree ask more or fewer questions, on average, to
categorize a new point when compared to the tree presented in the text? Does your tree
have higher or lower accuracies for its decisions
Note that the only other choice we have for the second question is WEATHER. On average, the
Appendix J – Business Intelligence Systems
Page J-16
in that sense it is a less efficient tree than the one in Figure J-22. The accuracy of the tree is the
same: in both trees, every point in our original list of 15 points will be classified correctly.
ICEFISHDAYS
>= 10< 10

Appendix J – Business Intelligence Systems
Page J-17
❖ ANSWERS TO MARCIA’S DRY CLEANING CASE QUESTIONS
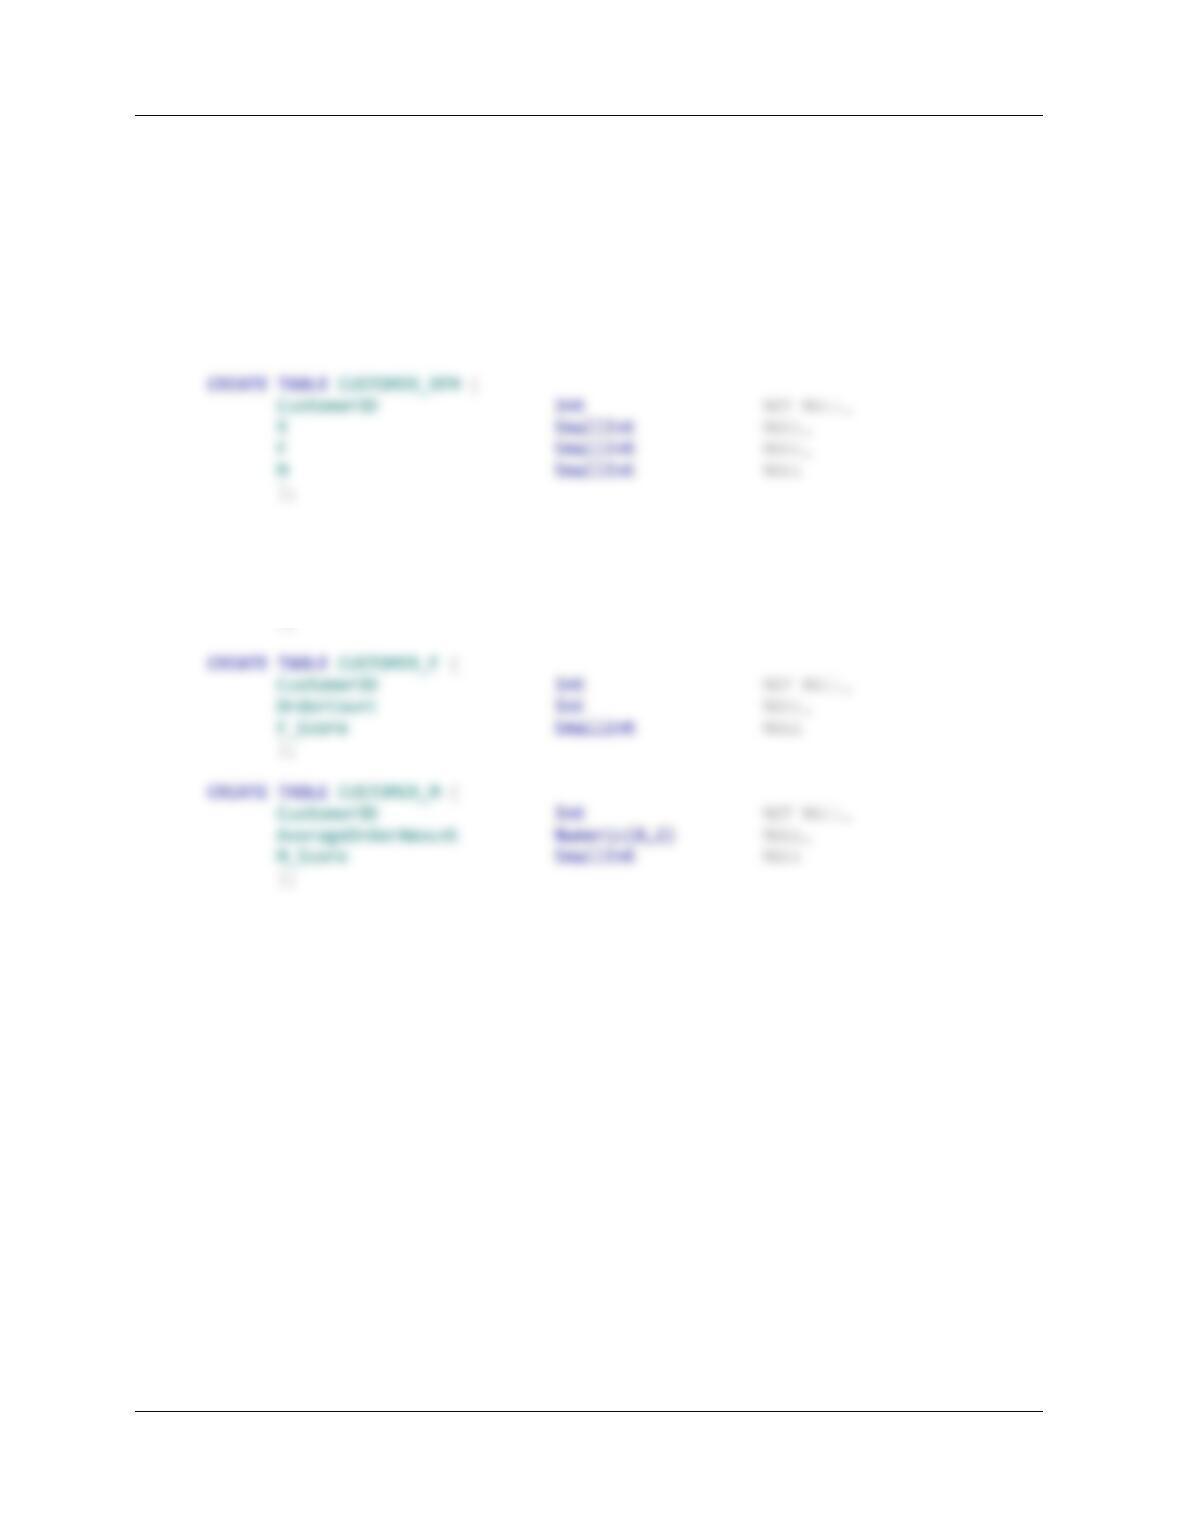
Assume that Marcia uses a database that includes the following three tables:
CUSTOMER (CustomerID, FirstName, LastName, Phone, EmailAddress)
(The SERVICE table, included above for completeness, is not needed for these exercises.)
Note: Create a new database named MDC_AppJ, and use the MDC-CH10A database scripts,
available on the book’s website, to create and populate the tables.
A. Describe how an RFM analysis could be useful in Marcia’s business.
RFM analysis is a tool for analyzing and ranking customers based on their purchasing patterns.
By running an RFM analysis at Marcia’s Dry Cleaning, we can learn who our best customers are
in terms of:
(1) Who our current customers (most recent) are,
Based on this information, we can target sales promotions to these customers.
Using the three number rankings, we can also determine such information as:
(1) Who has been a good customer in the past and should be contacted to restore
their use of our service, and
Appendix J – Business Intelligence Systems
Page J-18
B. Using five tables based on the tables in Figure J-7, write a set of stored procedures to
compute an RFM analysis on Marcia’s data.
Note that the CUSTOMER_SALES table in Figure J-7 is NOT needed. Instead, we will reference
the MDC INVOICE table for the data we need.
For MS SQL Server:
/***************** Create the RFM Tables **********************/
CREATE TABLE CUSTOMER_R (
CustomerID Int NOT NULL,
MostRecentOrderDate DateTime NULL,
R_Score SmallInt NULL
);
Appendix J – Business Intelligence Systems
Page J-19
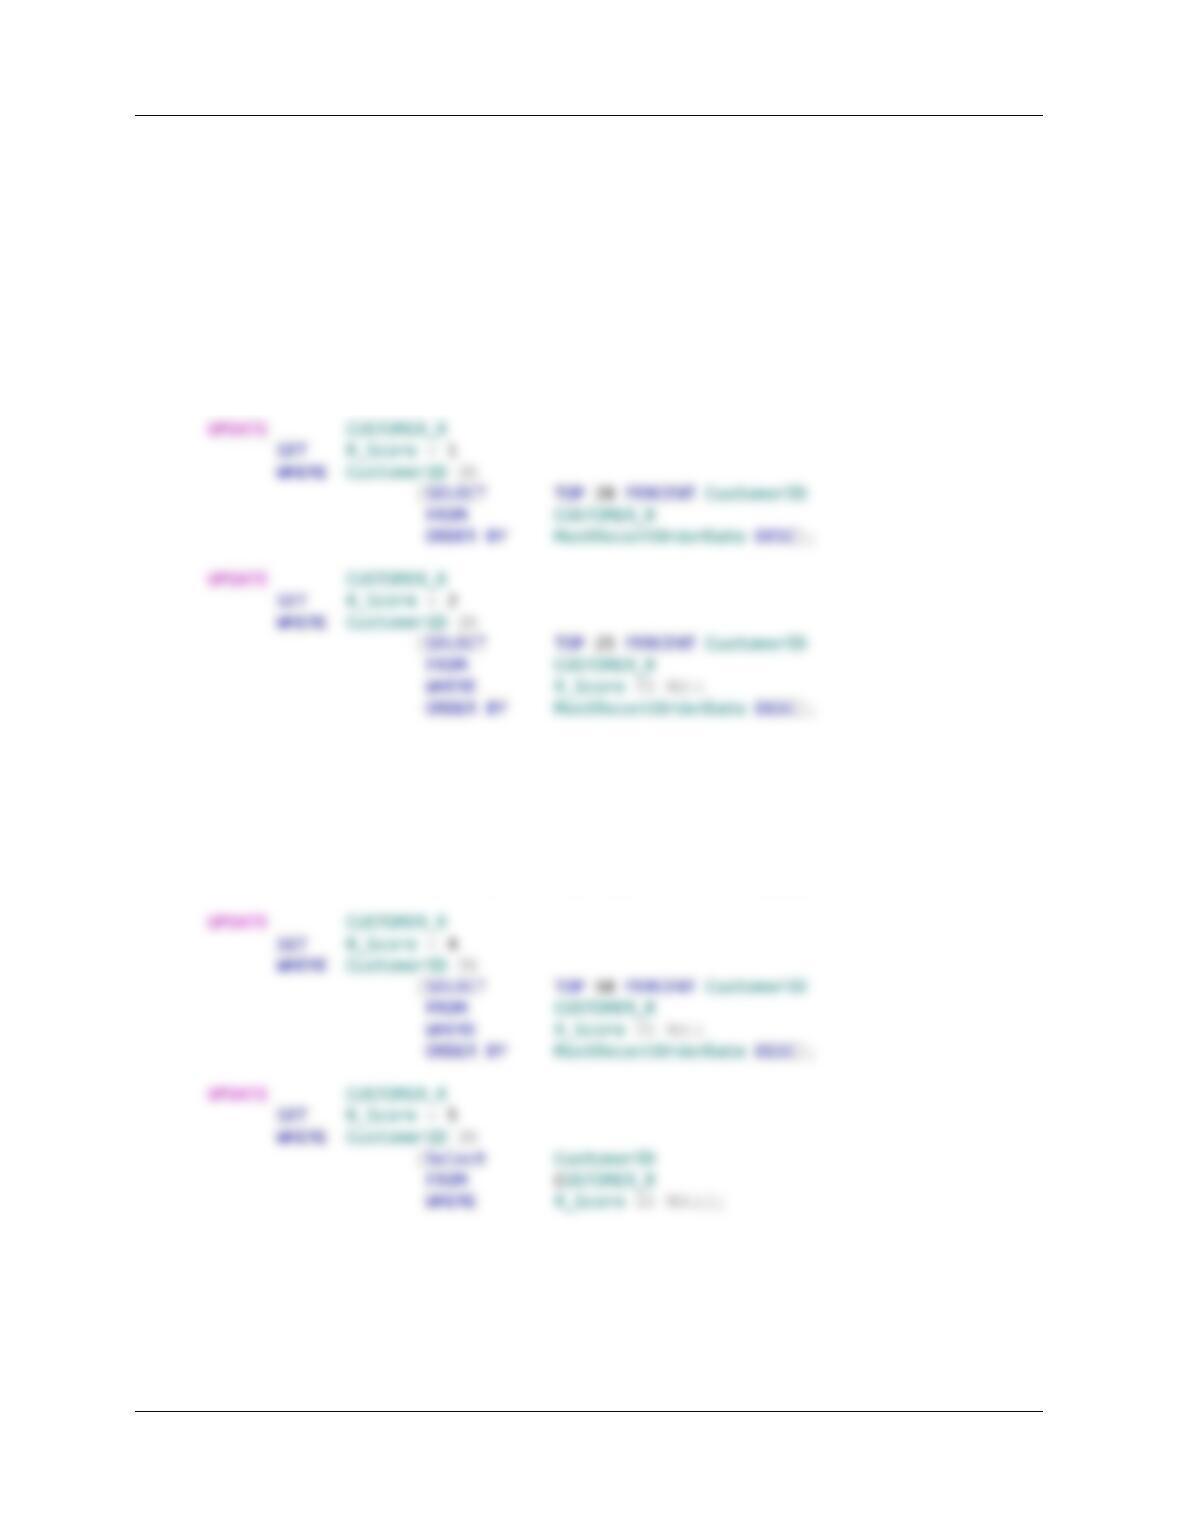
/***************** PROCEDURE Calculate_R **********************/
CREATE PROCEDURE Calculate_R
AS
/* *** Compute R_Score ************************************/
INSERT INTO CUSTOMER_R (CustomerID, MostRecentOrderDate)
(SELECT CustomerID, MAX (DateIn)
FROM INVOICE
GROUP BY CustomerID);
UPDATE CUSTOMER_R
SET R_Score = 3
WHERE CustomerID IN
(SELECT TOP 33 PERCENT CustomerID
FROM CUSTOMER_R
WHERE R_Score IS NULL
ORDER BY MostRecentOrderDate DESC);
Appendix J – Business Intelligence Systems
Page J-20
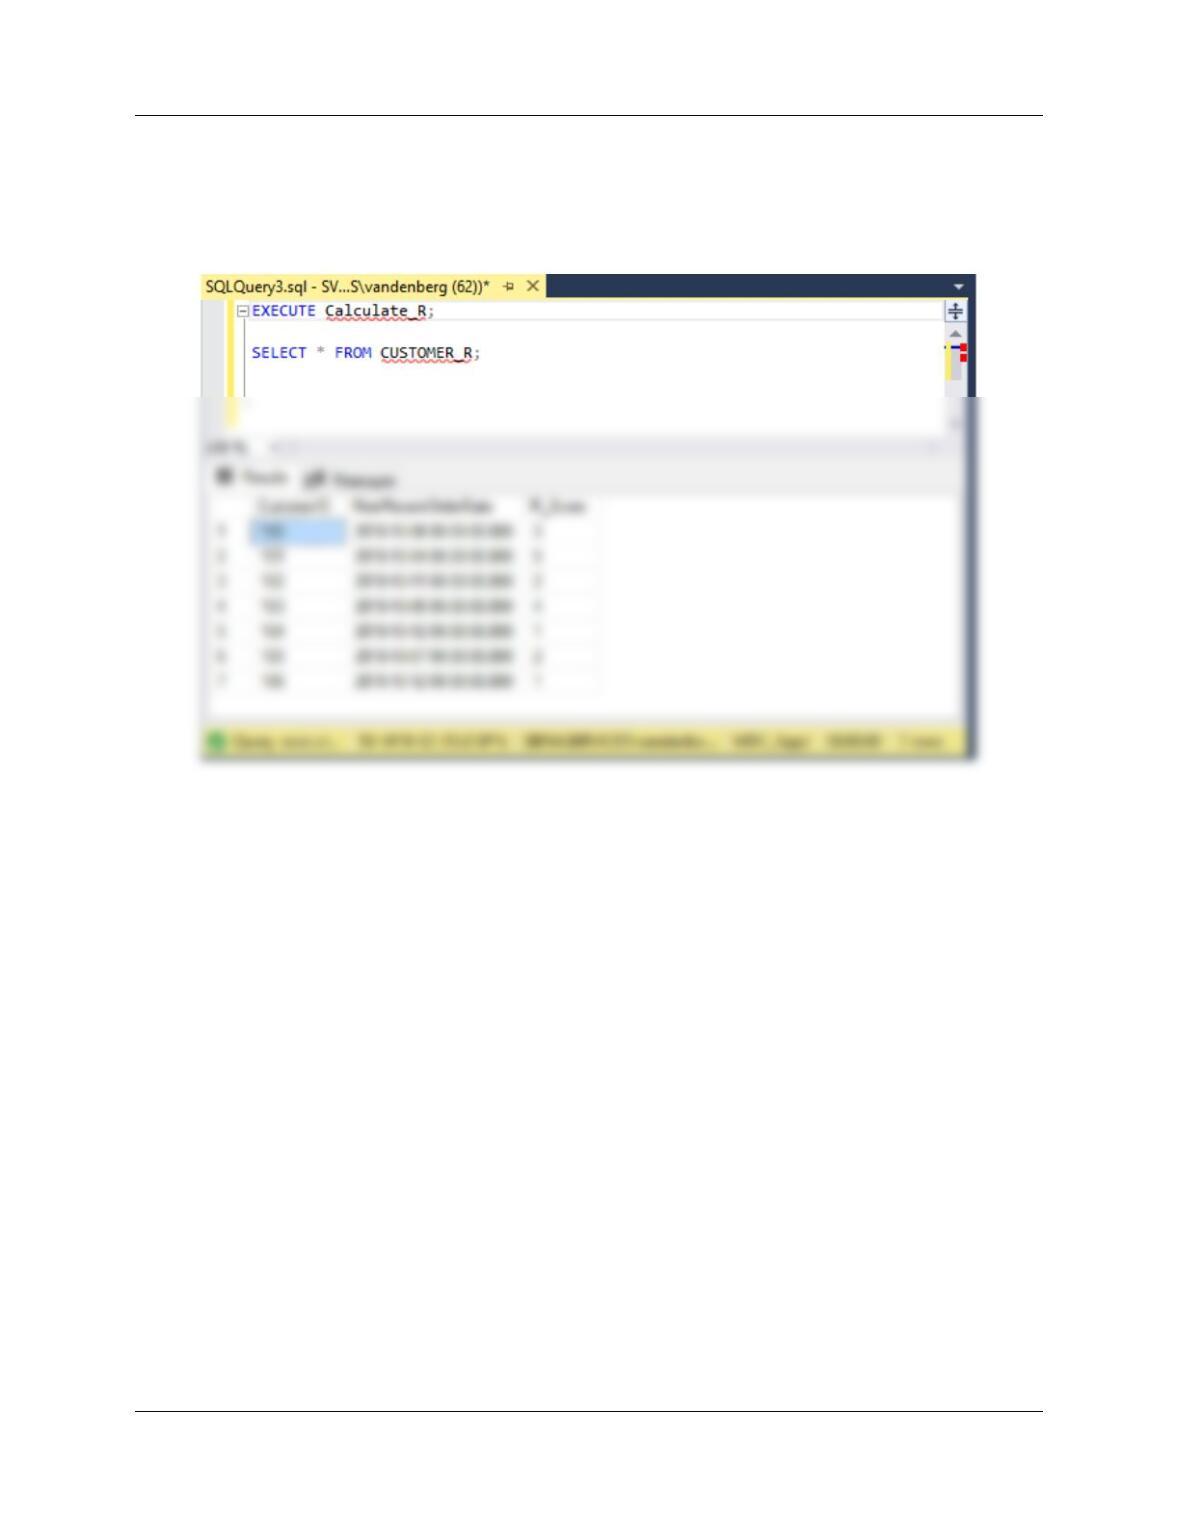
To test this procedure use:
Execute Calculate_R;
SELECT * FROM CUSTOMER_R;