
Database Concepts
8th Edition
David M. Kroenke • David J. Auer • Scott L. Vandenberg • Robert C. Yoder
Instructor’s Manual
Prepared by Scott L. Vandenberg
Appendix J
Business Intelligence Systems

All rights reserved. No part of this publication may be reproduced, stored in a retrieval system, or transmitted,
in any form or by any means, electronic, mechanical, photocopying, recording, or otherwise, without the prior
written permission of the publisher. Printed in the United States of America.
Instructor’s Manual to accompany:
Database Concepts (8th Edition)
David M. Kroenke • David J. Auer • Scott L. Vandenberg• Robert C. Yoder

Appendix J – Business Intelligence Systems
Page I-3
APPENDIX OBJECTIVES
• Learn the basic concepts of business intelligence (BI) systems
• Learn the basic concepts of data warehouses and data marts
• Learn the basic concepts of reporting systems
• Learn the basic concepts of data mining
• Learn the basic concepts of market basket analysis
• Learn the basic concepts of decision trees
CHAPTER ERRATA
There are no known errors at this time. Any errors that are discovered in the future will
be reported and corrected in the online DBC e08 Errata document, which will be
available at http://www.pearsonhighered.com/kroenke.
THE ACCESS WORKBENCH
Solutions to the Access Workbench exercises may be found in Solutions to all Sections:
The Access Workbench, which is a separate document within the Instructor’s Manual.
There is no section of The Access Workbench associated with this appendix.
NOTES ON MICROSOFT WINDOWS 10
This book uses the Microsoft Windows 10 operating system as the basis for screenshots
and step-by-step instructions. However, with Windows 10, Microsoft has introduced a
continuous update system that has already resulted in some fundamental differences in
how different versions of Windows 10 look and operate.
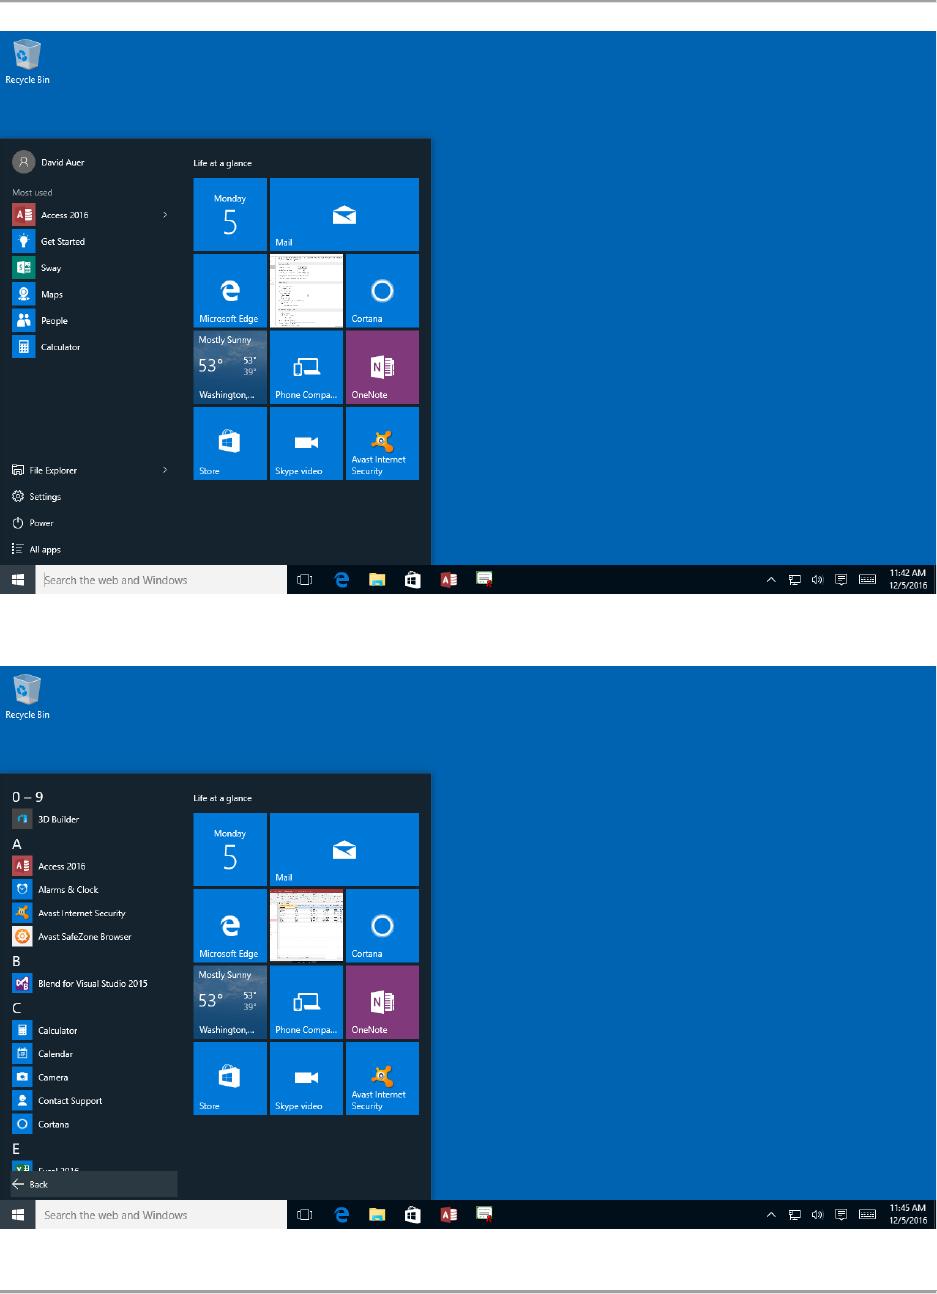
For example, in the original version of Microsoft Windows 10, clicking the Windows Start
button (or pressing the Windows key on the keyboard) displayed the menu shown in
Figure 1. In this menu, we need to click the All Apps button in order to see the Apps
menu shown in Figure 2.
Appendix J – Business Intelligence Systems
Page I-4
Figure 1 – Windows 10 Main Menu
Figure 2 – Windows 10 All Apps Menu
Appendix J – Business Intelligence Systems
Page I-5
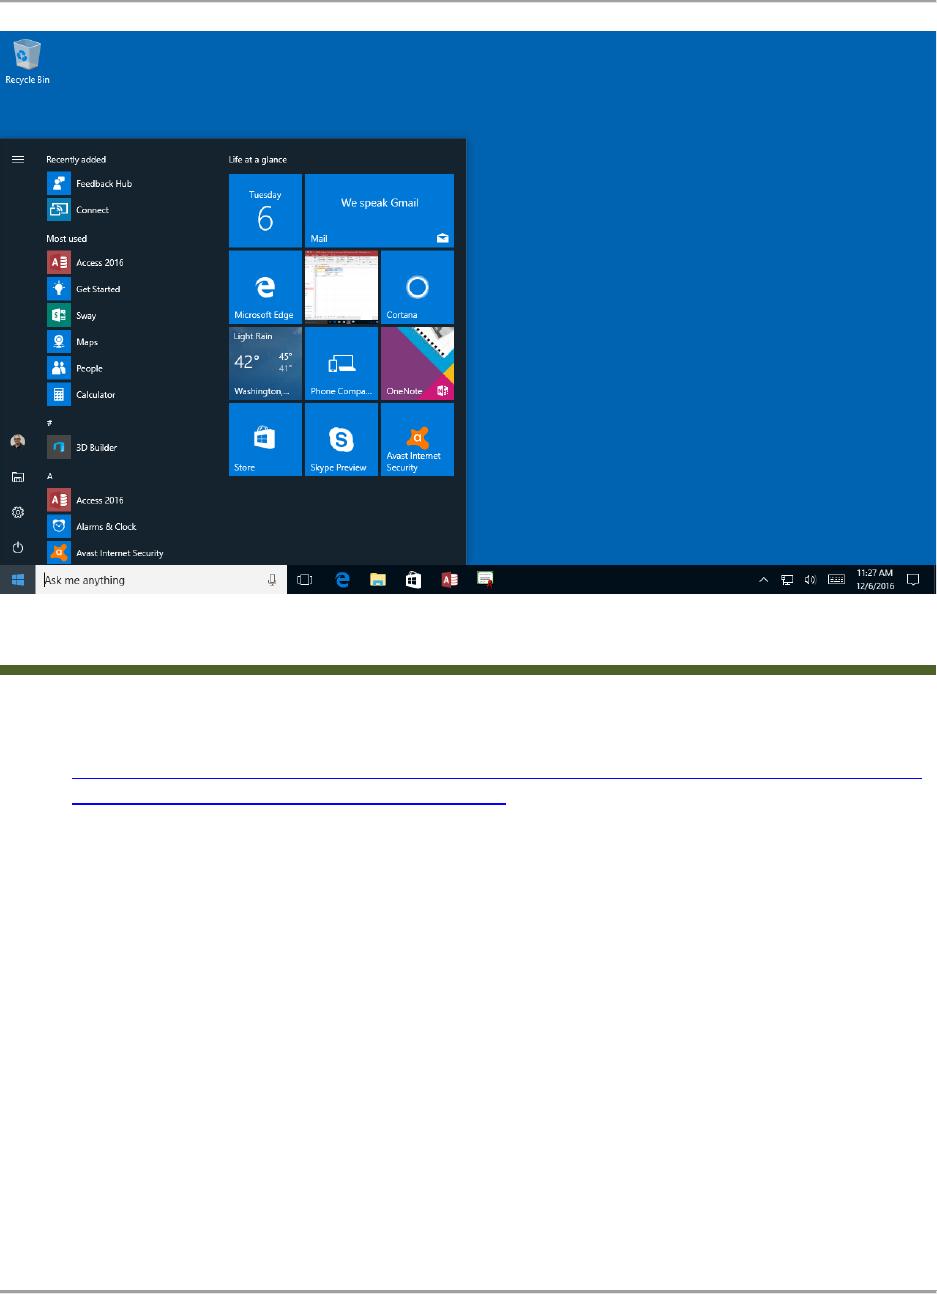
Figure 3 – Windows 10 Anniversary Update Main Menu with All Apps Included
Microsoft then released the Windows 10 Anniversary Update (Feature update to
Windows 10, version 1607) (see the blog discussion at
https://blogs.windows.com/windowsexperience/2016/08/02/how-to-get-the-windows-10–
anniversary-update/#K1CZuiw4auiuE9A5.97 ). One of the changes introduced in the
Anniversary Update was a major change to the menu system. Now, as shown in
Figure 3, the Apps menu is immediately available when the Start button is used (or the
keyboard Windows key is pressed).
Therefore, note that the step by step instructions in this book may need to be altered for
your use depending upon which version of Microsoft Windows 10 you or your students
are using!
We recommend that you update Windows 10 to the Windows 10 Anniversary Update
(Feature update to Windows 10, version 1607), and make sure it is patched with all
updates to that version (at a minimum patched to Windows 10 Version 1607 update for
August 23, 2016 (KB3176936), and the Windows 10 Version 1607 cumulative update for
September 29, 2016 (KB3194496). We also recommend using the 32-bit version of
Microsoft Office. This insures that all the examples discussed in this book will function
properly.

Appendix J – Business Intelligence Systems
Page I-6
TEACHING SUGGESTIONS
• This appendix introduces some advanced topics of database processing used in
business intelligence (BI) systems. It is intended to supplement Chapter 8 in the
book. Each of these topics is only briefly touched upon in this appendix. There is
more information on most of them in David M. Kroenke and David J. Auer, Database
Processing: Fundamentals, Design, and Implementation (14th Edition), Upper
Saddle River: Prentice Hall (2016).
• Explain to your students that business Intelligence (BI) systems already have an
important role in business operations, and the importance of this role should only
increase over time. If you know of any local examples, use them to illustrate your
point.
• Ask the students to think about ways in which data can be made more useful to
decision makers. How can data be made more relevant? Think about a continuum
of ways that data can be brought closer—downloading, data warehouses, etc.
• Many firms refer to their data or their information system as a data warehouse.
Discuss the integration required to be considered a warehouse and then explain why
others would not be considered warehouses.
• If every department wants to download data, the management problems become
immense. Data warehousing is an attempt to centralize and specialize the skills and
facilities for bringing data closer to end-users.
• Many database management systems are now including some level of support for
business intelligence operations. SQL Server and Oracle Database, for example,
have versions that include data mining support for methods such as association rules
(market basket analysis), decision trees, etc. If you have such installations available
then you can demonstrate their use or assign study of them to your students.
ANSWERS TO REVIEW QUESTIONS
J.1 What are BI systems?
J.2 How do BI systems differ from transaction processing systems?
J.3 Name and describe the two main categories of BI systems.

Appendix J – Business Intelligence Systems
Page I-7
J.4 What are the three sources of data for BI systems?
BI systems obtain data in three ways:
J.5 Summarize the problems with operational databases that limit their usefulness for BI
applications.
J.6 What is an ETL system, and what functions does it perform?
J.7 What problems in operational data create the need to clean data before loading the data
into a data warehouse?
The problems that inhibit the usefulness of operational database for BI applications are:
J.8 What does it mean to transform data? Give an example other than the ones used in this
book.
Appendix J – Business Intelligence Systems
Page I-8
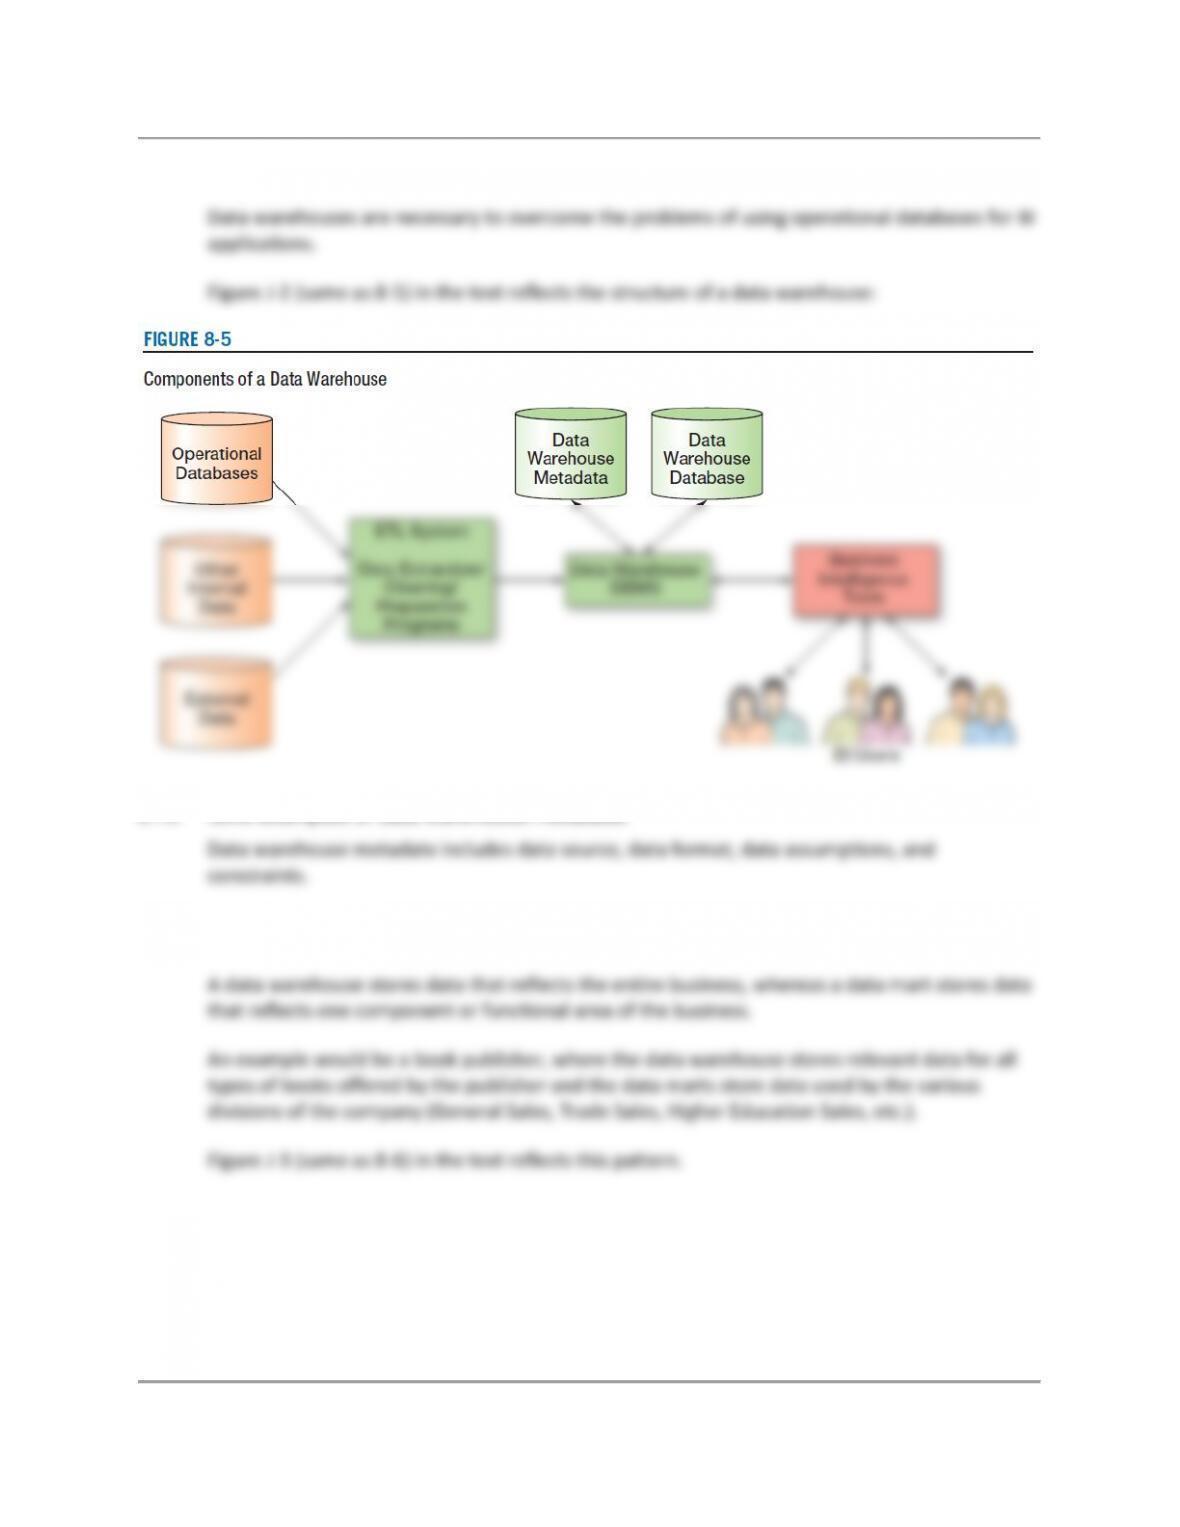
J.9 Why are data warehouses necessary?
J.10 Give examples of data warehouse metadata.
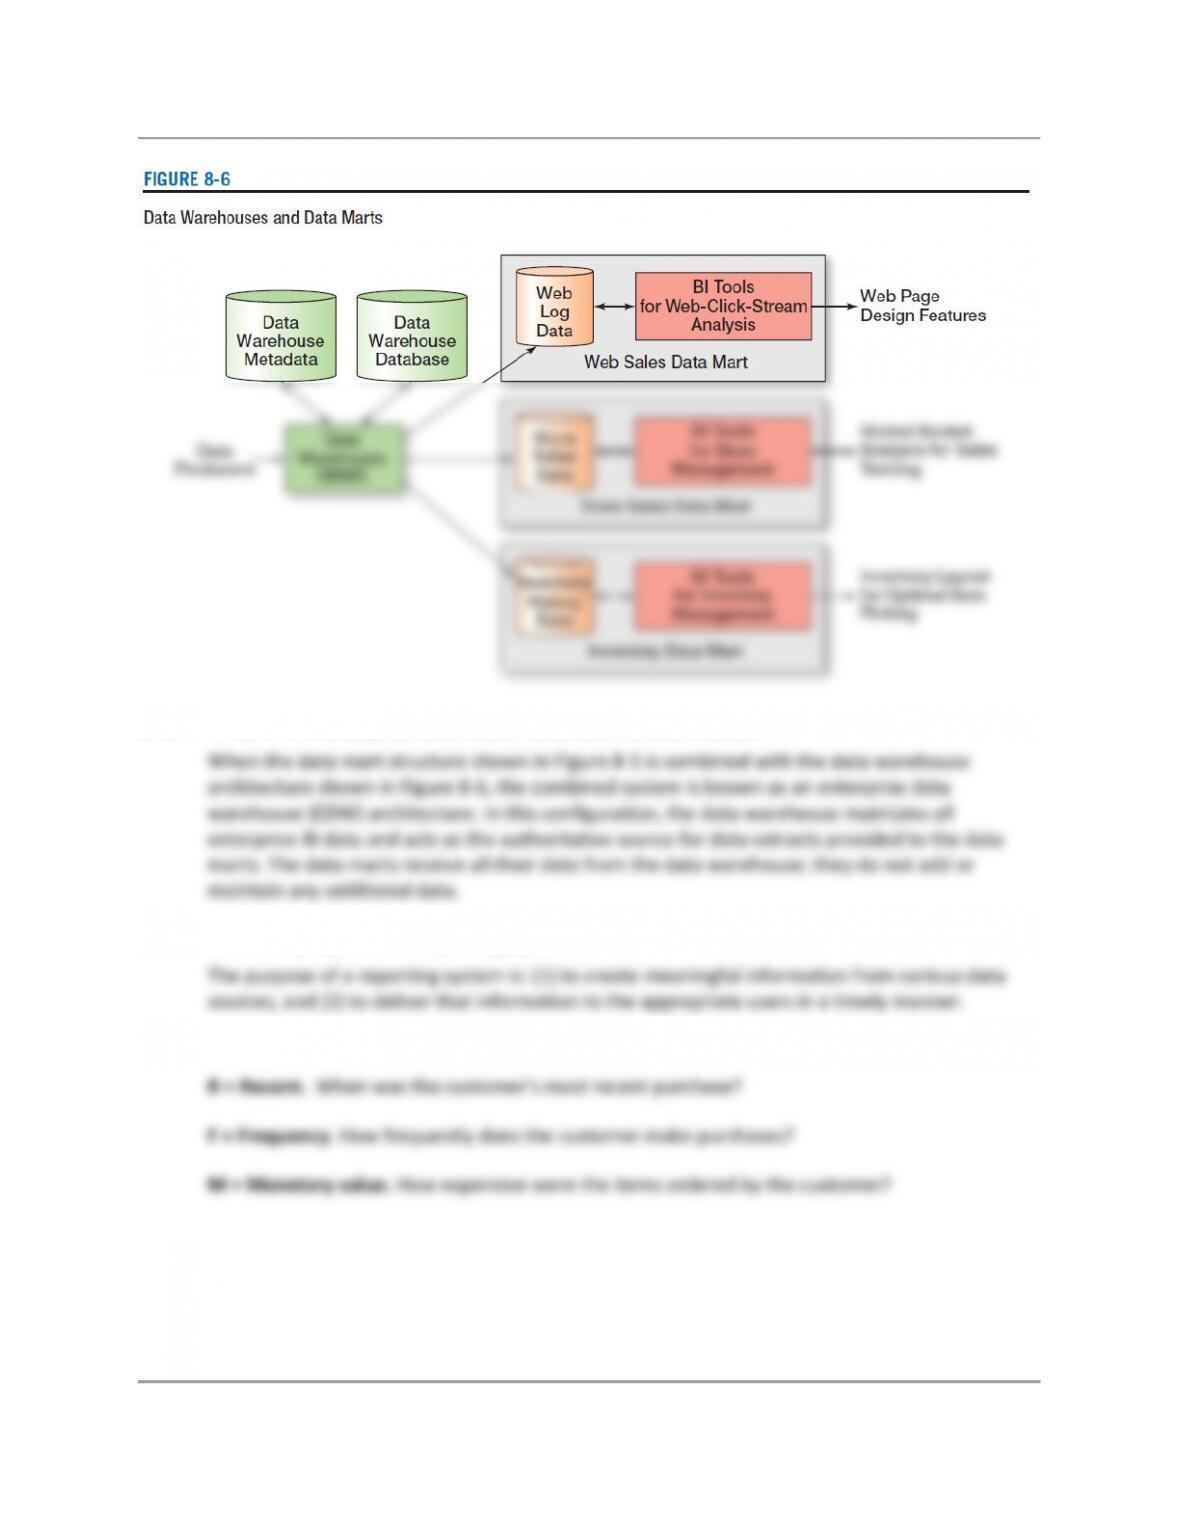
J.11 Explain the difference between a data warehouse and a data mart. Give an example
other than the ones used in this book.
Appendix J – Business Intelligence Systems
Page I-9
J.12 What is the enterprise data warehouse (EDW) architecture?
J.13 State the purpose of a reporting system.
J.14 In RFM analysis, what do the letters RFM stand for?

Appendix J – Business Intelligence Systems
Page I-10
J.15 Describe, in general terms, how to perform an RFM analysis.
To perform an RFM analysis:
1. Sort the customers by their most recent purchase date into five groups, where each group
contains 20% of the customers. The ordered customers are each assigned an R score as
follows:
2. Resort the customers based on how many orders each has into five groups, where each
group contains 20% of the customers. The ranked customers are each assigned an F score
as follows:
3. Resort the customers based on their average order value into five groups, where each group
contains 20% of the customers. The ranked customers are each assigned an M score as
follows:
4. Analyze the results (See question J.16 below)
Appendix J – Business Intelligence Systems
Page I-11
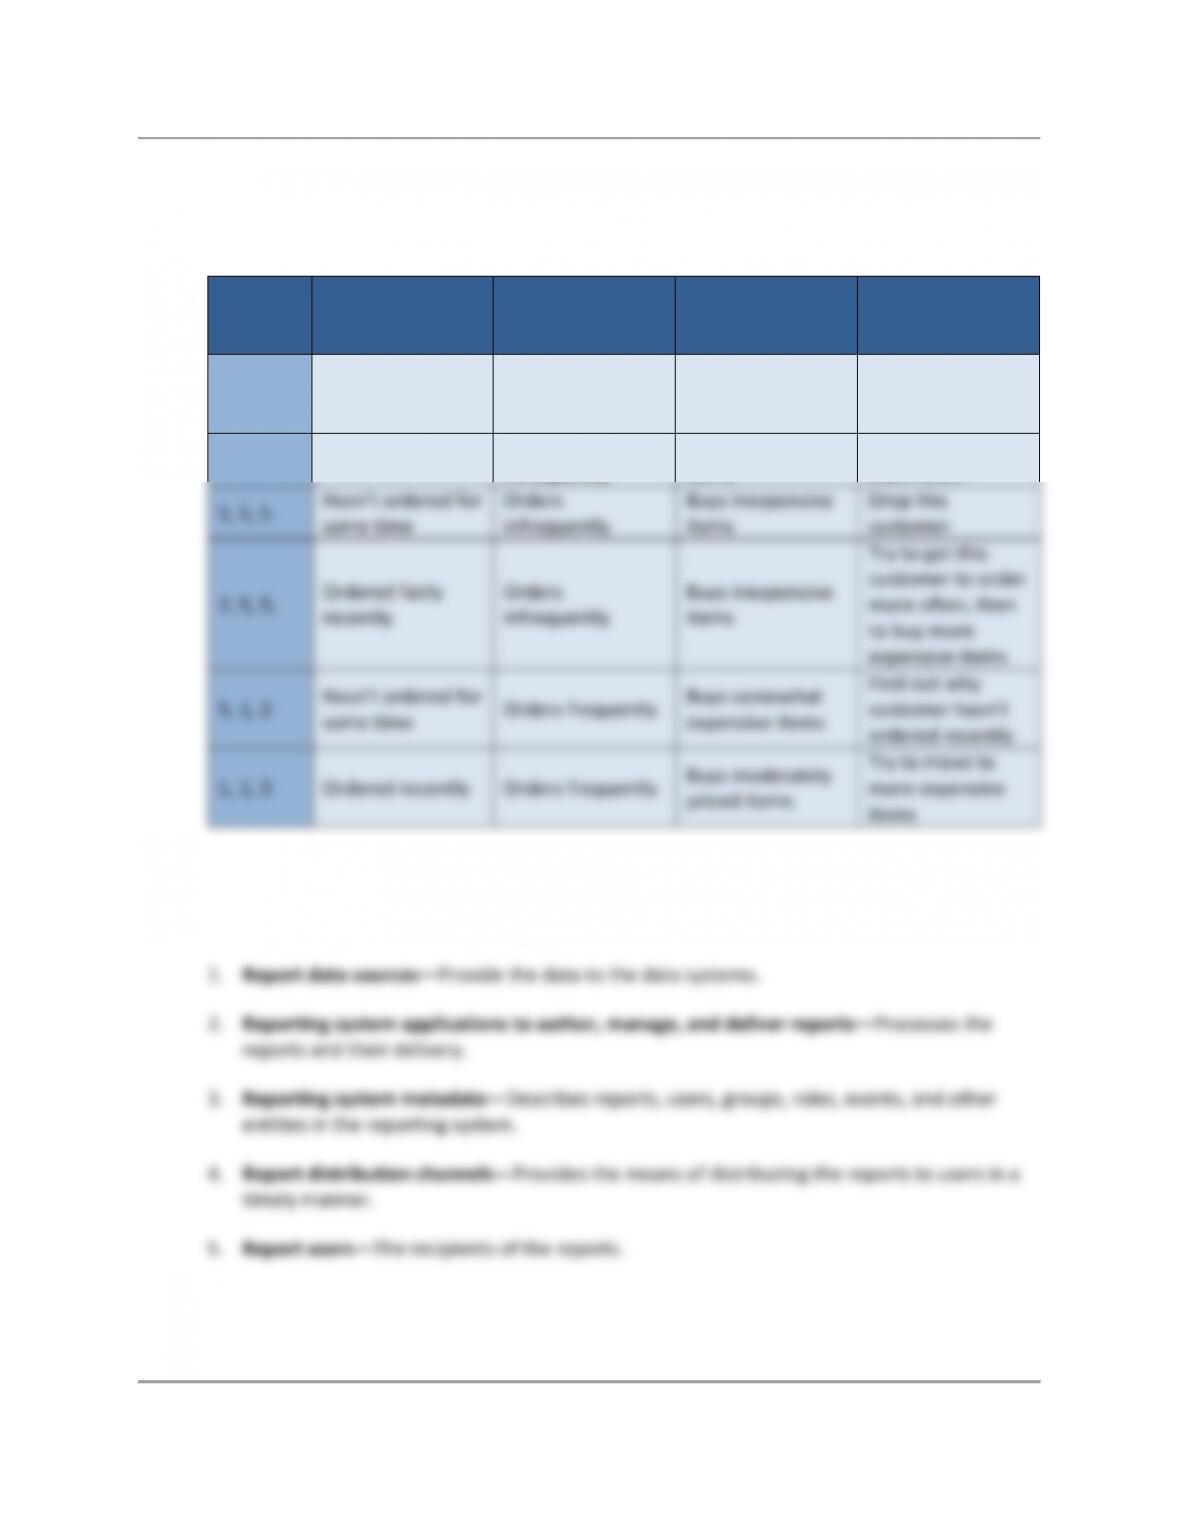
J.16 Explain the characteristics of customers that have the following RFM scores:
{1 1 5}, {1 5 1}, {5 5 5}, {2 5 5}, {5 1 2}, {1 1 3}
RFM
SCORE
R
F
M
Comments
1, 1, 5
Ordered recently
Orders frequently
Buys inexpensive
items
Try to move to
more expensive
items
1, 5, 1
Ordered recently
Orders
infrequently
Buys expensive
items
Try to get to order
more often
5, 5, 5
Hasn’t ordered for
some time
Orders
infrequently
Buys inexpensive
items
Drop this
customer
2, 5, 5,
Ordered fairly
recently
Orders
infrequently
Buys inexpensive
items
Try to get this
customer to order
more often, then
to buy more
expensive items
5, 1, 2
Hasn’t ordered for
some time
Orders frequently
Buys somewhat
expensive items
Find out why
customer hasn’t
ordered recently
1, 1, 3
Ordered recently
Orders frequently
Buys moderately
priced items
Try to move to
more expensive
items
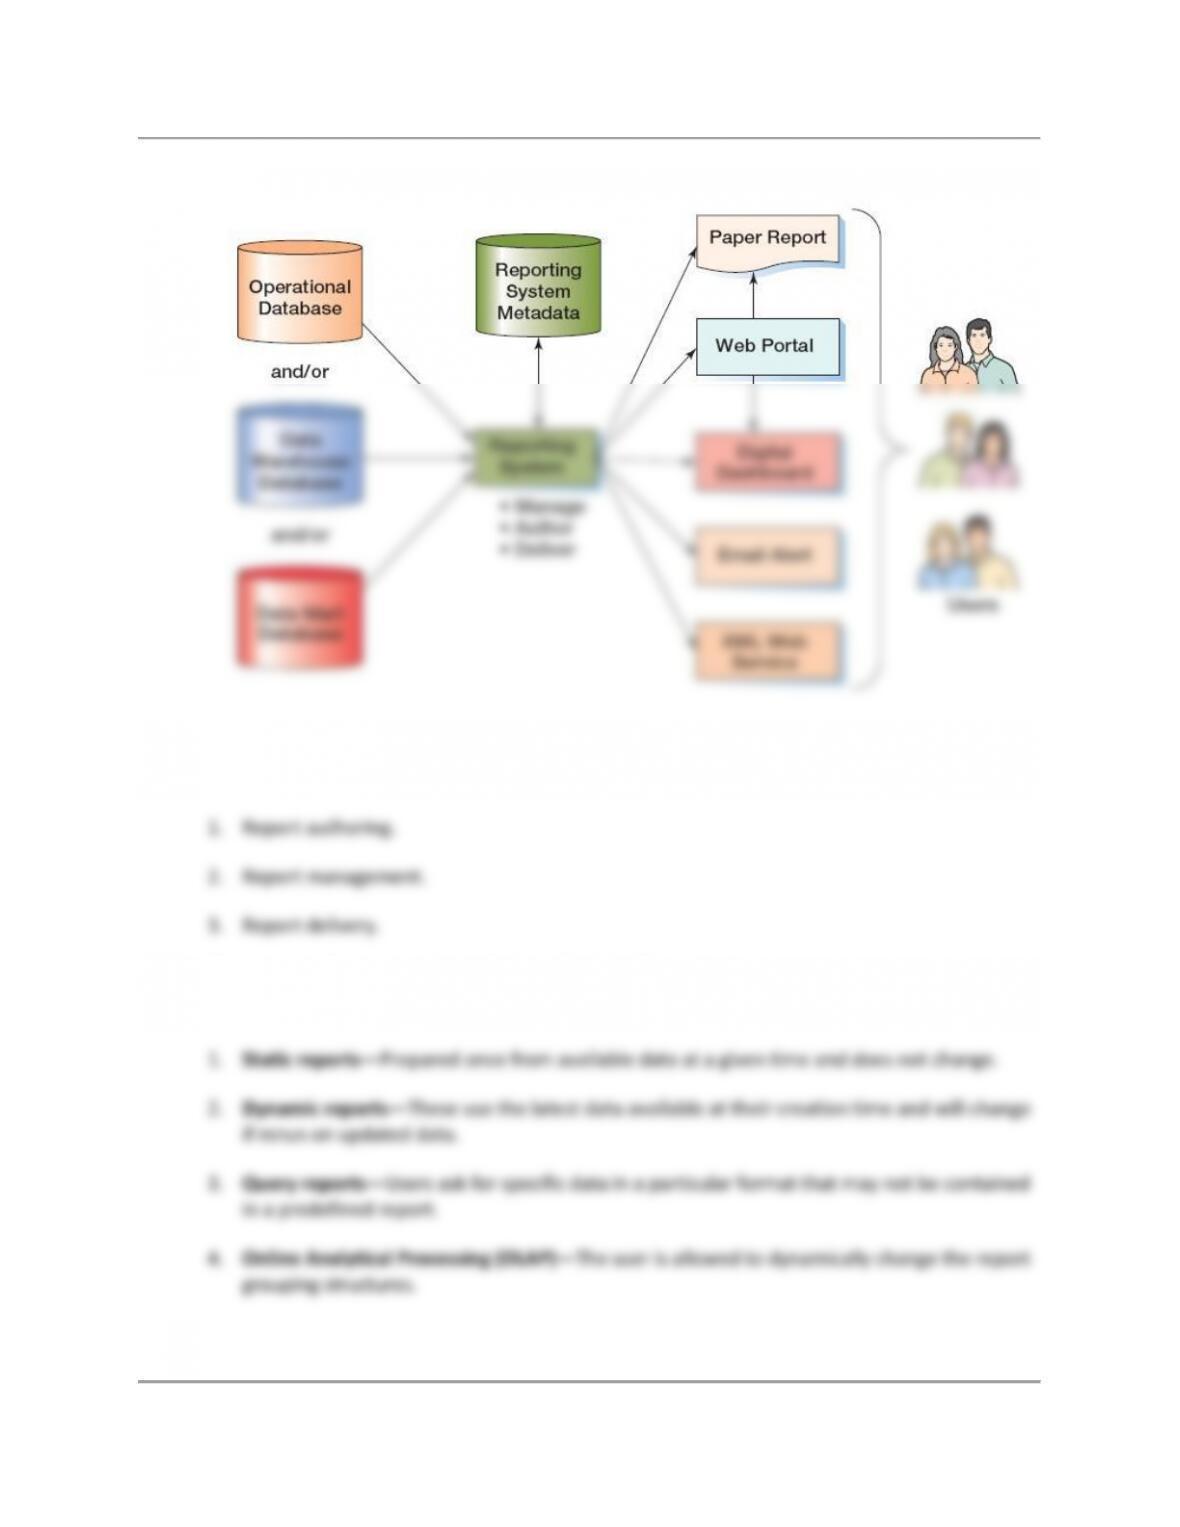
J.17 Name and describe the purpose of the major components of a reporting system.
The major components of a reporting system are:
Appendix J – Business Intelligence Systems
Page I-12
There are illustrated in Figure J–6 in the text:
J.18 What are the major functions of a reporting system?
The major functions of a reporting system are:
J.19 Summarize the types of reports described in this chapter.
There are four types of reports:

Appendix J – Business Intelligence Systems
Page I-13
J.20 Describe the various media used to deliver reports.
There are five media for reports:
J.21 Summarize the modes of reports described in this chapter.
There are two modes for reports:
J.22 Describe the major tasks in report management. Explain the role of report metadata in
report management.
The major tasks of report management include defining who receives what reports, when, how
(report media), and by what means (report mode).
Report metadata would be used to:
J.23 Name three tasks of report authoring.
The three tasks of report authoring are:

Appendix J – Business Intelligence Systems
Page I-14
J.24 Describe the major tasks in report delivery.
Report delivery has these major tasks:
J.25 What does OLAP stand for?
J.26 Define data mining.
J.27 Explain the difference between unsupervised and supervised data mining.
J.28 Name five popular data mining techniques.
ANSWERS TO EXERCISES
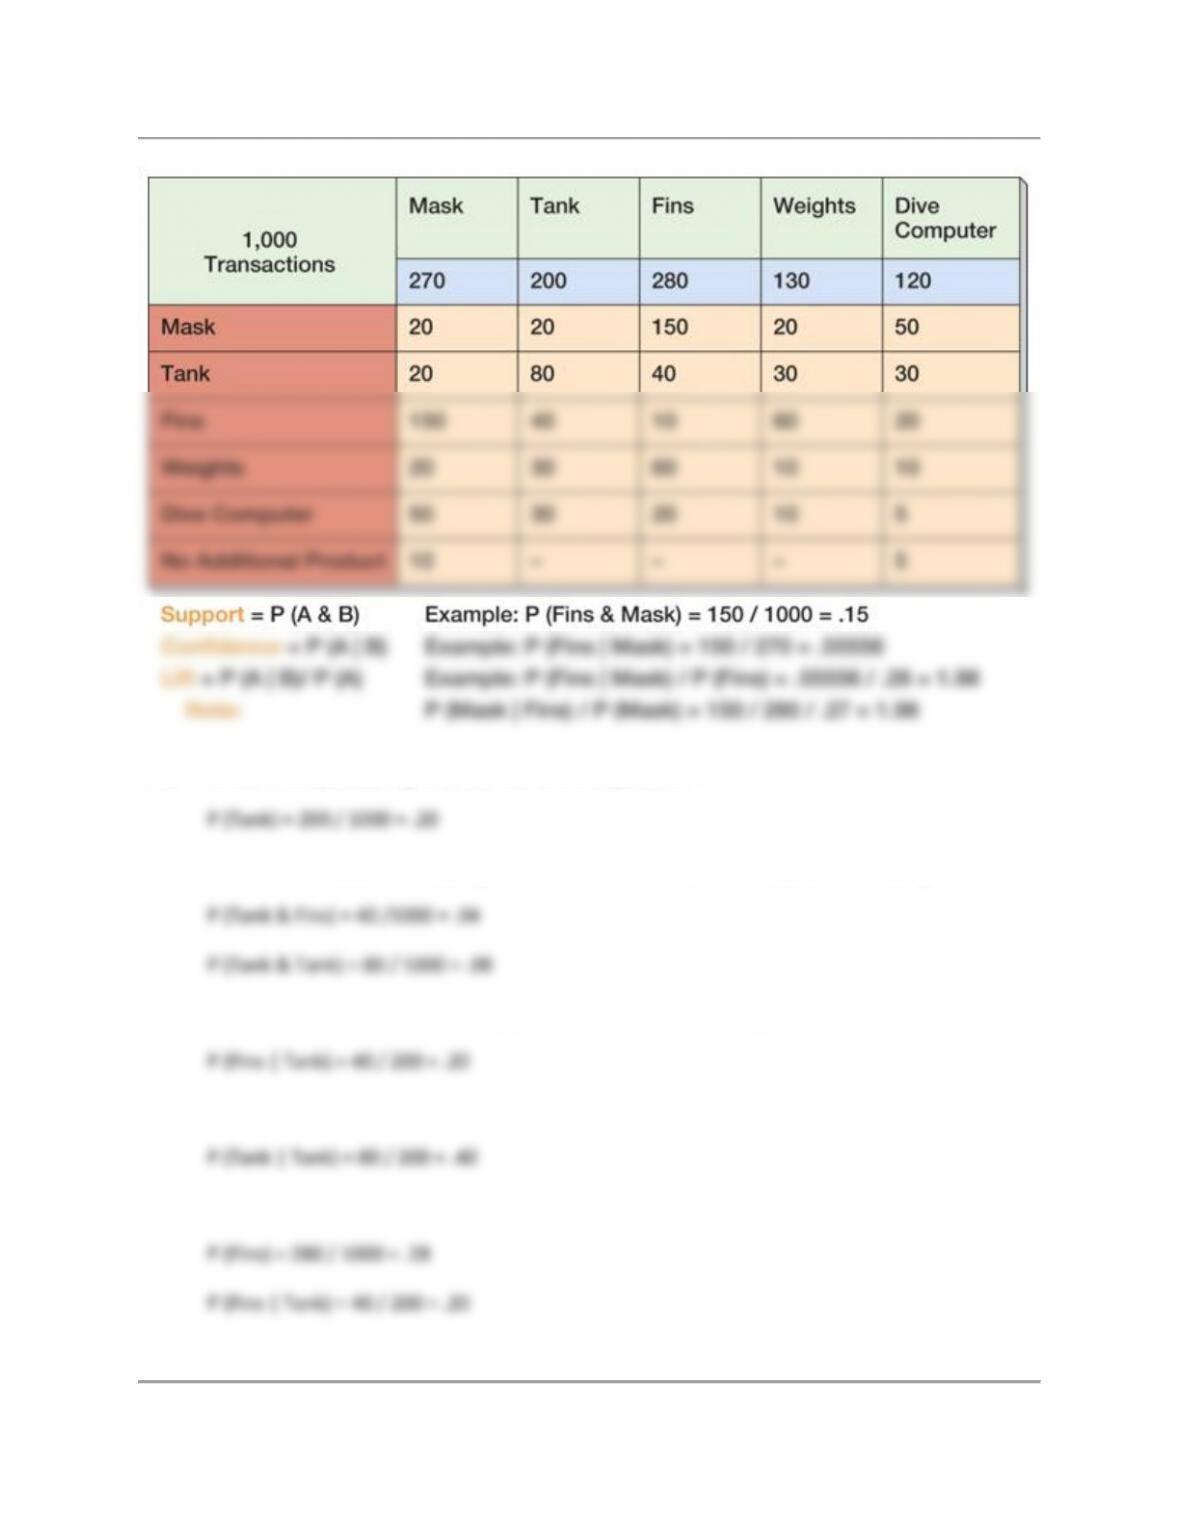
Use the data in Figure J-9 to answer questions J.29 through J.35.
Appendix J – Business Intelligence Systems
Page I-15
J.29 What is the probability that someone will buy a tank?
J.30 What is the support for buying a tank and fins? What is the support for buying two tanks?
J.31 What is the confidence for fins, given that a tank has been purchased?
J.32 What is the confidence for a second tank, given that a tank has been purchased?
J.33 What is the lift for fins, given that a tank has been purchased?
Appendix J – Business Intelligence Systems
Page I-16
J.34 What is the lift for a second tank, given that a tank has been purchased?
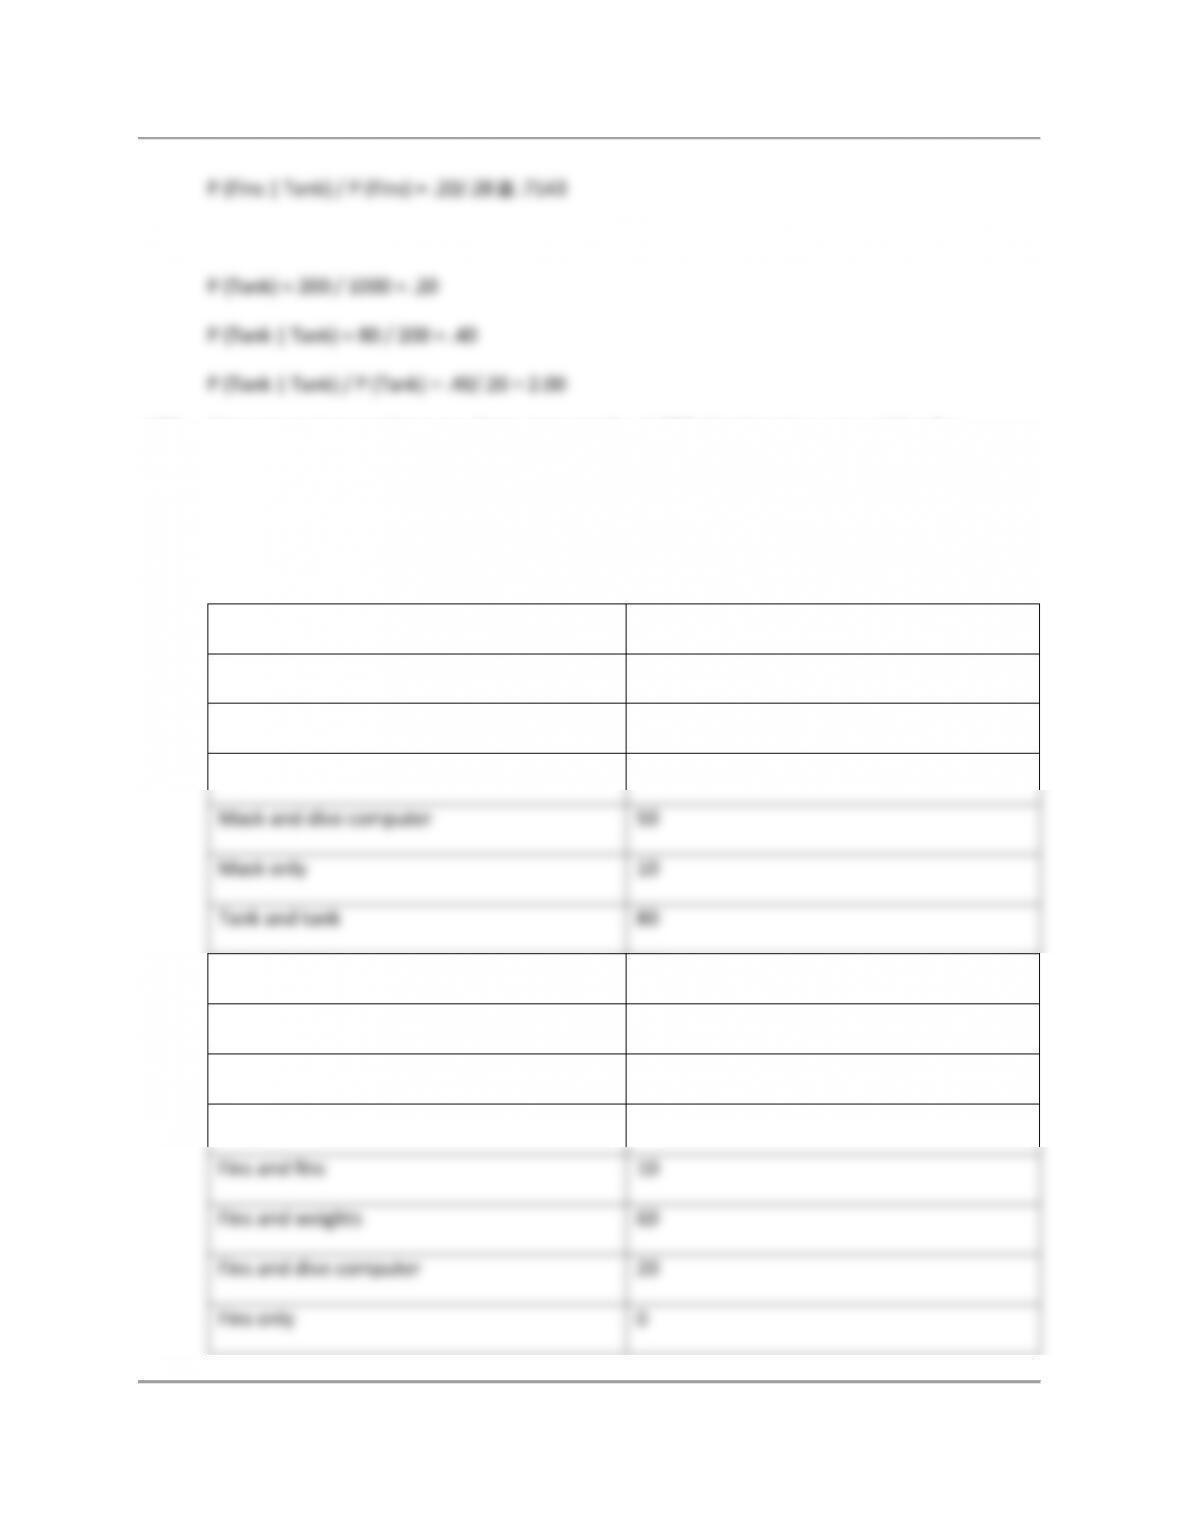
J.35 How many transactions are there (among the 1,000) that involve none of the five
products mentioned in the table (mask, fins, tanks, dive computer, and weights)?
430. Since we know that every transaction includes 1 or 2 items total, we can enumerate all the
possible combinations of items in a transaction (remember that “mask and tank” is the same as
“tank and mask”, etc.):
Mask and mask
20
Mask and tank
20
Mask and fins
150
Mask and weights
20
Mask and dive computer
50
Mask only
10
Tank and tank
80
Tank and fins
40
Tank and weights
30
Tank and dive computer
30
Tank only
0
Fins and fins
10
Fins and weights
60
Fins and dive computer
20
Fins only
0
Appendix J – Business Intelligence Systems
Weights and weights
10
Weights and dive computer
10
Weights only
0
Dive computer and dive computer
5
Dive computer only
5
TOTAL
570
None of the listed products
1000 – 570 = 430
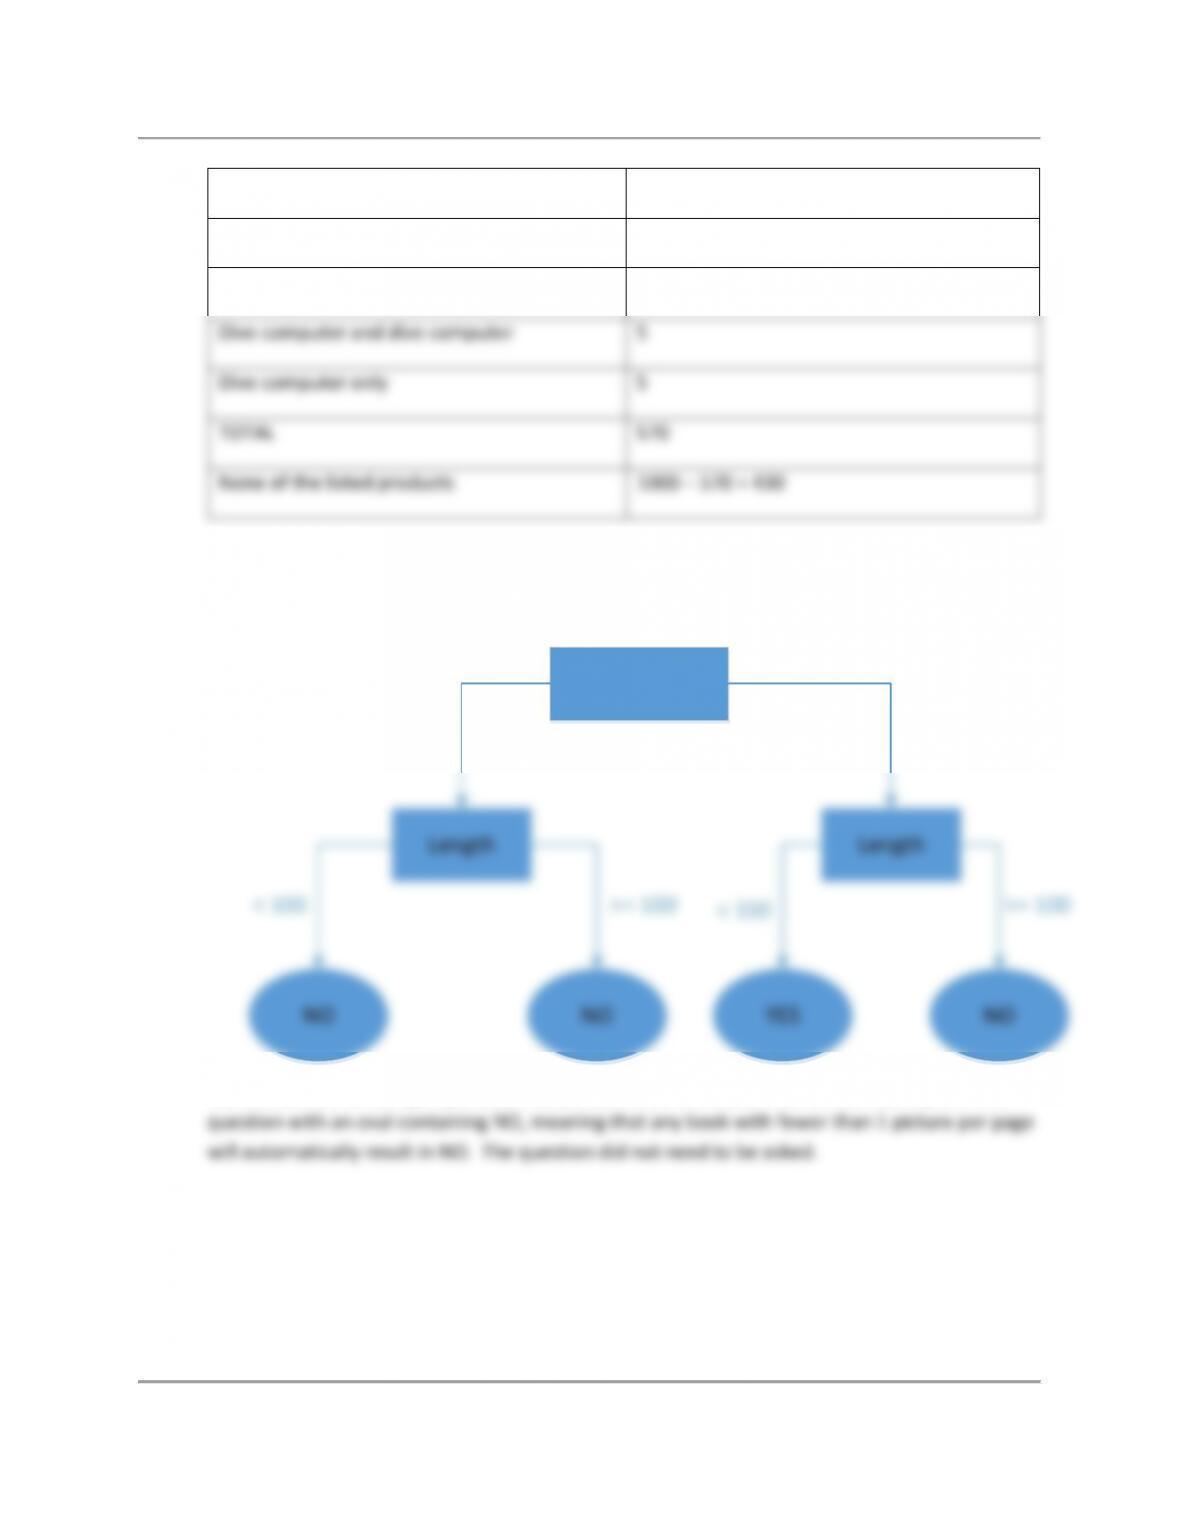
J.36 How could you improve the decision tree in Figure J-11 to be more efficient?
PicturesPerPage
Length
NONO NO
>= 1
< 1
< 100 >= 100
Length
YES
< 100 >= 100
Notice that the left Length question always has NO as an answer. We could thus replace that
Use the decision tree in Figure J-13 to answer questions J.37 through J.39.
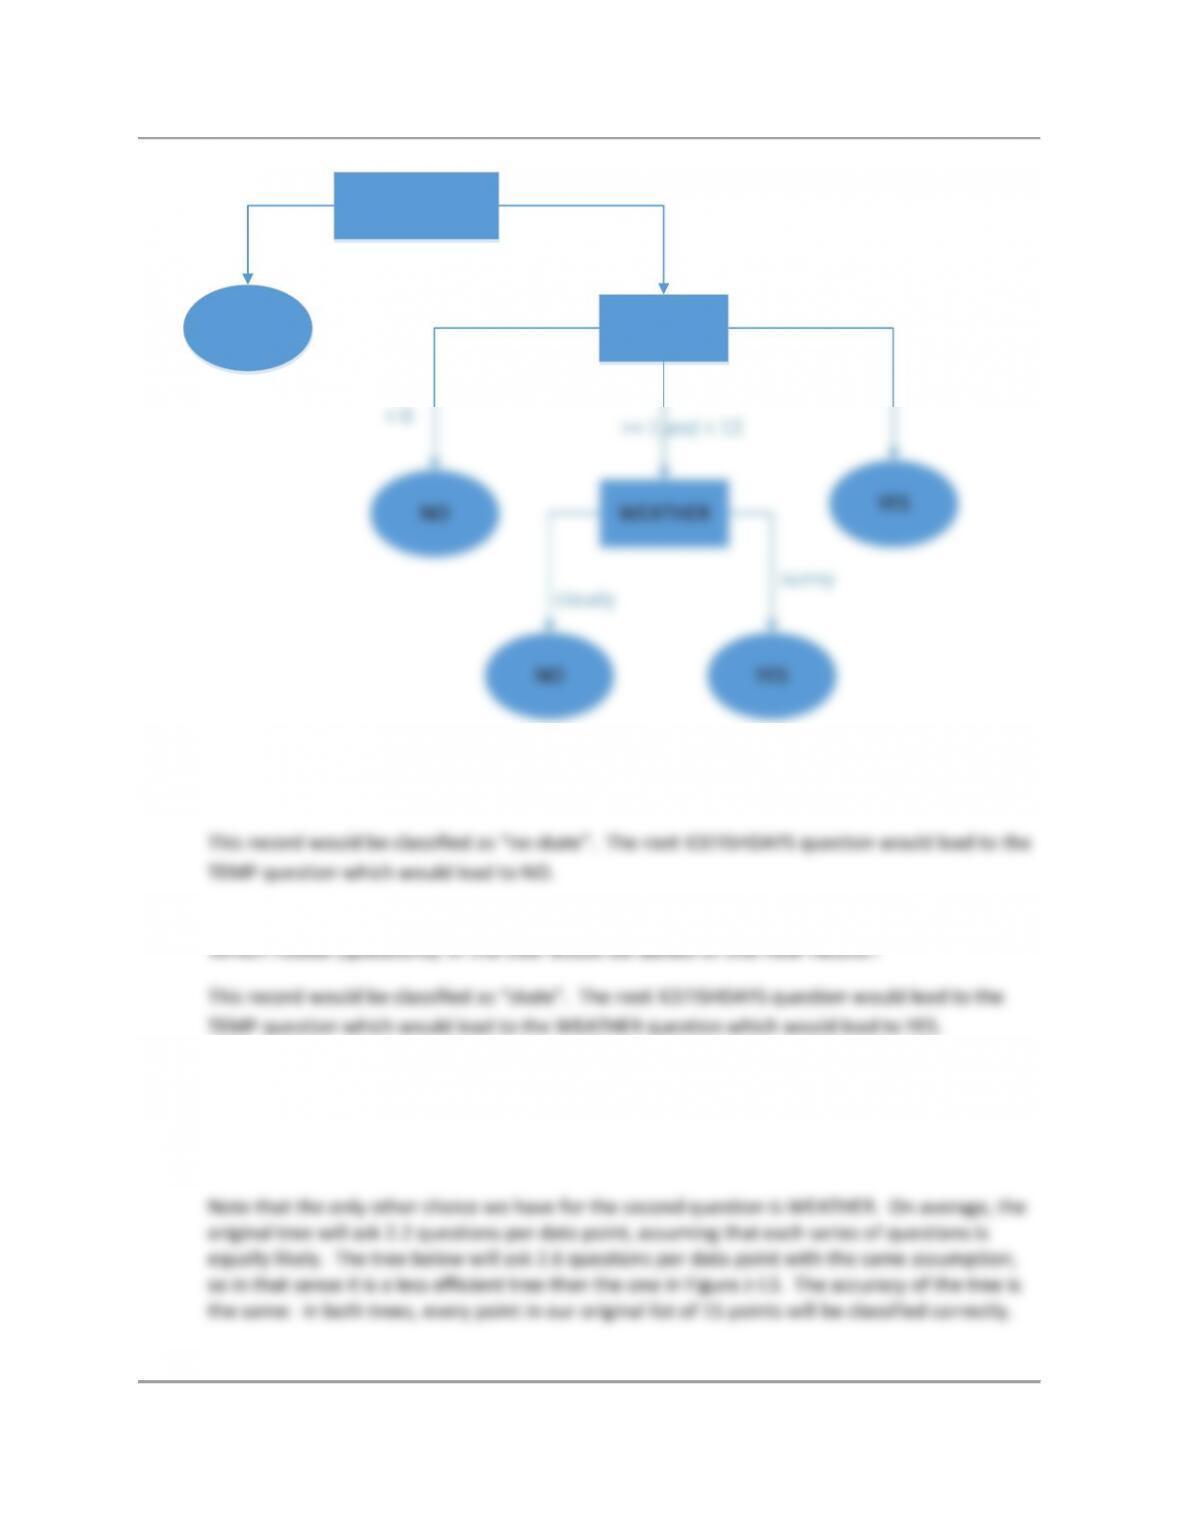
Appendix J – Business Intelligence Systems
ICEFISHDAYS
WEATHER YES
YES
NO
>= 10< 10
< 0
TEMP
NO
>= 1 and < 12
>= 12
NO
sunny
cloudy
J.37 Would the new data point (record) (cloudy, –3, 16) be classified as “skate” or “no skate”?
Which nodes (questions) in the tree would be asked of this new record?
J.38 Would the new data point (record) (sunny, 5, 22) be classified as “skate” or “no skate”?
J.39 Draw a different decision tree, based on the same data, by basing the second question
on a different attribute. Does your tree ask more or fewer questions, on average, to
categorize a new point when compared to the tree presented in the text? Does your tree
have higher or lower accuracies for its decisions?
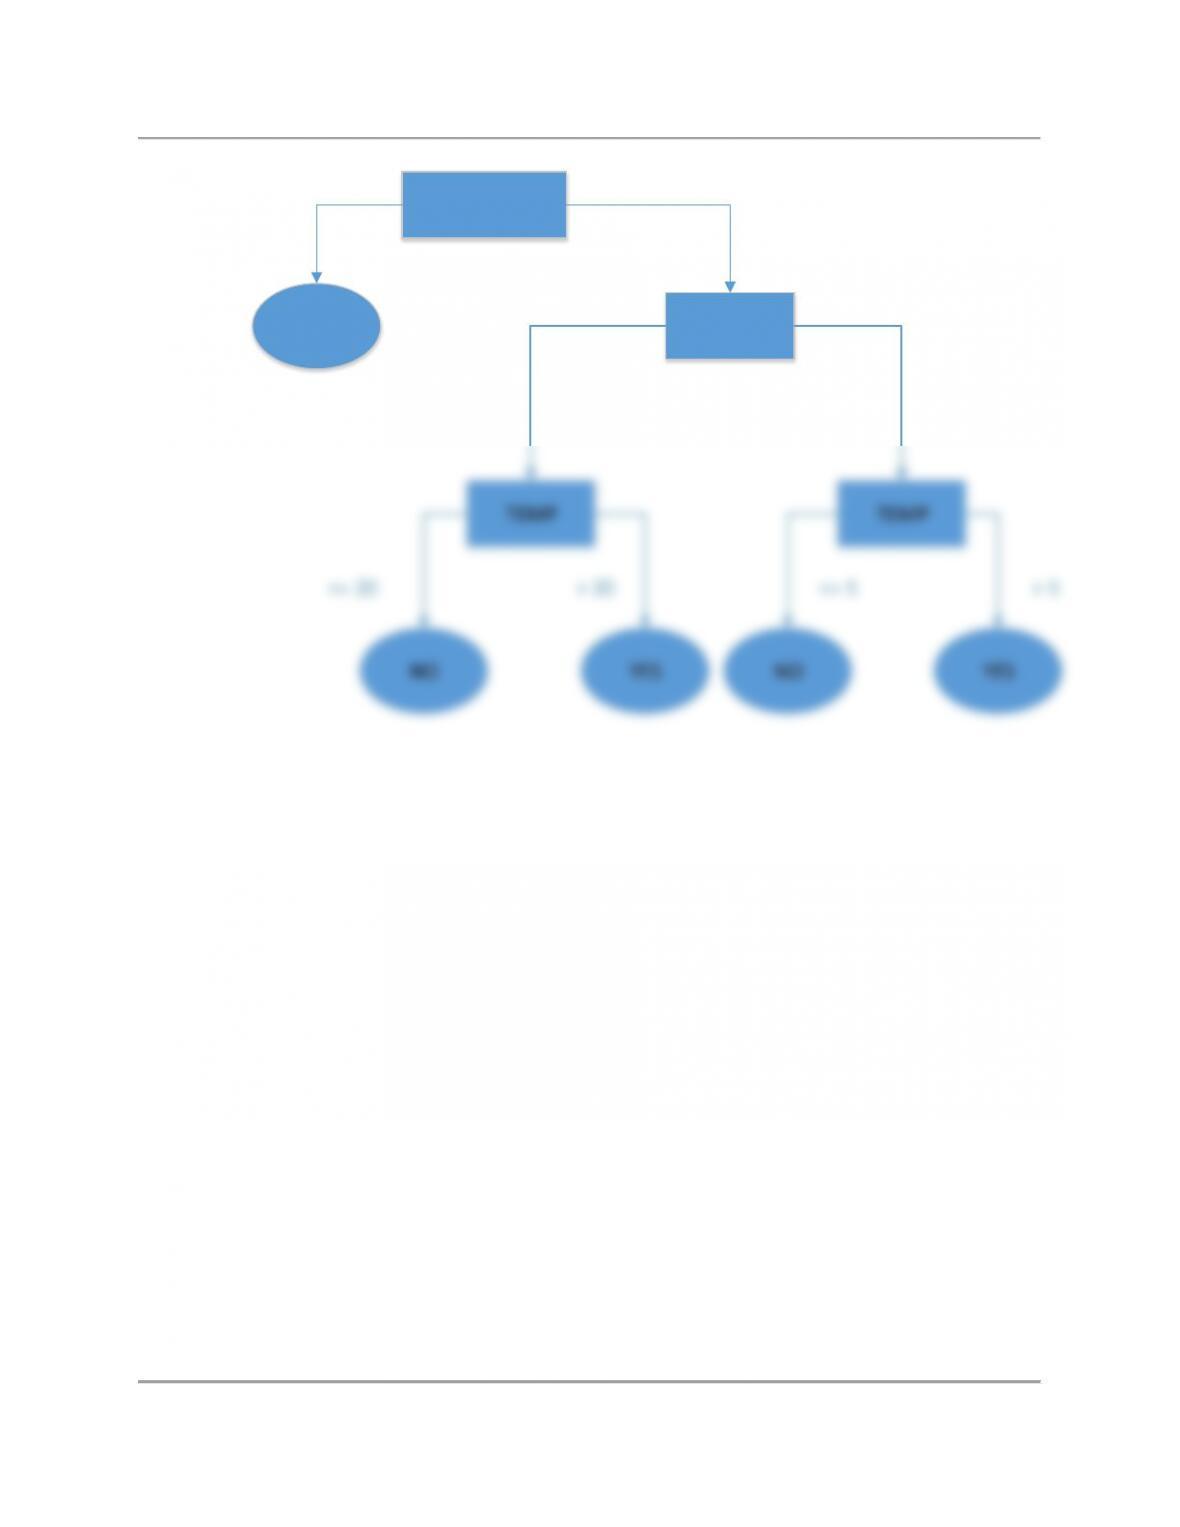
Appendix J – Business Intelligence Systems
ICEFISHDAYS
TEMP
YES YES
NO
>= 10< 10
cloudy
WEATHER
NO
sunny
NO
<= 5> 20
TEMP
<= 20 > 5