Module 7 krugman 1
Module 7
Changes in Equilibrium
What’s New in the Fourth Edition?
• Enhanced in-class activities and handouts
Module Objectives
• How are equilibrium price and quantity affected when there is a change in either supply or
demand?
• How are equilibrium price and quantity affected when there is a simultaneous change in both
supply and demand?
Teaching Tips
Changes in Supply and Demand
Creating Student Interest
• Ask students to identify some products with prices that have changed recently. Ask them to
speculate on what demand or supply factors might have been responsible for the change in
the equilibrium price.
Presenting the Material
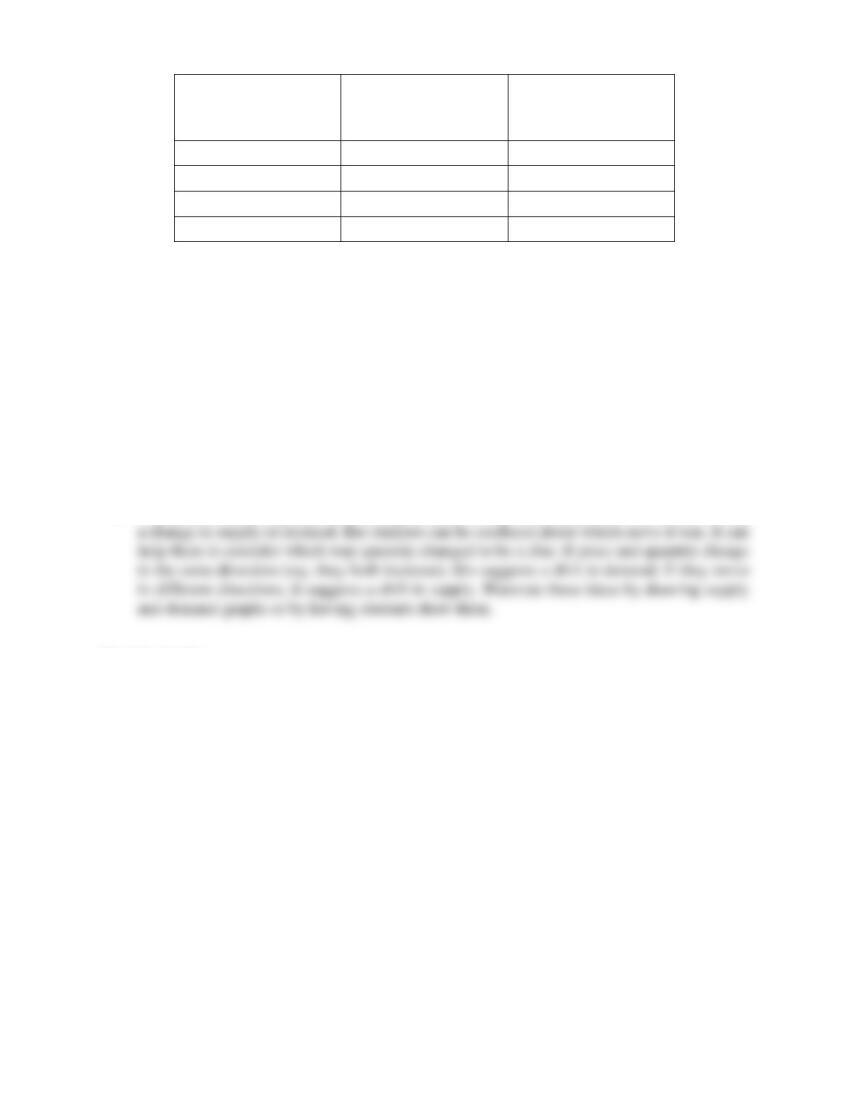
• Use the natural gas market presented in the Module to discuss changes in equilibrium. The
table below can be used to represent supply before and after the widespread use of hydraulic
fracturing technology. Draw an initial supply/demand graph and identify equilibrium, and
then illustrate the shift in supply and new equilibrium. As a second example, consider what
happens when there is an increase in demand, say as a result of income rising in the economy.
Illustrate the effect on equilibrium price and quantity. Finally, consider the two changes
together. Carefully review the idea that when two changes occur at the same time, there will
Module 7 krugman 2
Price
(per BTU)
Quantity
before the new
technology
Quantity
after the new
technology
$5.00
100,000
200,000
4.00
80,000
160,000
3.00
60,000
120,000
2.00
40,000
80,000
• Have students think about a three-step process when they use the supply and demand model.
For example, suppose more people prefer to drink coffee. Step one will ask, “Which side of
the market is affected: supply or demand?” Step two will ask, “Is it an increase or a decrease
in supply or demand?” Step three will shift the curve to the right or left and show the effect
on equilibrium price and quantity.
• Have students avoid overanalyzing a problem. The common mistake is to say an increase in
demand will shift the demand curve to the right. Since this will push the price up, fewer
people will want to buy the good at the higher price and demand will shift back to the left.
Students in this case are confusing a shift with a movement. A shift of one curve is caused
by a change in a variable besides price. This causes a movement along the other curve.
Students need to see and practice many examples until this become clear.
Common Student Pitfalls
• Which curve is it anyway? Any change in price of a good is likely to have been caused by
Module Outline
I. Changes in Supply and Demand
A. What happens when the demand curve shifts?
1. An increase in demand (the demand curve shifts right) leads to a rise in both the
equilibrium price and the equilibrium quantity.
2. A decrease in demand (the demand curve shifts left) leads to a fall in both the
equilibrium price and equilibrium quantity.
B. What happens when the supply curve shifts?
1. An increase in supply (the supply curve shifts right) leads to a fall in the
equilibrium price and a rise in the equilibrium quantity.
2. A decrease in supply (the supply curve shifts left) leads to a rise in the
equilibrium price and a fall in the equilibrium quantity.
Module 7 krugman 3
C. Simultaneous shifts in supply and demand.
1. The results for equilibrium quantity and equilibrium price depend on the
direction of the shifts in supply and demand, and by how much these curves
shift.
Case Studies in the Text
Economics in Action
Where is the Guacamole?—This EIA explains the cause of the rise in avocado prices between
2015 and 2017.
Ask students the following questions:
1. What were the demand-related factors that contributed to the increase in the price of
2. What were the supply-related factors that contributed to the increase in the price of
Web Resources
Useful examples for teaching supply and demand can be found on this website:
Internet Center for Management and Business administration, Inc.
Module 7 krugman 4
Handout 7-1
Date_________ Name____________________________ Class________ Professor________________
Applying Analysis to a News Article: Supply and Demand
Using an article from a newspaper, magazine, or relevant online source that is about a specific
market and that indicates a change in price of the product.
1. Identify the relevant market.
2. Describe the nature of the change in the market: shift in demand or shift in supply.
3. Describe the direction of the shift.
4. Describe what induced the shift.
5. Indicate the effect of the shift on the equilibrium market price.
6. Indicate when you can predict the change in the equilibrium quantity, and indicate
when you cannot.
Module 7 krugman 5
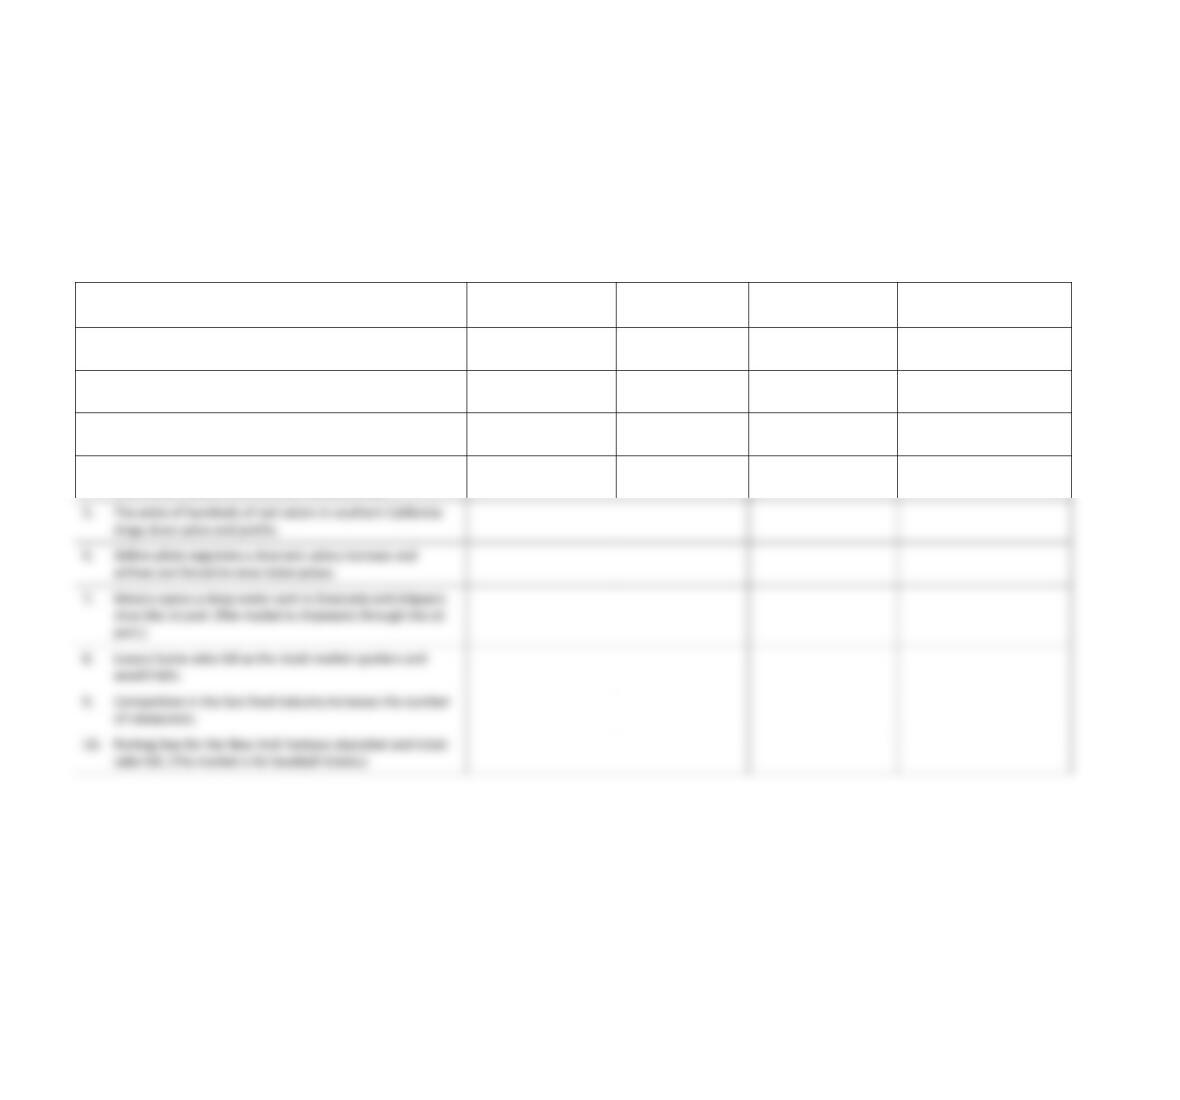
Handout 7-2
Date_________ Name____________________________ Class________ Professor________________
Changes in the Equilibrium Price
Using an article from a newspaper, magazine, or relevant online source that is about a specific market
and that indicates a change in price of the product.
Example
Demand shifts right or
left?
Supply shifts right
or left?
Equilibrium price up or
down?
Equilibrium quantity up or
down?
1. Demand for colorful prom night attire boosts sales of fuchsia
cummerbunds.
2. The expiration of drug patents increases the number of
generic drugs available to consumers.
3. Panic reigns on Wall Street as millions of stockholders sell
simultaneously.
4. GM and Ford overestimate demand and produce too many
cars in the midst of a slowdown in the economy.
5. The entry of hundreds of nail salons in southern California
drags down price and profits.
port.)
8. Luxury home sales fall as the stock market sputters and
wealth falls.
9. Competition in the fast-food industry increases the number
of restaurants.
10. Parking fees for the New York Yankees skyrocket and ticket
sales fall. (The market is for baseball tickets.)