Module 6 krugman 1
Module 6
Supply and Equilibrium
What’s New in the Fourth Edition?
• Enhanced in-class activities and handouts
Module Objectives
• What is the supply curve?
• What is the difference between movements along the supply curve and changes in supply?
• How do supply and demand curves lead to an equilibrium price and equilibrium quantity in
the market?
• What are shortages and surpluses and why do price movements eliminate them?
Teaching Tips
The Supply Curve
Creating Student Interest
• Have students imagine they have all been given a free pair of tickets to an upcoming college
football game. Suppose it is an important game and all tickets have been sold. Given there
are still people who would like to go to the game who do not have a ticket, how many students
Presenting the Material
• Ask students to write down how many hours they are willing to tutor economics students at
the following hourly wage rates: $16, $12, $10, $8, $6. Then ask three students to report their
responses. Add up the hours at each wage and derive the upward-sloping supply curve. Note:
A few students may choose to work fewer hours as the wage rises, but generally the overall
response produces an upward-sloping supply curve.
• The tutor example helps students see the relationship between individual supply and market
supply, and highlights the idea that the supply curve is identifying people’s willingness to
sell. Move now to an example of a firm producing a good or service, such as a textbook, or
a coffee shop serving customers. Introduce the idea that the firm is willing to sell a good or
service as long as the price is at least as high as the marginal cost of producing the good.
Module 6 krugman 2
Supply, Demand, and Equilibrium
Creating Student Interest
• Use the concept of incentives to introduce the idea of equilibrium. Firms have an incentive
to charge the highest price possible, but at the same time, buyers have an incentive to search
out the lowest price for the good. In a competitive market with many buyers and sellers, this
will lead to one equilibrium price for the good.
Presenting the Material
• Draw a graph showing supply and demand (together at last on the same graph!). Make the
point that it is quantity demanded that equals quantity supplied (i.e., supply does not equal
demand). Remind students of the distinction made earlier between demand/quantity
• Remind students that at equilibrium there is balance and there is no tendency for change.
Select a price above equilibrium. Ask students what consumers think about a high price.
Show the quantity demanded on the graph. Ask them what producers think about the higher
price. Show the quantity supplied. Determine the surplus on the graph and ask students what
producers will do when surpluses start building up in the warehouse. (They will lower
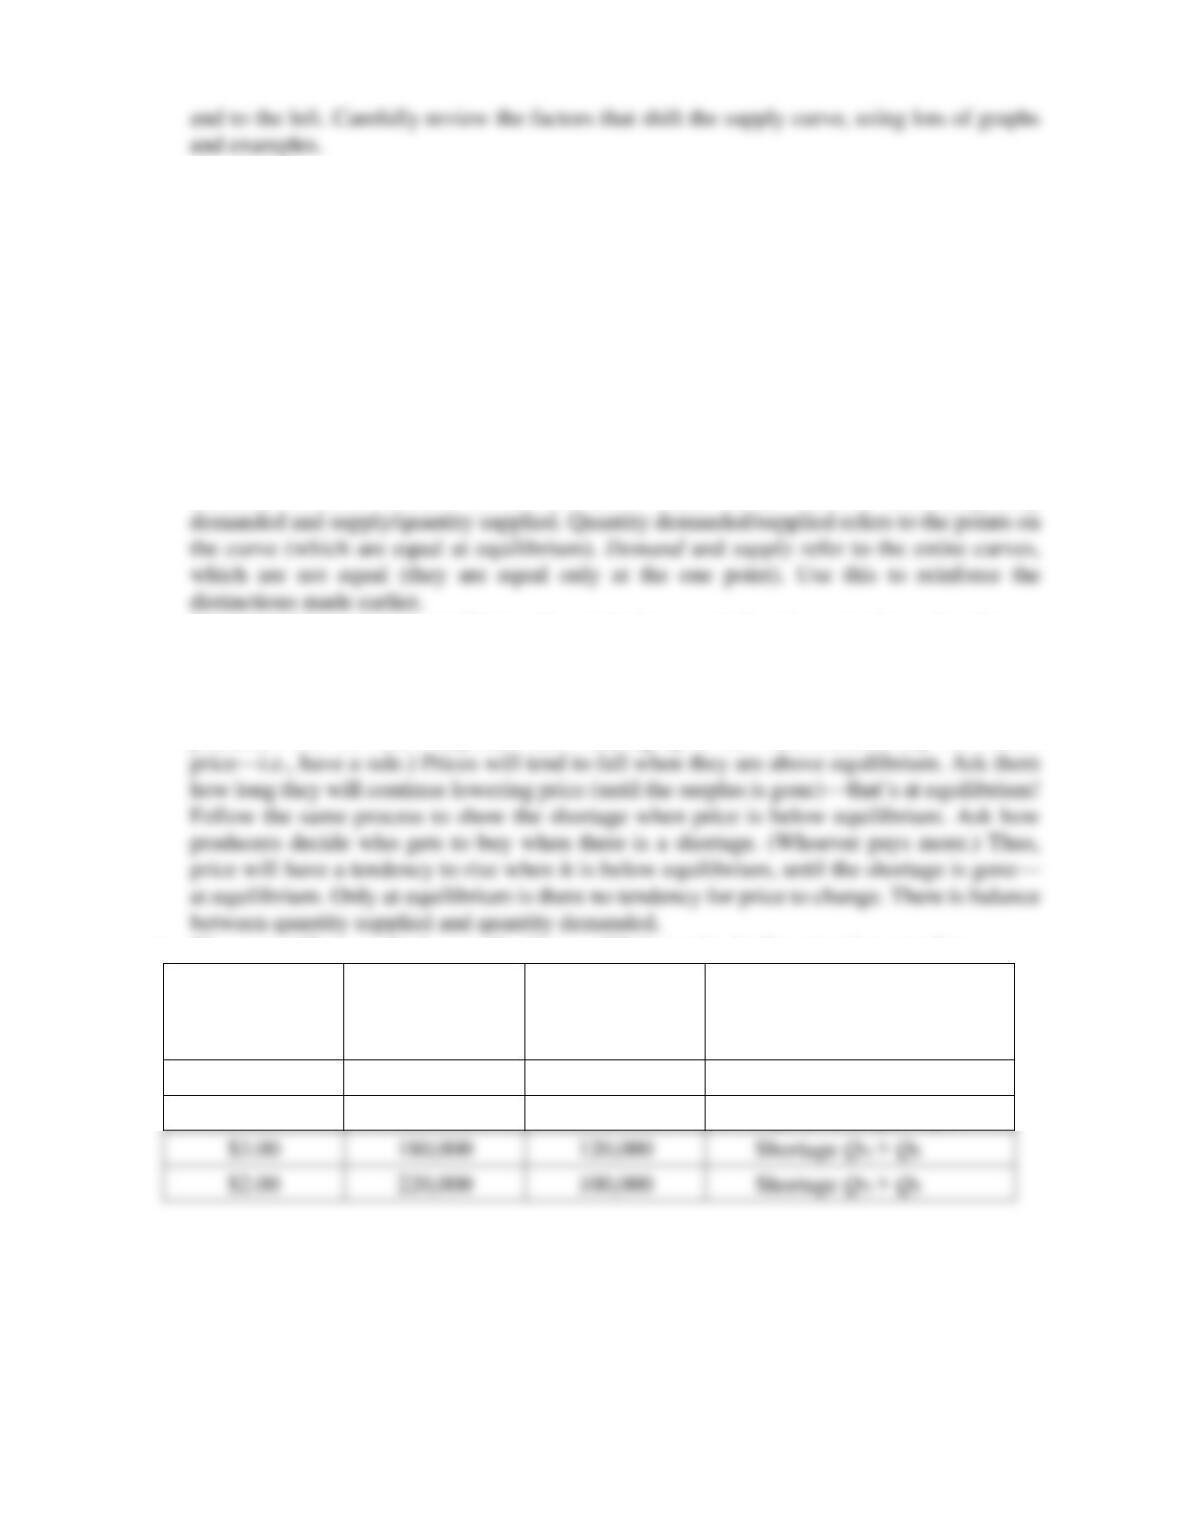
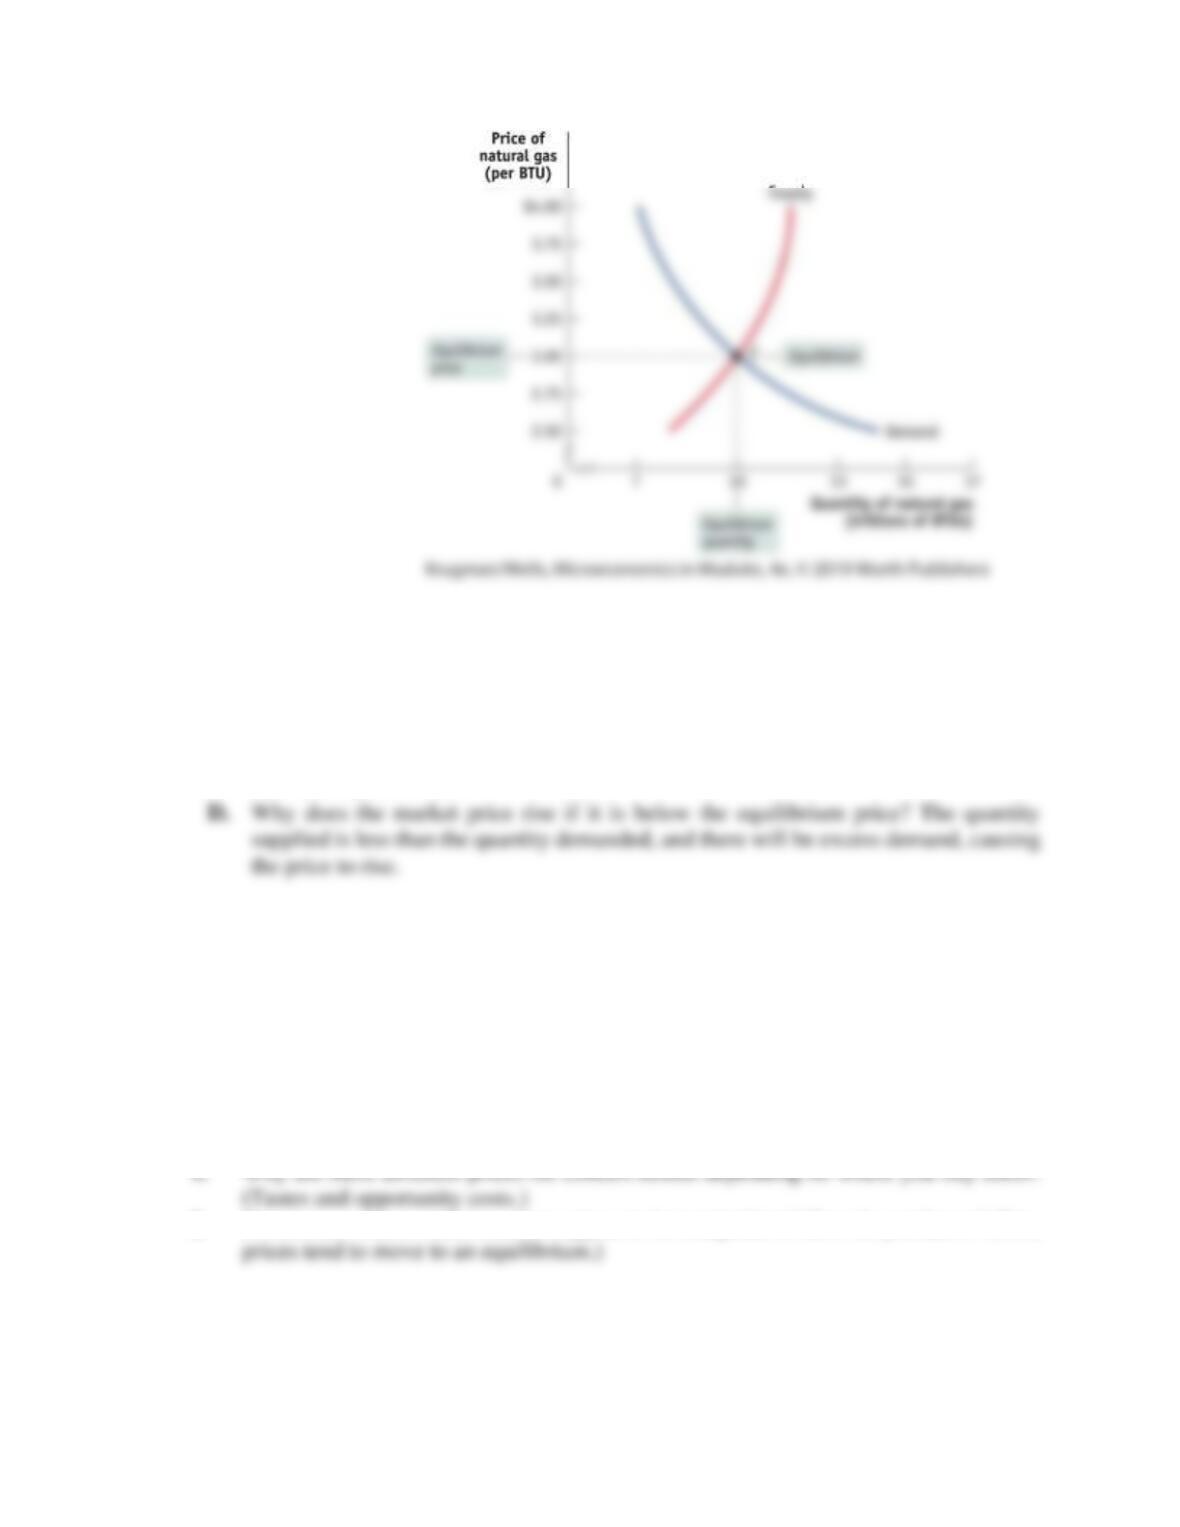
• Give a specific numerical example of an equilibrium price in the natural gas market.
Price
(per BTU)
Quantity
(cubic feet)
demanded
Quantity
(cubic feet)
supplied
$5.00
120,000
200,000
Surplus QS > QD
$4.00
160,000
160,000
Equilibrium QD = QS
$3.00
180,000
120,000
Shortage QD > QS
$2.00
220,000
100,000
Shortage QD > QS
Module Outline
I. The Supply Curve
Module 6 krugman 3
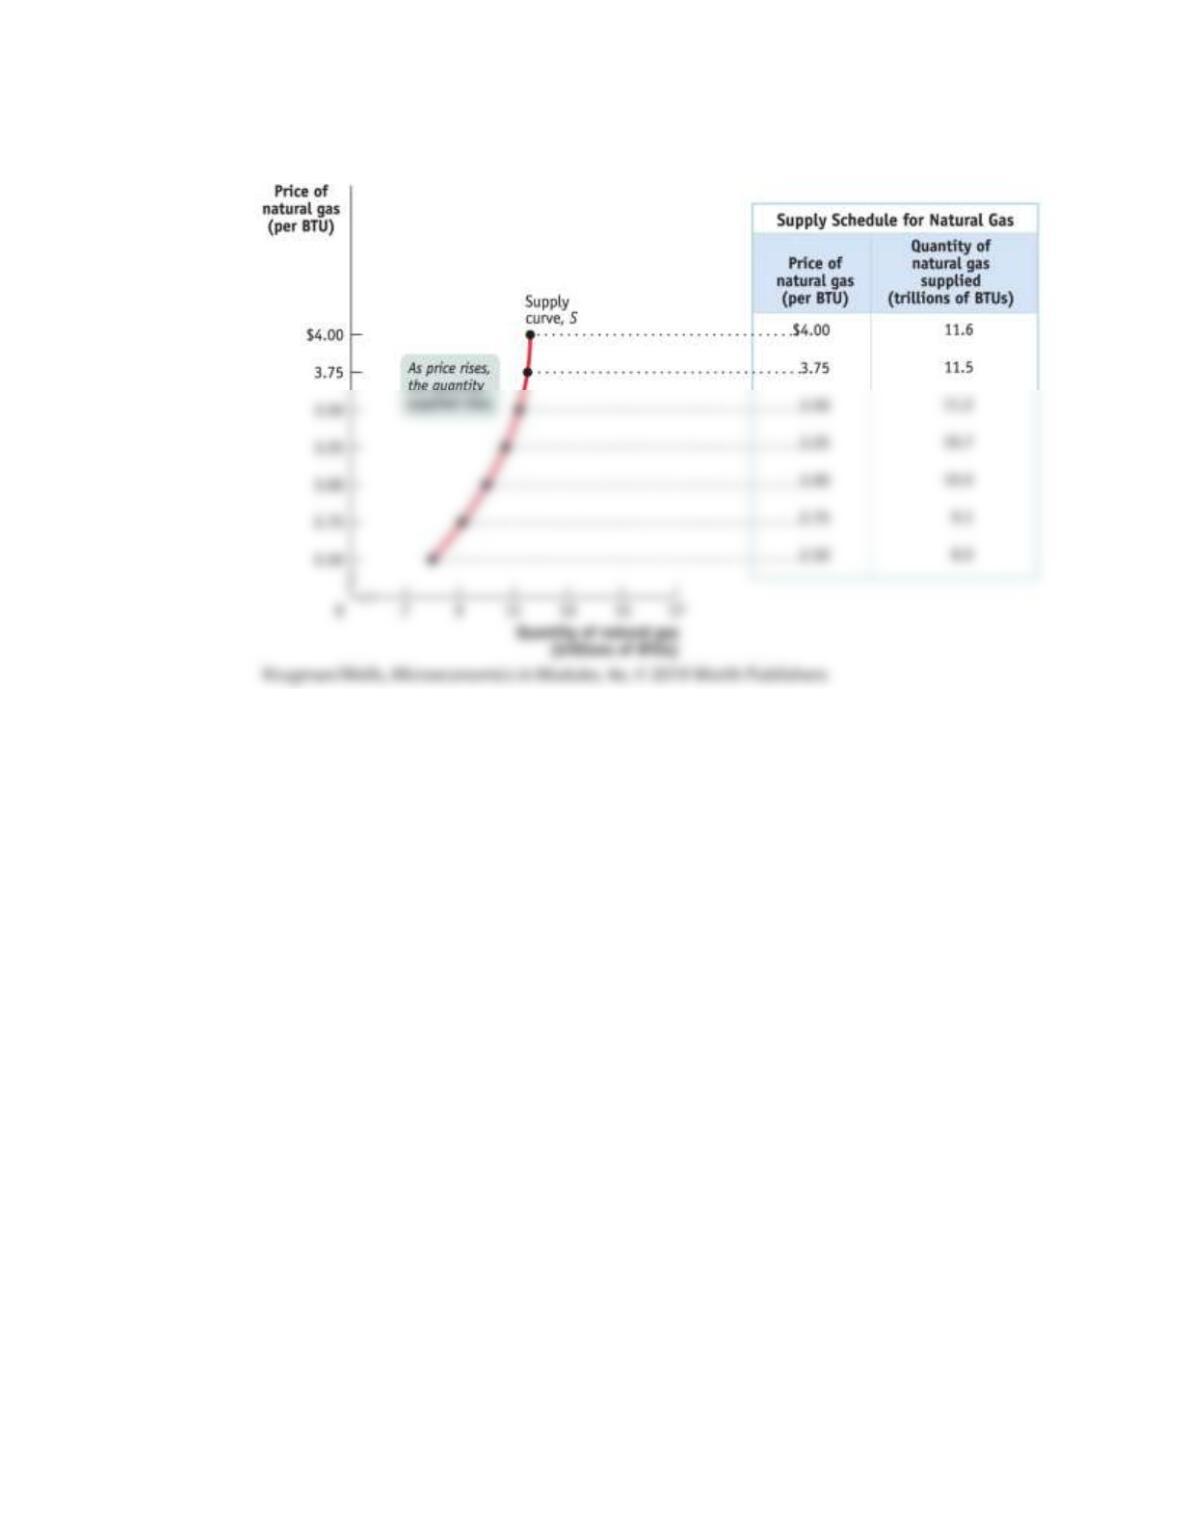
A. The supply schedule and supply curve are illustrated in text Figure 6-1, shown next.
Figure 6-1
B. The supply curve is usually upward sloping. The higher the price, the more people are
willing to sell.
C. An increase in supply is a rightward shift of the supply curve.
1. When people supply a larger quantity of a good or service at any given price,
supply increases.
2. If the price of the good changes, there is a movement along the supply curve.
D. The difference between a shift in the supply curve and movement along the curve is
illustrated in text Figure 6-3, shown next.
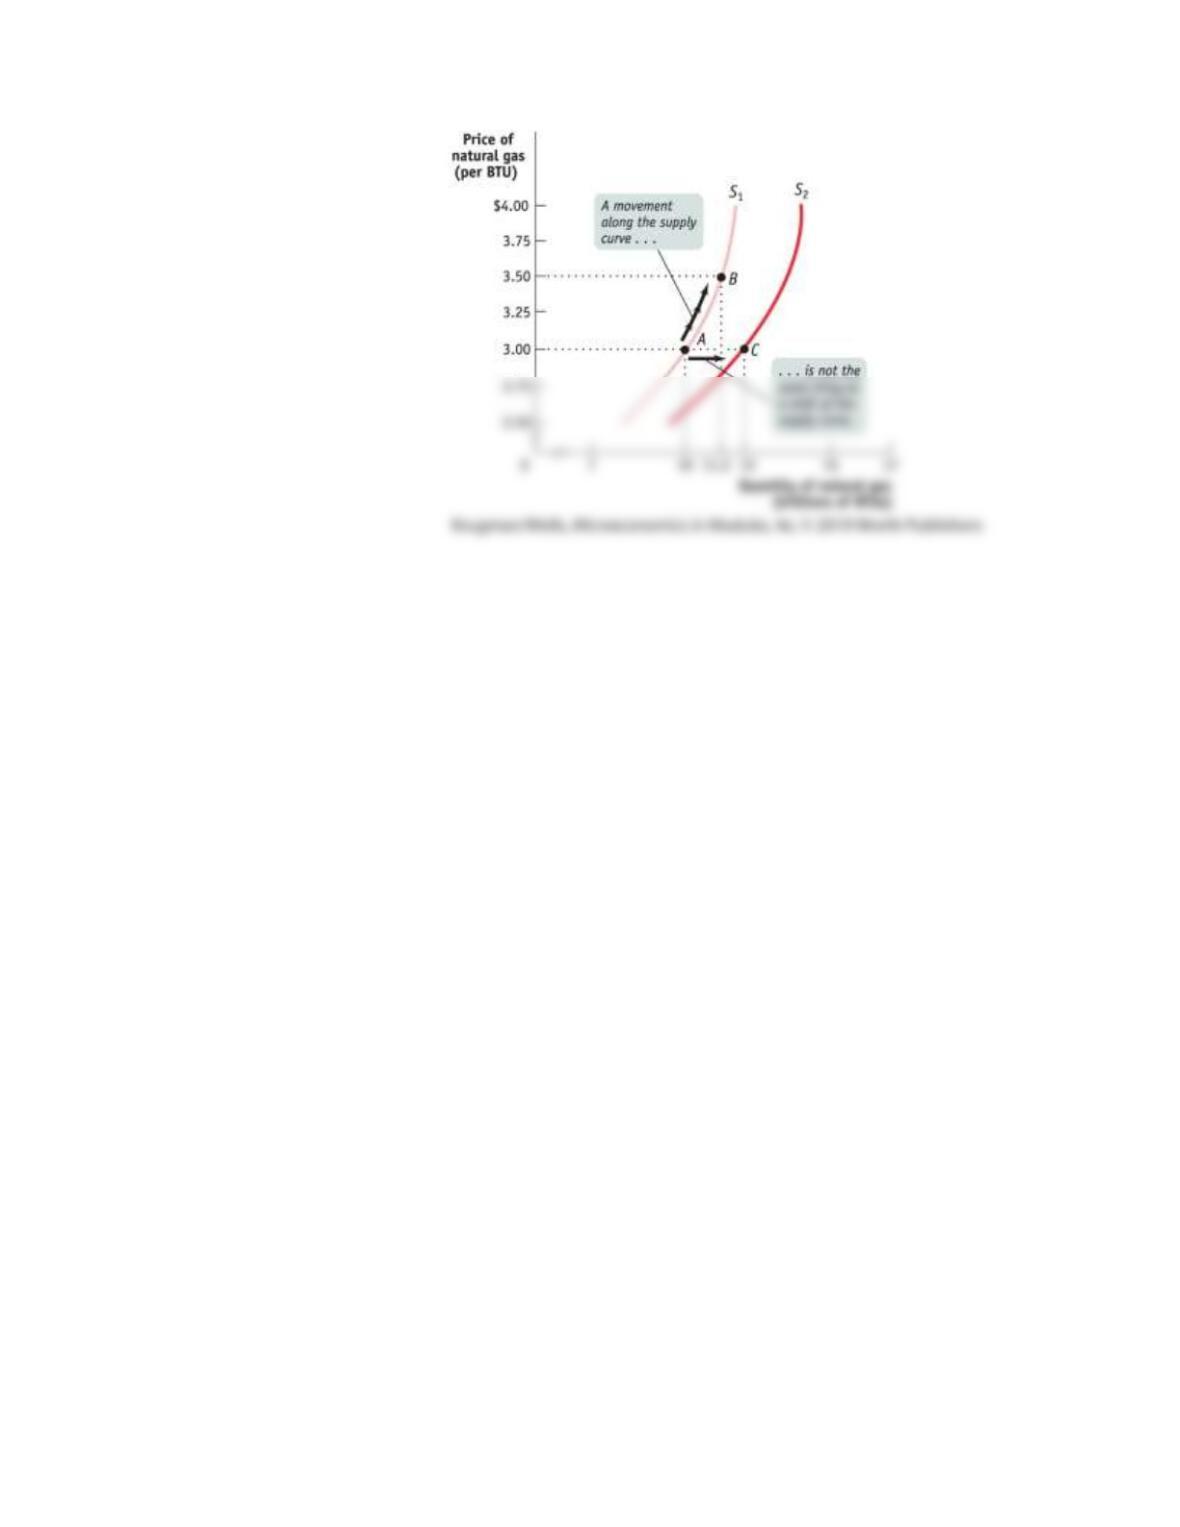
Module 6 krugman 4
Figure 6-3
E. Factors that shift the supply curve.
1. Changes in input prices
a. An increase in the price of an input will decrease supply.
2. Changes in the price of related goods or services
a. Two goods are substitutes in production when the producer can produce
either good with its resources, such as heating oil and gas, or small cars and
large cars.
b. Two goods are complements in production when production of one good
naturally gives rise to production of another good, such as natural gas and oil
from a well, or beef and leather.
3. Changes in technology
4. Changes in expectations
a. A change in the expected future price can lead a producer to supply more or
less today.
5. Changes in the number of producers
a. The market supply curve is the horizontal sum of the individual supply
curves.
II. Supply, Demand, and Equilibrium
A. A market equilibrium defines both the equilibrium price and the equilibrium quantity.
Market equilibrium is illustrated in text Figure 6-6 as shown next.
Module 6 krugman 5
Figure 6-6
B. Why do all sales and purchases in a market take place at the same price? In any market
where buyers and sellers are around for some time, they will observe which price
works best for them. If a seller is trying to charge above the equilibrium price, buyers
will shop elsewhere.
C. Why does the market price fall if it is above the equilibrium price? The quantity
supplied in the market is greater than the quantity demanded. Excess supply causes
the market price to fall.
Case Studies in the Text
Economics in Action
The Price of Admission—This EIA looks at the markets for concert tickets and explains why
different markets have different equilibrium prices for the tickets. Tastes and opportunity costs
help to explain the differences.
Ask students the following questions:
2. Do internet concert ticket markets appear to be competitive? How do you know? (Yes,
Web Resources

Module 6 krugman 6

Module 6 krugman 7
Handout 6-1
Date_________ Name____________________________ Class________ Professor________________
Consider the market for movie tickets. Ask three classmates “At a wage of $50 per hour, how
many hours (between 0 and 40) would you work a week?”
Continue questioning the same three students for each wage level in the chart below.
Wage
(per hour)
Number of
hours worked
each week (up
to 40)
Number of
hours worked
each week (up
to 40)
Number of
hours worked
each week (up
to 40)
Total
market
supply
schedule
Name of
Student 1
Name of
Student 2
Name of
Student 3
$50
30
20
10
5
2
Ask the classmates what other things they considered when deciding how many hours they
would work. Record their answers here.
What happens to the number of hours each student will work as the wage falls?
Module 6 krugman 8
Add the quantities of tickets hours each classmate will work at each wage level (i.e., add the
numbers across the rows. Record this sum in the last column.
Draw the market supply curve on the graph below. Be sure to label the axes.

Module 6 krugman 9
Handout 6-2
Date_________ Name____________________________ Class________ Professor________________
Shifts and Movements Along the Supply Curve
Decide whether the following examples indicate a shift of the supply curve or a movement along
the demand curve. Mark the correct column.
Example
Movement along
the supply curve
A shift in the
supply curve
1. As home prices rise, more people put out a
For Sale sign.
2. Personal bankruptcies rise with the recession,
forcing homeowners to sell.
3. College grads avoid teaching jobs as starting
salaries fall.
4. Worsening working conditions in urban
schools chase away prospective teachers.
5. As the price of airline tickets rises, airlines
add more flights.
6. The price of jet fuel drops and airlines
expand the number of flights.