Module 5 krugman 1
Module 5
Demand
What’s New in the Fourth Edition?
• Enhanced in-class activities and handouts
Module Objectives
• What is a competitive market?
• What is a demand curve?
• What are the differences between the movements along the demand curve and changes in
demand?
• What are the factors that shift the demand curve?
Teaching Tips
The Demand Curve
Creating Student Interest
• Pair up students and ask: What did you buy recently, and why? Then ask a few pairs to report.
List on the board the various factors that influenced their decisions. These will range from
“it was convenient” to “I wanted it.” Often, students will say they “needed” to buy something.
However, if you ask them if they had a substitute, they will understand that they preferred
the item. From the list on the board, it is clear that price is just one of many factors that can
influence demand. Indicate that we will focus on price first and how it influences the amount
consumers want to buy.
Presenting the Material
• Help students understand the idea that points on the demand curve represent how much a
person is willing to pay for a good or service. (Handout 3-1 provides students a place to
record this information and answer questions on their own.)
Consider the market for movie tickets. Ask for three volunteers. Ask each student “At a
price of $10 per movie ticket, how many tickets would you buy in a month?” Allow them
to believe that there are an ample number of movies they will want to see in the theater and
that they should include tickets for friends to go with them, if they want to buy those.
Continue questioning the same three students for each price level in the chart below. At
the end of the exercise, show them how the number of tickets “purchased” increases as the
price goes down. Ask the students who volunteered what other things they considered
when they decided how many tickets they would buy (time, income, other things they could
do with their time and income). Then, complete the exercise by showing how a market
demand curve can be constructed by adding up the number of tickets at each price level.
Draw the demand curves on a graph and show the horizontal sum of the individual demands
to make the market demand.
Module 5 krugman 2
Price
(per ticket)
Quantity
(tickets)
demanded
per month
Quantity
(tickets)
demanded
per month
Quantity
(tickets)
demanded
per month
Total
market
demand
schedule
Student 1
Student 2
Student 3
$10
8
6
4
2
0
Common Student Pitfalls
• Demand versus quantity demanded. Students often confuse a change in quantity
Module Outline
I. Supply and Demand: A Model of a Competitive Market
A. The model of supply and demand has six key elements: the demand curve, the supply
curve, the factors that cause the demand curve to shift, the factors that cause the supply
curve to shift, the market equilibrium, and the way the equilibrium changes when
supply or demand changes.
II. The Demand Curve
A. The demand schedule and demand curve are illustrated in text Figure 5-1, shown
below.
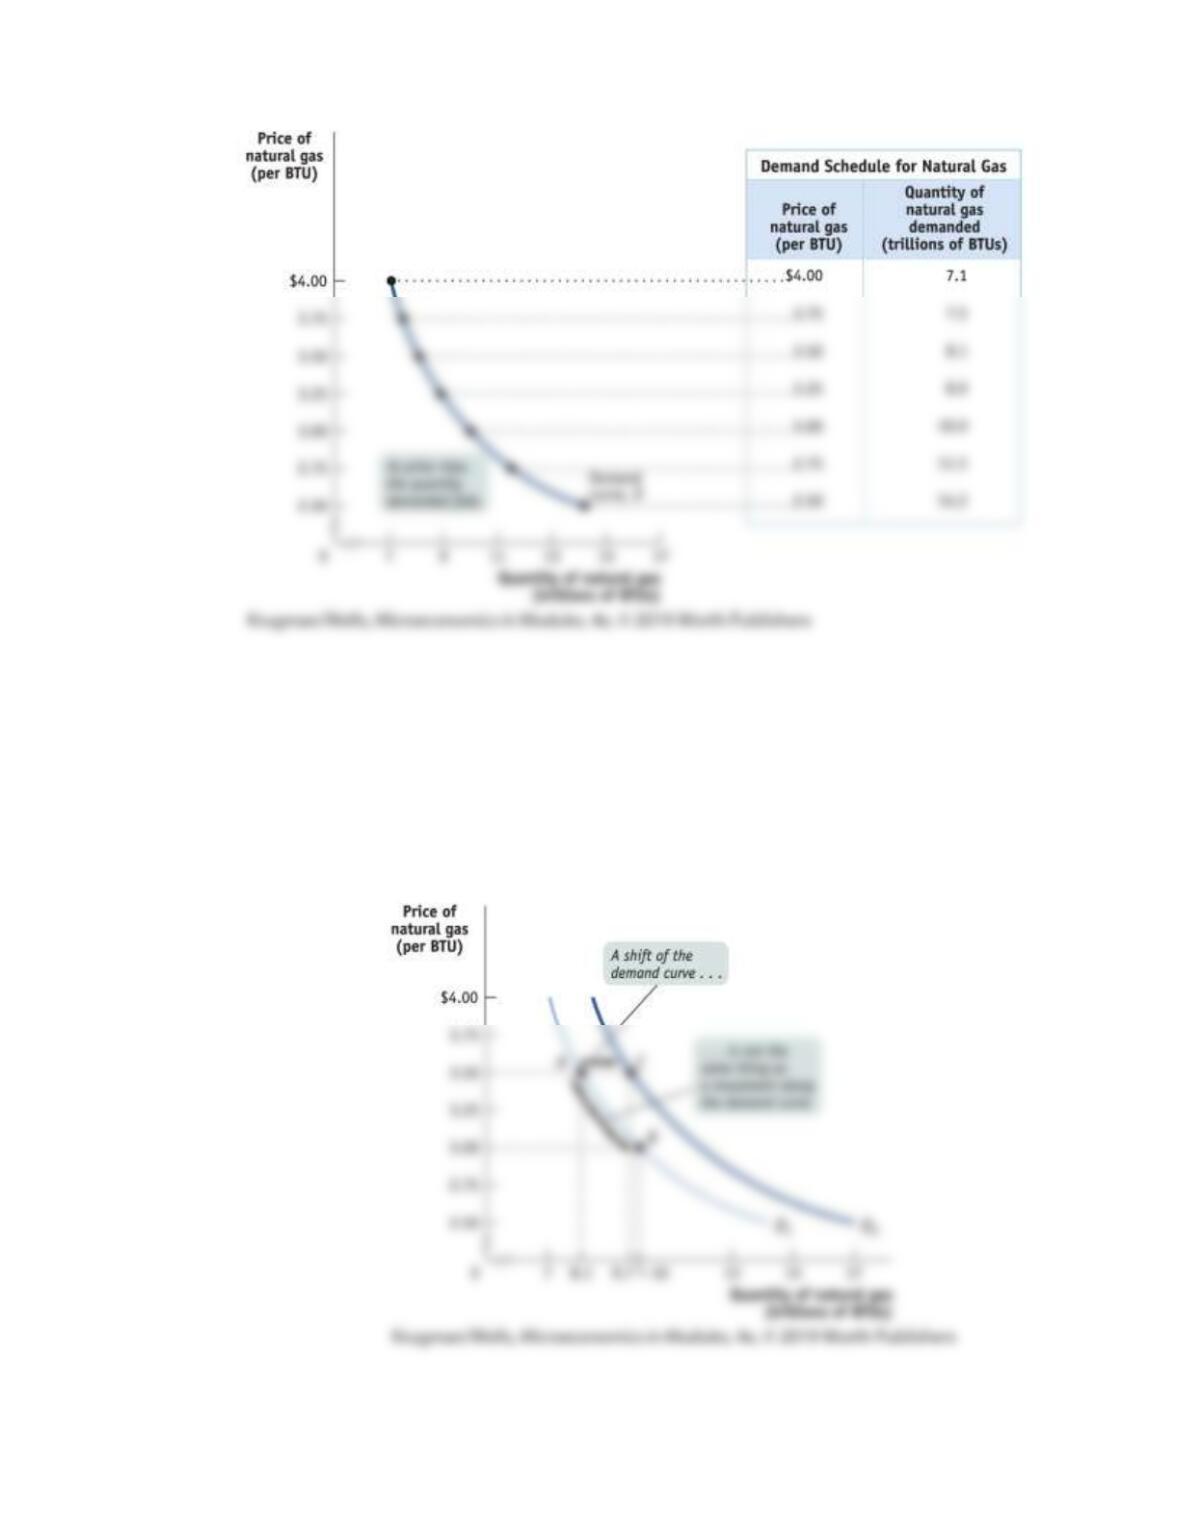
Module 5 krugman 3
Figure 5-1
B. Demand curves almost always slope downward, as suggested by the law of demand.
C. An increase in demand is a rightward shift of the demand curve.
1. When consumers demand a larger quantity of a good or service at any given
price, demand increases.
D. The difference between a shift of the demand curve and movement along the demand
curve is illustrated below in text Figure 5-3.
Figure 5-3
Module 5 krugman 4
E. Factors that shift the demand curve.
1. Changes in the prices of related goods
a. If the goods are substitutes, a rise in the price of one of the goods leads to
an increase in the demand for the other good.
b. If the goods are complements, a rise in the price of one of the goods leads
to a decrease in demand for the other good.
2. Changes in income
a. An increase in income increases the demand for a normal good and decreases
the demand for an inferior good.
3. Changes in tastes
4. Changes in expectations
a. If the price of a good is expected to rise in the future, this will increase the
current demand for the good.
Case Studies in the Text
Economics in Action
Beating the Traffic—This EIA uses an auto trip to the center city as a “good” to explain how cities
attempt to address traffic congestion. Examples include decreasing the price of substitutes
(subsidizing mass transit), increasing the price of complements (increasing the costs for parking
and taxes), and increasing the price of driving by means of the adoption of a “congestion charge.”
Ask students the following questions:
1. How can a city reduce the demand for traffic by lowering the price of a substitute?
2. How can a city reduce the demand for traffic by raising the price of a complementary
3. As a result, show graphically what happens to the demand for the highway. (The
Global Comparison
Pay More, Pump Less—The law of demand is illustrated using differences in gasoline prices
between countries. As gas prices increase in a country (in part, due to taxes), gasoline consumption
decreases.
Web Resources

Module 5 krugman 5
Useful examples for teaching supply and demand can be found on this website:
Module 5 krugman 6
Handout 5-1
Date_________ Name____________________________ Class________ Professor________________
Consider the market for movie tickets. Ask three classmates “At a price of $10 per movie ticket,
how many tickets would you buy in a month?” Allow them to believe that there are an ample
number of movies they will want to see in the theater and that they should include tickets for
friends to go with them, if they want to buy those.
Continue questioning the same three students for each price level in the chart below.
Price
(per ticket)
Quantity
(tickets)
demanded
per month
Quantity
(tickets)
demanded
per month
Quantity
(tickets)
demanded
per month
Total
market
demand
schedule
Name of
Student 1
Name of
Student 2
Name of
Student 3
$10
8
6
4
2
0
Ask the classmates what other things they considered when deciding how many tickets they
would buy. Record their answers here.
Module 5 krugman 7
Draw the market demand curve on the graph below. Be sure to label the axes.

Module 5 krugman 8
Handout 5-2
Date_________ Name____________________________ Class________ Professor________________
Shifts and Movements Along the Demand Curve
Decide whether the following examples indicate a shift of the demand curve or a movement
along the demand curve. Mark the correct column.
Example
Movement along
the demand curve
A shift in the
demand curve
1. Mammoth Mountain hikes the price for ski
tickets and sales plummet.
2. Lack of snow keeps the skiers away.
3. An increase in the excise tax on cigarettes
causes younger smokers to quit.
4. Cutting cigarette ads from TV causes
cigarette smoking among teens to fall.
5. Nike sales fall as Skechers shoes gain
popularity.
6. Teens have had it with the high price of Nike
Air Jordans.
7. Mortgage rates are at an all-time low, and
new home loan applications soar.
8. A booming economy spurs home sales.