
Module 26 krugman 1
Module 26
Long–Run Outcomes in Perfect Competition
What’s New in the Fourth Edition?
• Updated cases
• Handouts to use in the classroom
Module Objectives
• Why does it make sense for a firm to behave differently in the short run versus the long run?
• How does the short-run industry supply curve differ from the long-run industry supply curve?
Teaching Tips
The Perfectly Competitive Industry Supply Curve
Creating Student Interest
• Ask students, “If you are a business person – an entrepreneur – standing outside a market in which
the businesses that operate are making a profit, and that business is easy to get into, what would
you do?” You will probably get a response like, “start a business.” Then, ask them to play that out
in a supply and demand graph. Ask them what happens when new firms enter a market…does
supply change? How? Draw the graph and ask what happens to price. When they reply that the
price falls, ask when new firms will stop entering. They should respond that they will stop when
there is no more profit. Also tie in the fact that losses will eventually cause firms to exit an
industry.
Presenting the Material
• Use Handout 26-1 to helps students see the process of building an industry supply curve.
• Use a simple example to illustrate what happens to the supply curve when firms enter or exit an
industry. Start with a cost curve graph and identify the shutdown price, a price at which firms will
exit in the long run, the break-even price, and a price at which firms will enter in the long run.
Identify the quantity of output produced at each given price (make up some simple numbers).
Assume that all firms are identical. Now draw the industry supply curve assuming there are 10, 20,
or 30 firms in the industry.
After explaining the industry supply curve, go back to the market supply and demand graph and
work through some examples. Here are some ideas:
o Start with a price that has all firms earning positive profit and show how long-run
equilibrium is achieved. Show what happens to profit on the cost curve graph as
firms enter.
Module 26 krugman 2
Module Outline
I. The Perfectly Competitive Industry Supply Curve
A. The industry supply curve shows the relationship between the price of a good and the total
output of the industry as a whole.
B. The short-run industry supply curve shows how the quantity supplied by an industry depends
on the market price, given a fixed number of producers.
1. There is a short-run market equilibrium when the quantity supplied equals the quantity
demanded, taking the number of producers as given.
C. The long-run industry supply curve
1. A market is in long-run market equilibrium when the quantity supplied equals the
quantity demanded, given that sufficient time has elapsed for entry into and exit from
the industry to occur.
a. In the long-run market equilibrium, no producer has an incentive to enter or exit.
2. The long-run industry supply curve shows how the quantity supplied responds to the
price once producers have had time to enter or exit the industry.
a. The long-run industry supply curve is often horizontal, although it may be upward
sloping when a necessary input is in limited supply.
b. The long-run industry supply curve is always more elastic than the short-run
industry supply curve because of the entry and exit of producers.
3. In practice, we see that an increase in demand initially leads to a large price increase.
However, if the long-run industry supply curve is horizontal, prices return to their
initial level once new firms have entered the industry.
4. In reverse, a fall in demand reduces prices in the short run. If the long-run industry
supply curve is horizontal, prices return to their initial level as producers exit the
industry.
D. The cost of production and efficiency in long-run equilibrium
1. In a perfectly competitive industry in equilibrium, the value of marginal cost is the
same for all firms.
Case Studies in the Text
Economics in Action
Thirsty? From Global Wine Glut to Shortage—This EIA discusses oversupply in the wine industry from
2004–2010, followed by a shortage in 2012.

Module 26 krugman 3
Ask students the following questions:
Web Resources
Module 26 krugman 4
Handout 26-1
Date_________ Name____________________________ Class________ Professor________________
Constructing an Industry Supply Curve
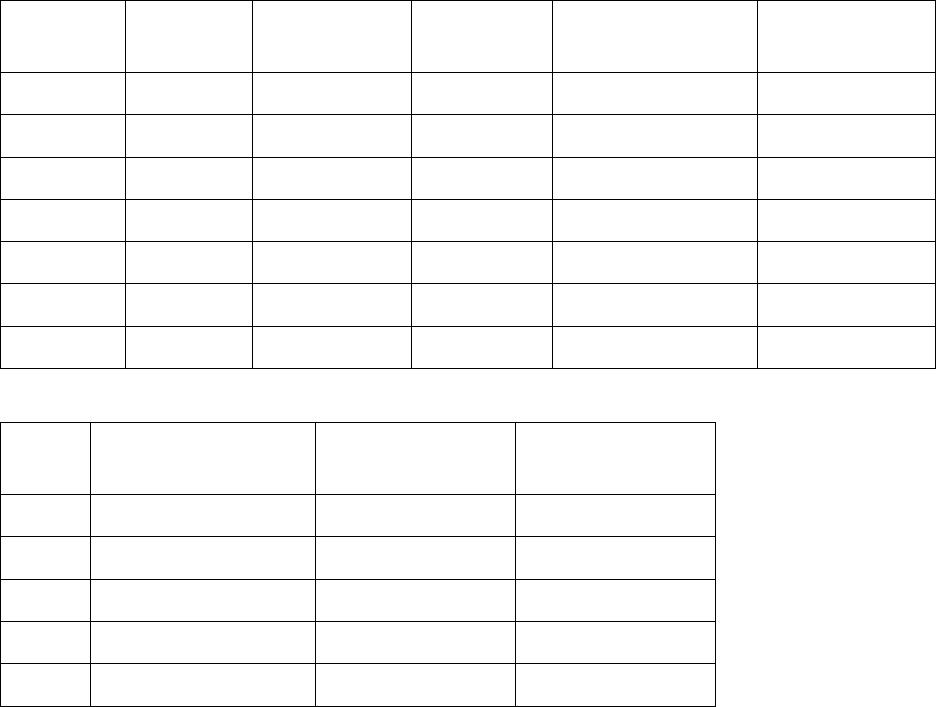
A competitive firm has the following short-run total cost.
Quantity
Total cost
Marginal cost
Variable
cost
Average variable
cost
SR Industry
Supply
0
$10
1
20
2
26
3
36
4
50
5
68
6
90
The market demand for this product is as follows:
Price
Quantity demanded
Firm supply
SR industry
supply
$12
200
3
300
10
300
3
300
8
400
2
200
6
500
2
200
4
600
0
0
1. Complete the table on costs.
2. How much is the fixed cost?
3. Calculate the firm’s supply at each possible price.
Module 26 krugman 5
4. There are 100 firms in this industry and all have identical costs. Construct the short–
run industry supply curve. In the same diagram, draw in the demand curve.
5. What is the market price? Equilibrium quantity?
6. Will there be entry or exiting of firms?
Module 26 krugman 6
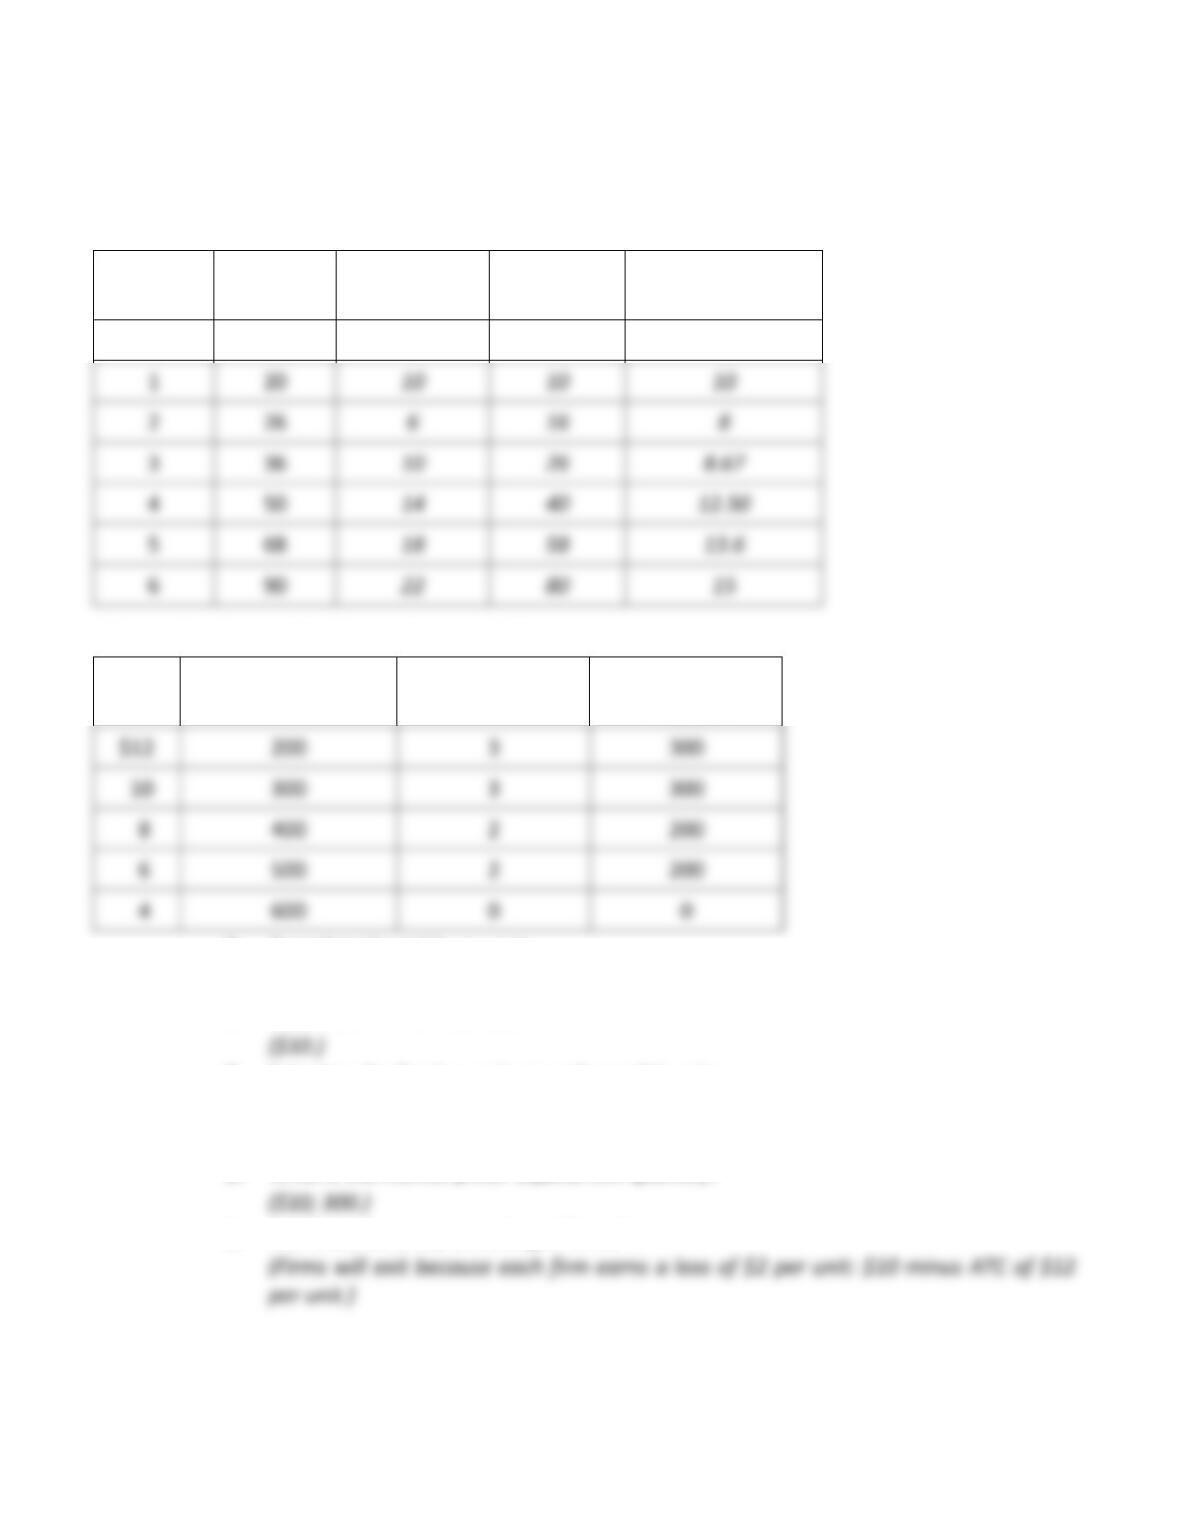
Answers
A competitive firm has the following short-run total cost.
Quantity
Total cost
Marginal cost
Variable
cost
Average variable
cost
0
$10
—
0
The market demand for this product is as follows:
Price
Quantity demanded
Firm supply
SR industry
supply
1. Complete the table on costs.
See table.
2. How much is the fixed cost?
3. Calculate the firm’s supply at each possible price.
4. There are 100 firms in this industry and all have identical costs. Calculate the short–
run industry supply curve.
5. What is the market price? Equilibrium quantity?
6. Will there be entry or exiting of firms?
1
2
3
4
6