Module 25 krugman 1
Module 25
Graphing Perfect Competition
What’s New in the Fourth Edition?
• Updated cases
Module Objectives
• How do we use graphs to determine a perfectly competitive firm’s production decision?
• What determines a perfect competitor’s economic profit or loss?
• When should a perfectly competitive firm shut down in the short run?
Teaching Tips
Perfect Competition
Creating Student Interest
• Ask students, “What is the goal of a firm?” You will probably get a response like, “to make
money.” Push them to be more specific: “What do you call the money that a firm makes?” Here
you need to make sure they distinguish between revenue and profit. Finally, make sure they
understand the goal is to maximize profit—not just earn some. (Be sure to note that some firms
may have other goals—nonprofit firms or firms that also have social goals.) But point out that
many (most?) firms have the goal of maximizing profits and that is the assumption of our models.
• Now ask students to imagine they are opening a business. How should they decide what and where
to produce? Some students are likely to suggest producing a good in some location where they can
make a profit or where there is not a lot of competition. This can serve as a preview for the idea
that firms will enter industries in which existing firms are earning a positive profit. Next ask
students what happens if profit is zero or negative? Many are sure to have forgotten about
accounting versus economic profit and will interpret zero or negative profit as bad. Remind
students of the difference between economic and accounting profit before moving on. For
example, accounting profit can be positive even though economic profit is negative.
Presenting the Material
• Draw a cost curve graph to illustrate average total cost and marginal cost. Draw in a market price
that lies above ATC and explain that the firm can produce and sell all they want at this going
market price. Remind them that price is equal to marginal revenue. Identify the profit-maximizing
output.
• Students should be able to identify total revenue on the graph because they know total revenue is
equal to price times quantity. Highlight this large box for them. Now ask them to define how
average total cost is measured. From here you can show that total cost is equal to average total cost
times quantity, and you can highlight this box on the graph. Next you can identify profit on the
graph, and explain that price minus average total cost is the profit per unit sold.
• Draw several more cost curve graphs using different prices and identify the profit-maximizing
output and the area that represents profit on the graph. Think of these as different cases. Case 1 has
a price greater than ATC and firms will enter the industry. Case 2 has a price equal to ATC,
Module 25 krugman 2
representing long-run equilibrium. Case 3 has a price lower than ATC but higher than AVC. Firms
will shut down in the long run and exit the industry. For Case 4 you will need to draw in the
average variable cost curve and explain why the firm will shut down in the short run if price is
lower than AVC. In the end, students are using only the one graph to explore production and profit.
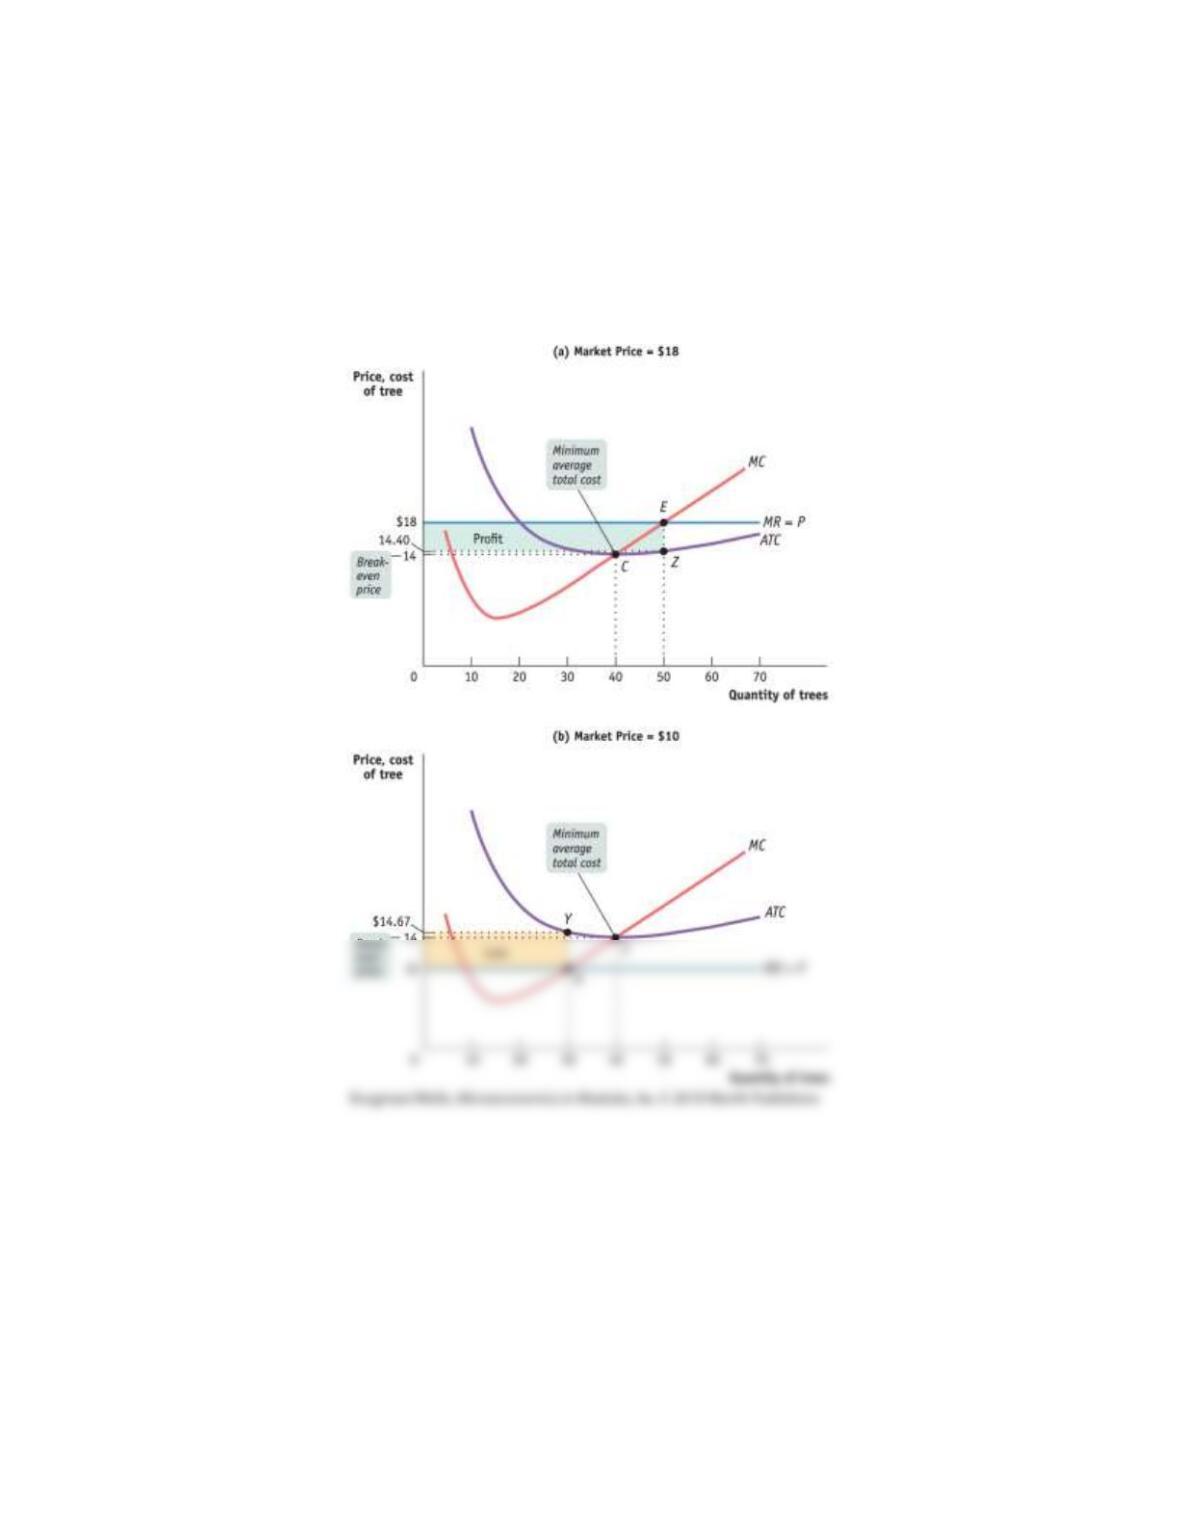
Case 1 and Case 3 are illustrated in the two graphs provided here.
Figure 25-1
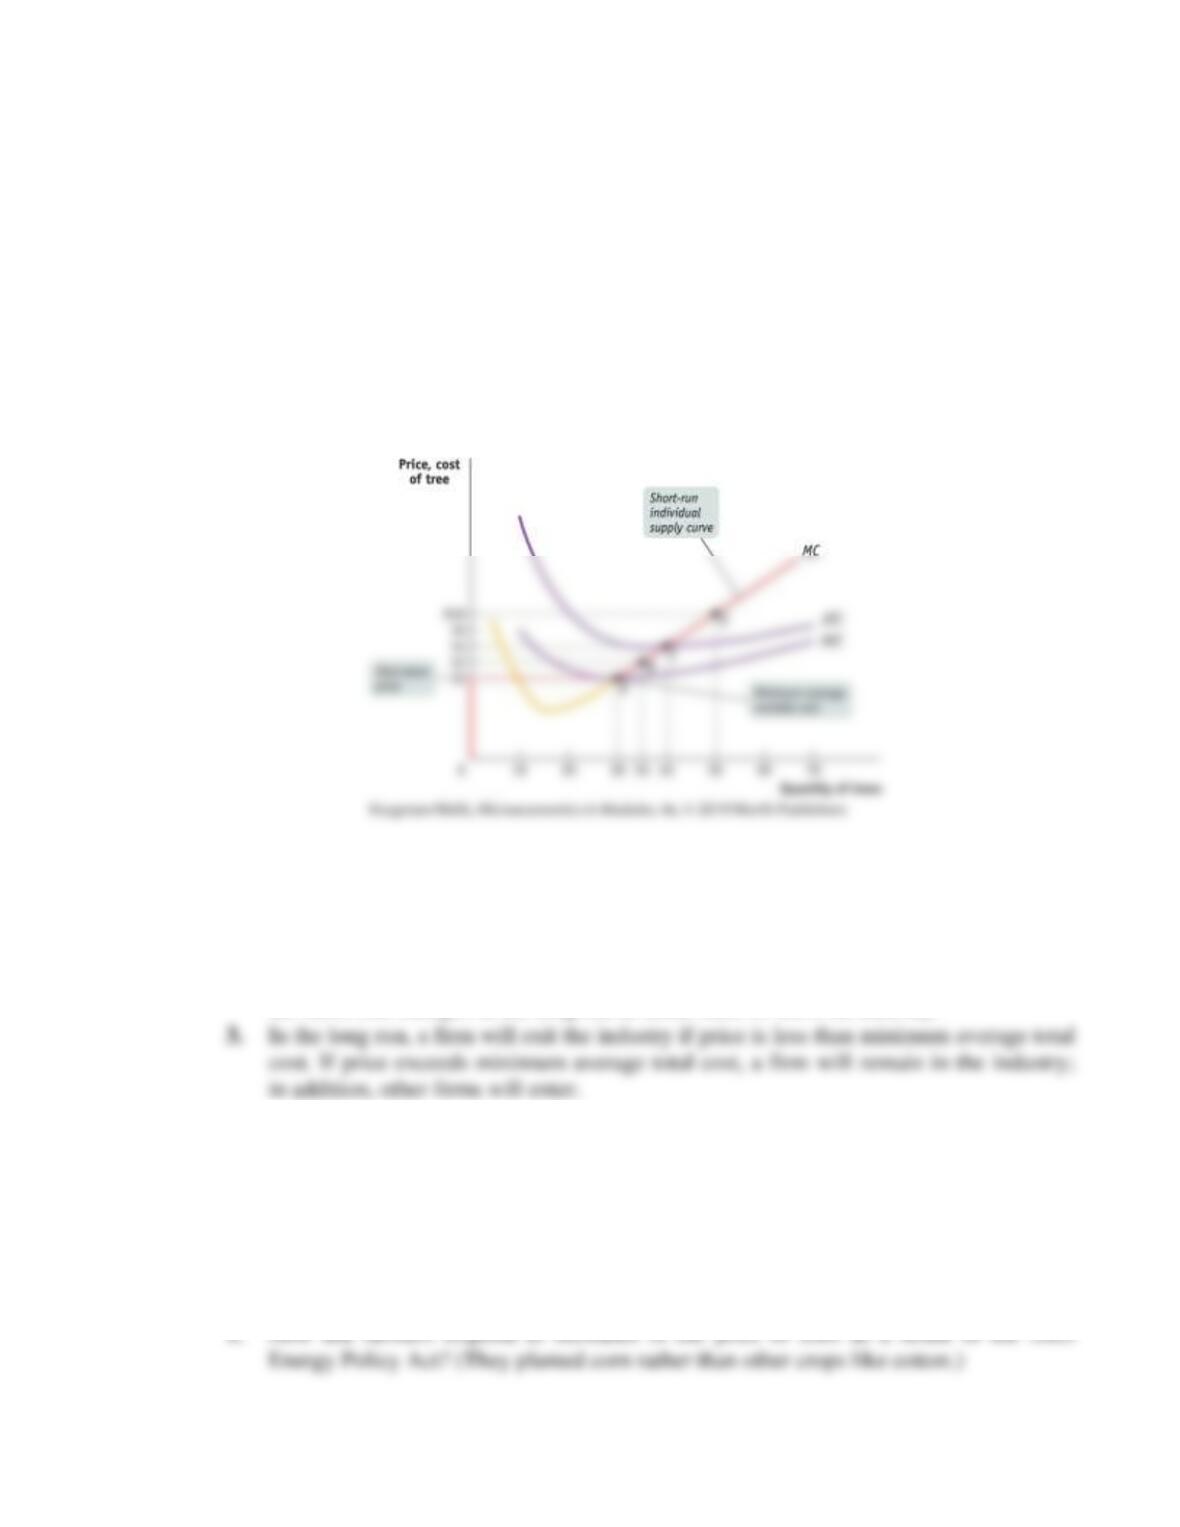
Going through the different cases should help students to see that the short-run individual supply
curve is the marginal cost curve beginning where MC intersects AVC. The short-run individual
supply curve also has a vertical portion running along the vertical axis from the origin up to the
shut-down price.
Module 25 krugman 3
Module Outline
I. Graphing perfect competition
A. Total profit can be expressed in terms of profit per unit.
B. The break-even price of a price-taking firm is the market price at which it earns zero profits.
C. The rule for determining whether a producer of a good is profitable depends on a comparison
of the market price of the good to the producer’s break-even price—its minimum average total
cost.
1. Whenever market price exceeds minimum average total cost, the producer is profitable.
Figure 25-1 (a) shows this situation.
Figure 25-1(a)
2. Whenever the market price equals minimum average total cost, the producer breaks even.
3. Whenever market price is less than minimum average total cost, the producer is
unprofitable. Figure 25-1(b) shows this situation.
Figure 25-1(b)
Module 25 krugman 4
D. The short-run production decision
1. Fixed cost is irrelevant to the firm’s optimal short-run production.
2. A firm will cease production in the short run if the market price falls below the shut-
down price, which is equal to minimum average variable cost.
3. When market price exceeds a firm’s minimum average variable cost, the price-taking
firm produces the quantity of output at which marginal cost equals price.
4. The short-run individual supply curve shows how an individual producer’s optimal
output quantity depends on the market price, taking fixed cost as given. Figure 25-2
shows the short-run individual supply curve.
Figure 25-2
a. The short-run individual supply curve corresponds to the marginal cost curve at
market prices above the shut-down price.
E. The long run: changing fixed cost, entry and exit
1. Fixed cost matters in the long run.
2. In most perfectly competitive industries, the number of producers, although fixed in
the short run, changes in the long run as firms enter or leave an industry.
Case Studies in the Text
Economics in Action
Farmers Know How—This EIA uses the corn market and ethanol production as examples of how
perfectly competitive markets respond to changes in the market.
Ask students the following questions:

Module 25 krugman 5
2. In the long run, how did the Energy Policy Act affect individual farmers’ profits?
Web Resources