Module 21 krugman 1
Module 21
Firm Costs
What’s New in the Fourth Edition?
• Updated cases
• Handouts to use in the classroom
Module Objectives
• What types of costs does a firm face?
• How does the firm generate its marginal cost and average cost curves?
• Why do a firm’s costs differ in the short run and in the long run?
Teaching Tips
From the Production Function to Cost Curves
Presenting the Material
• Present the material with a hands-on example. Using Handout 21-2, show students how to “produce
a widget”—this is done by folding a piece of paper twice and stapling it. Either give each student
a copy of the table that follows, or present the table on the board. Tell the students that you are
going to collect data and calculate production and cost values and that each production period will
last 30 seconds. Assemble the capital at the front of the room and add zero workers. Time 30
seconds and watch the capital produce zero widgets. Enter the data on the worksheet and calculate
the various values. Now add a worker (a volunteer from the class). Repeat the process until Handout
21-1 is completed. Note when diminishing returns sets in. You can also have students graph the
data to see the extent to which the graph of the data has the expected shapes.
Two Key Concepts: Marginal Cost and Average Cost
Creating Student Interest
• Explain the difference between average and marginal using one of the following examples. Use the
students’ grades to explain average and marginal, tailoring the example to fit your class syllabus.
(The students have a lot of practice calculating their grades!) For example, if students have three
equally weighted exams that determine their course grade, their average grade is found by totaling
the scores from the three exams and dividing the total by the number of exams. An average is always
the total divided by the number of items—and this works for costs, too. If, for example, a student
has taken two exams and scored a 75 and a 95, the average is (75 + 95)/2 = 170/2 = 85.
• Now you can introduce the concept of marginal. If the marginal or next exam score is 90, what will
happen to the student’s average? (It will increase to [75 + 95 + 90]/3 = 260/3 = 86.7.) What if the
Module 21 krugman 2
• Online grocery delivery services charge a flat fee to deliver groceries. Ask students: Why do
Presenting the Material
• Use Handout 21-3 to present the concepts of average costs. Going through the cost calculations
with the students is important because it helps them understand the different cost concepts. It is
Module Outline
I. From the production function to cost curves
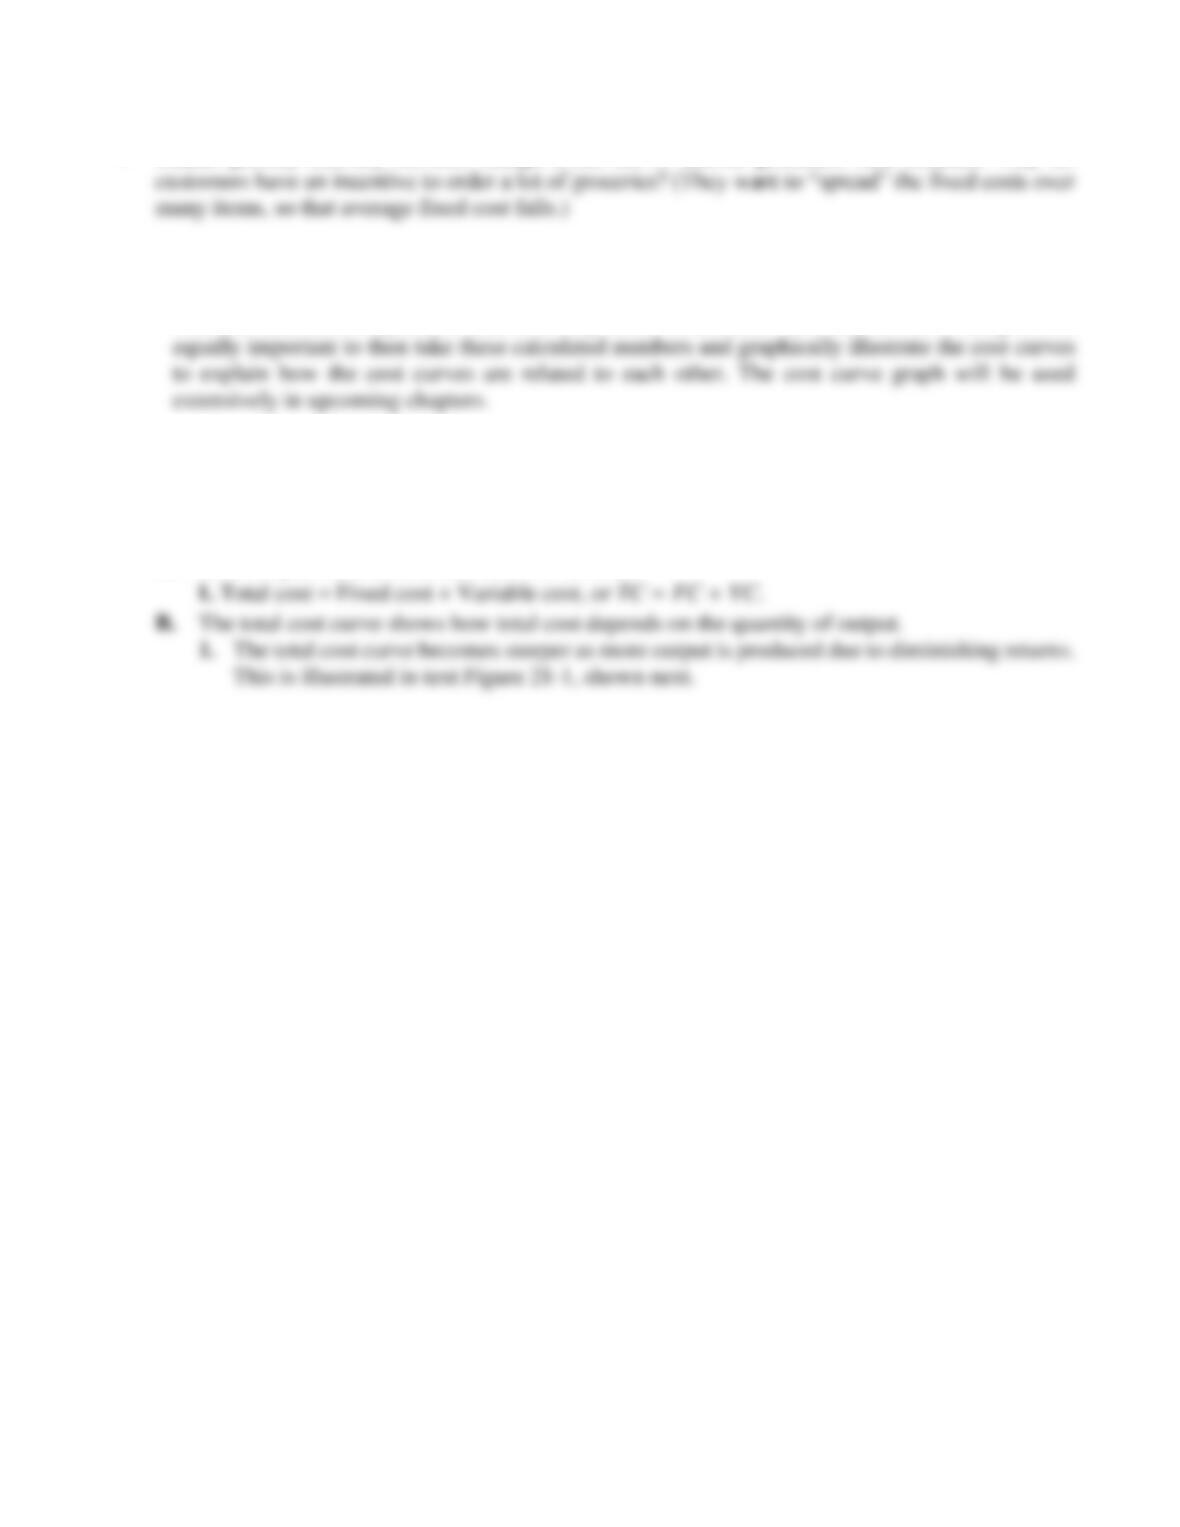
A. Costs of production are either fixed or variable.
Module 21 krugman 3
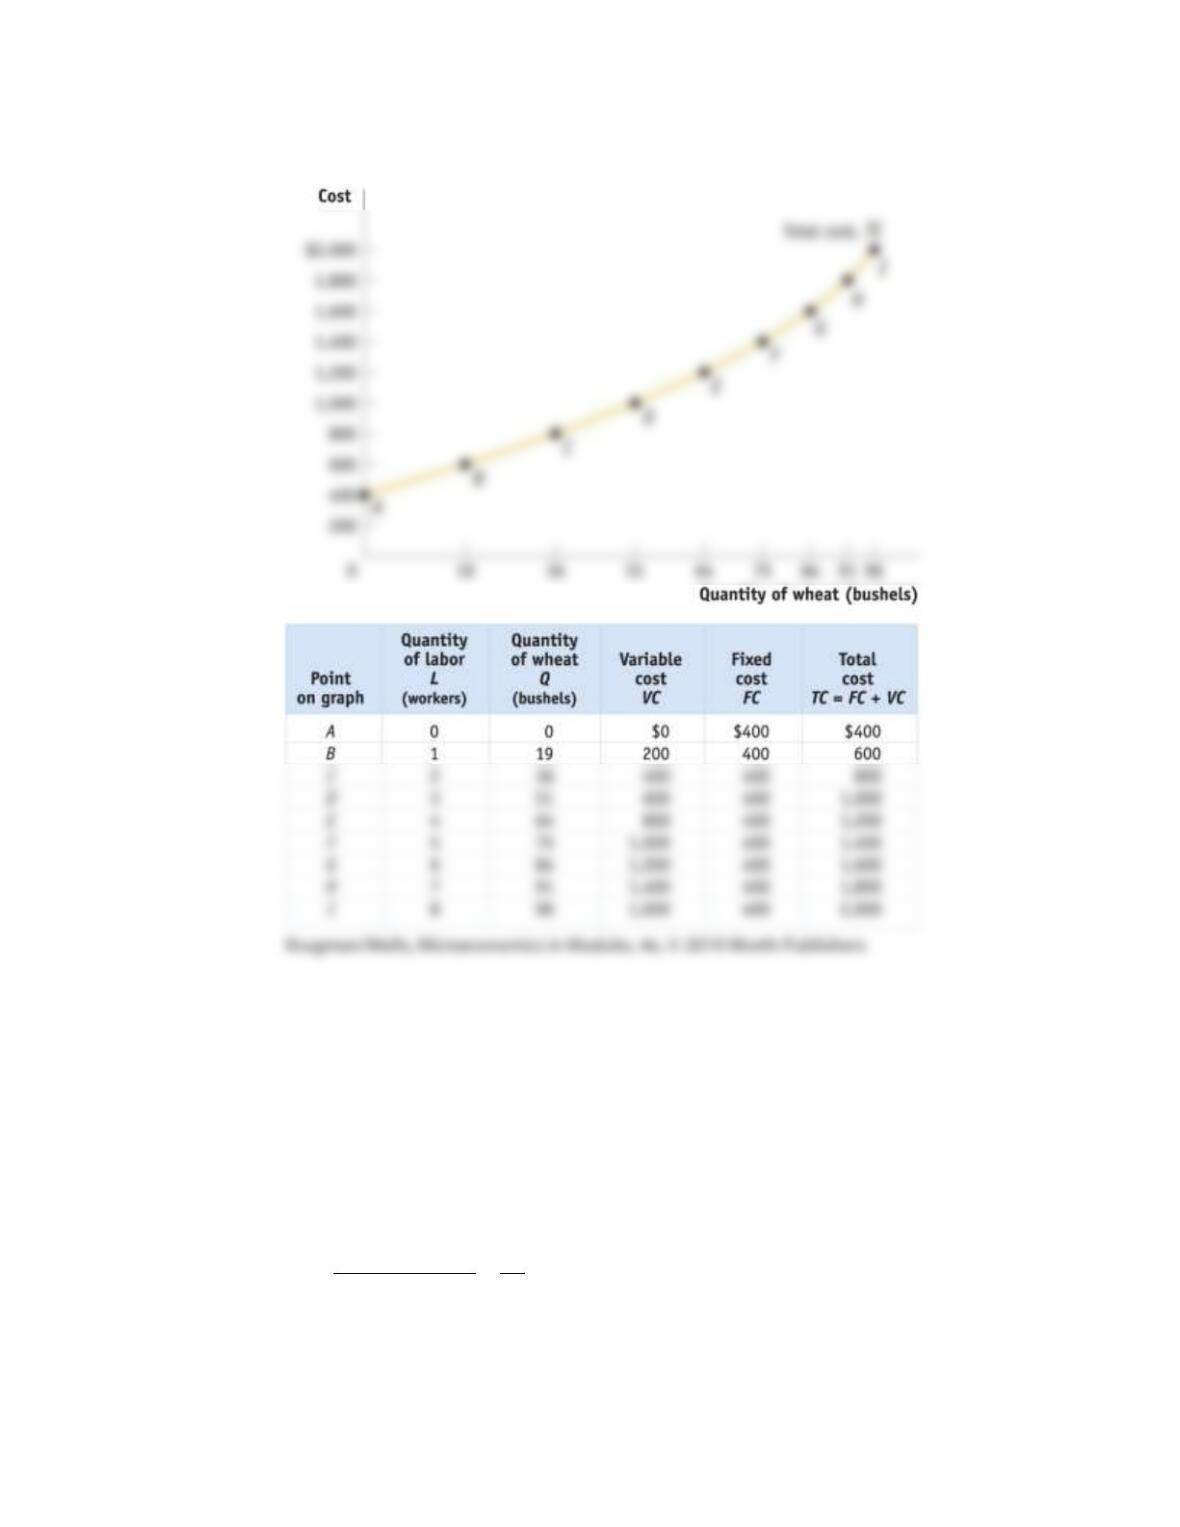
Figure 21-1
II. Two Key Concepts: Marginal Cost and Average Cost
A. Marginal cost
1. Marginal cost = Change in total cost generated by one
additional unit of labor
or MC = ∆TC/∆Q
2. Marginal cost rises because there are diminishing returns to inputs when a variable input
is increased as quantities of the other inputs are fixed.
B. Average total cost
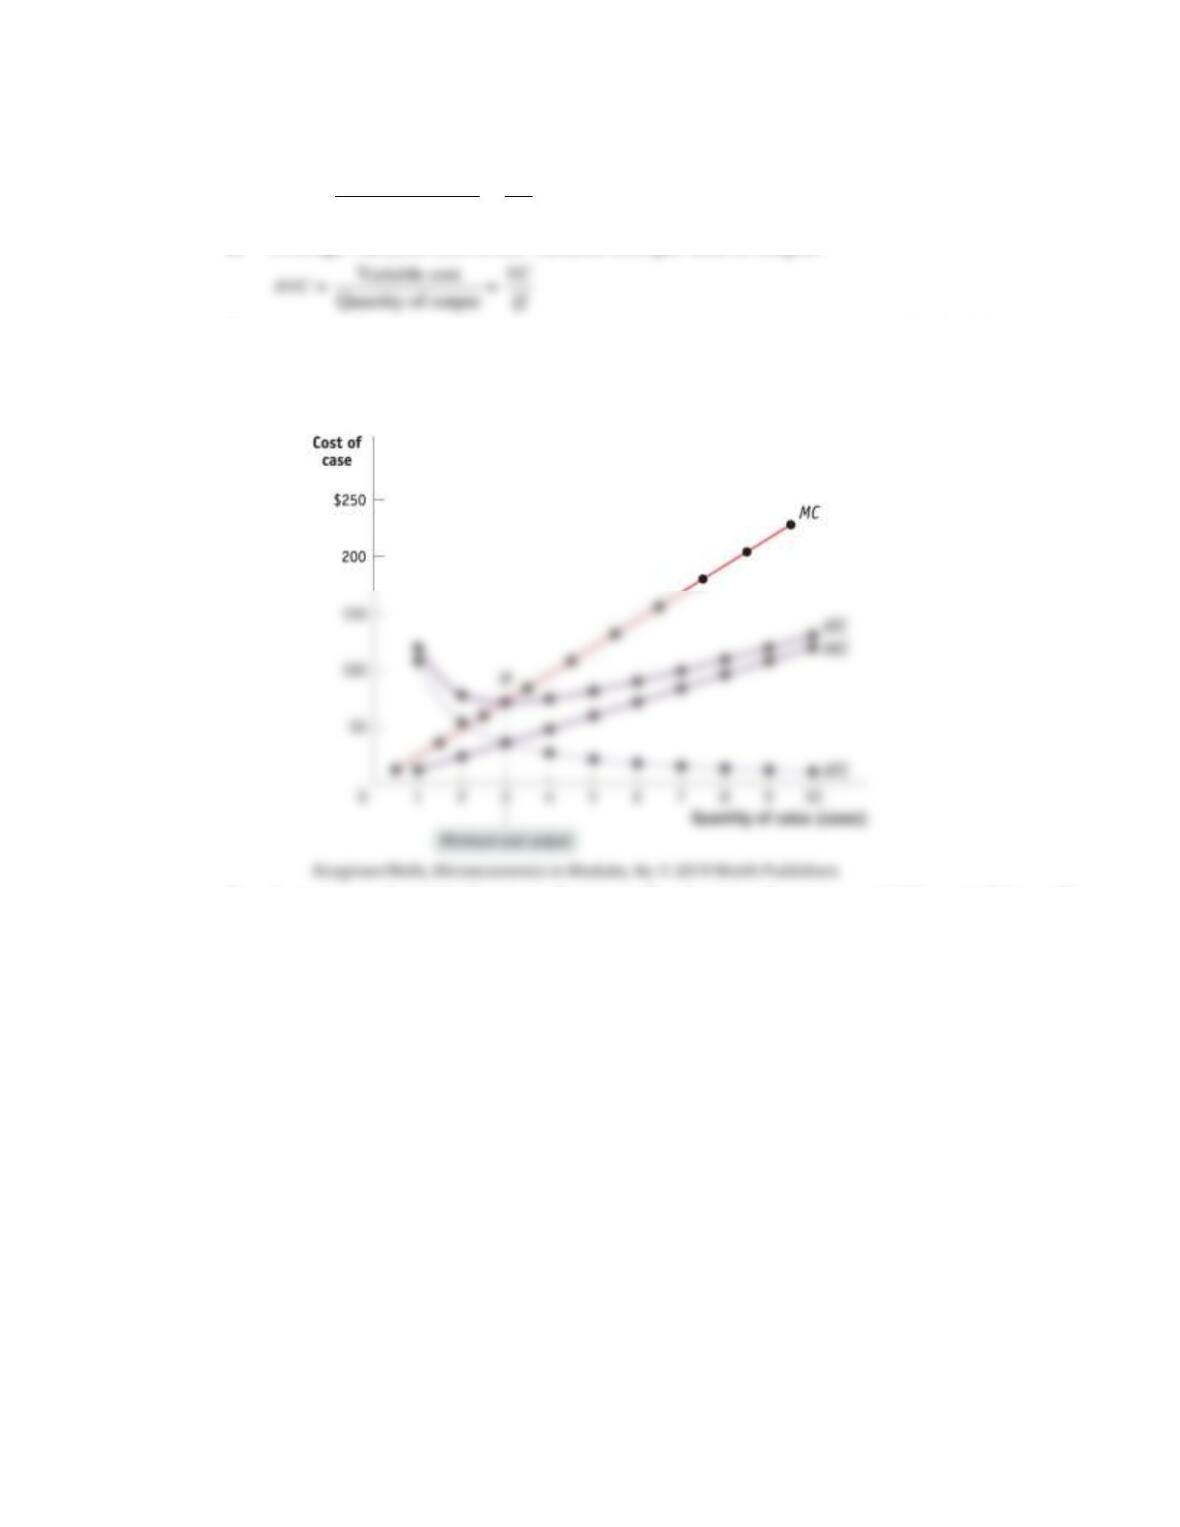
1. Average cost is total cost divided by quantity of output produced.
Total cost
Quantity of output
TC
ATC Q
==
2. Average total cost is important because it tells the producer how much the average or
typical unit of output costs to produce. Marginal cost tells the producer how much the
last unit of output costs to produce.
Module 21 krugman 4
3. Average fixed cost is the fixed cost per unit of output.
Fixed cost
Quantity of output
FC
AFC Q
==
4. Average variable cost is the variable cost per unit of output.
5. Average fixed cost falls as more output is produced. Another way to think of this is that
as more output is produced, the fixed cost is spread over more units of output. This is
illustrated in text Figure 21-4, shown next.
Figure 21-4
6. Average total cost is the sum of average fixed cost and average variable cost. It has a U
shape because these components move in opposite directions as output rises.
a. When the U-shaped average total cost curve slopes downward, the “spreading
effect” dominates: Fixed cost is spread over more units of output.
b. When the U-shaped average total cost curve slopes upward, the “diminishing returns
effect” dominates: An additional unit of output requires more variable inputs.
C. Minimum average total cost
1. The minimum-cost output is the quantity of output at which average total cost is
lowest—the bottom of the U-shaped average total cost curve.
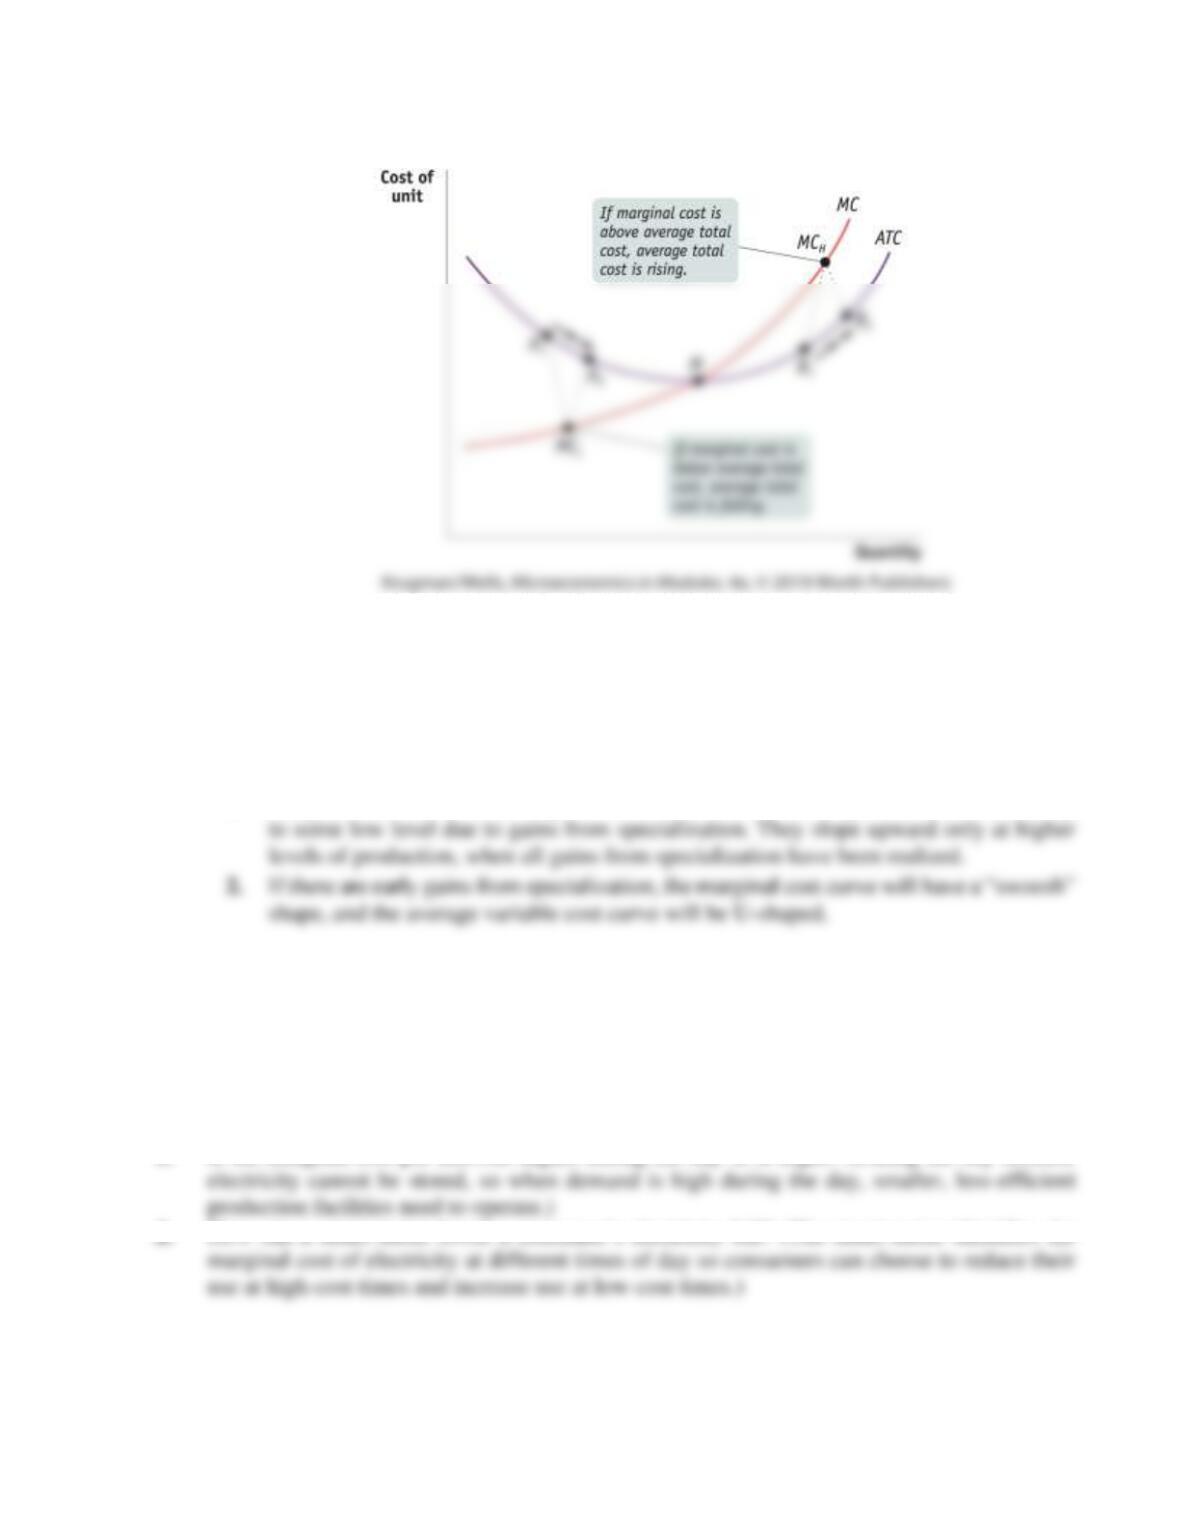
2. Falling marginal cost pulls the average total cost downward, and rising marginal cost
pulls the average total cost upward. This is illustrated in text Figure 21-5, shown next.
Module 21 krugman 5
Figure 21-5
3. Three general principles that are always true:
a. At minimum-cost output, average total cost is equal to marginal cost.
b. At output less than the minimum-cost output, marginal cost is less than average total
cost and average total cost is falling.
c. At output greater than the minimum-cost output, marginal cost is greater than
average total cost and average total cost is rising.
D. Does the marginal cost curve always slope upward?
1. Marginal cost curves often slope down as a firm increases its production from zero up
Case Studies in the Text
Economics in Action
Smart Grid Economics—This EIA explains why the marginal cost of electricity is higher during the day
than at night. Smart meters can be used to lower the consumer’s energy bill.
Ask students the following questions:
1. Is the marginal cost per kilowatt higher during the day or at night? (During the day because
2. How can a smart meter lower a consumer’s electricity bill? (The smart meter identifies the

Module 21 krugman 6
Handout 21-1
Date_________ Name____________________________ Class________ Professor________________
Average, Fixed, Variable, and Marginal Costs
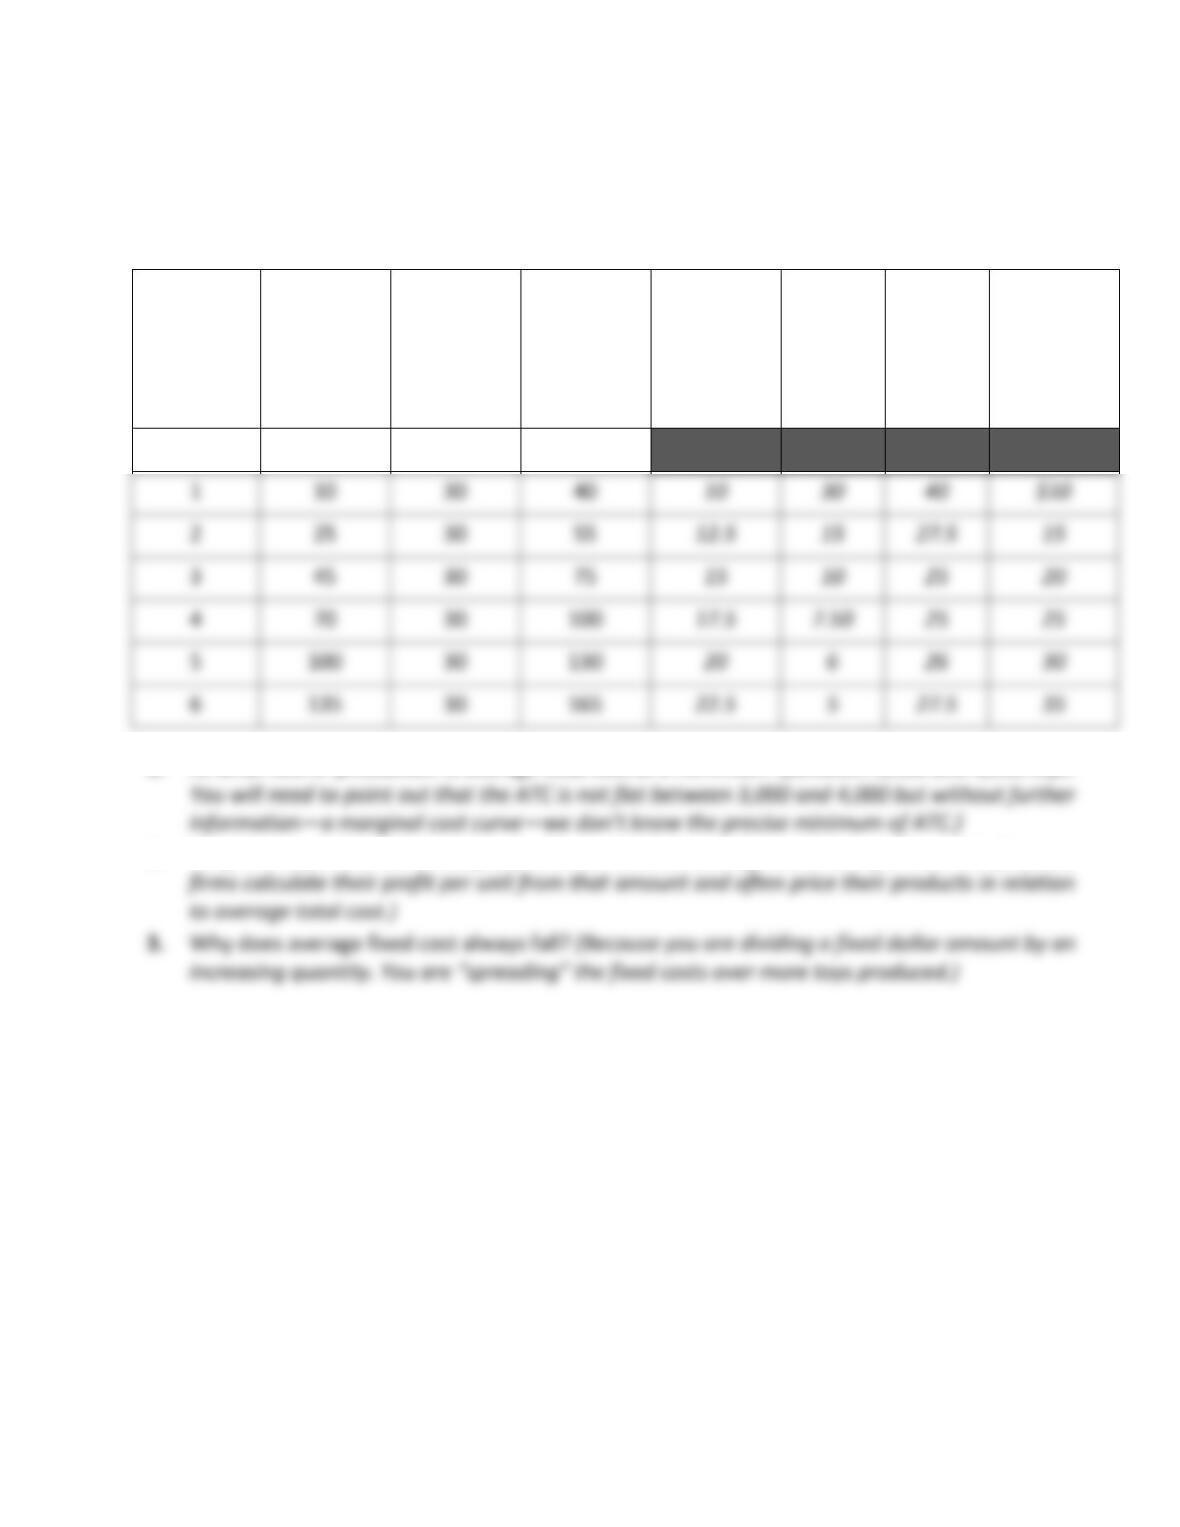
Complete the average variable costs, average fixed costs, average total costs, and marginal cost columns
in the table below.
Quantity
of toys
produced
(in
thousands)
Variable
costs of
production
Fixed
costs of
production
(per hour)
Total
costs of
production
Average
variable
cost
(VC/Q)
Average
fixed
cost
(FC/Q)
Average
total
cost
(TC/Q)
Marginal
cost of
production
ΔTC/ΔQ
0
$0
$30
$30
1
10
30
40
10
30
40
$10
2
25
30
55
12.5
15
27.5
15
3
45
30
75
15
10
25
20
4
70
30
100
17.5
7.50
25
25
5
100
30
130
20
6
26
30
6
135
30
165
22.5
5
27.5
35
1. At what rate of production is average total cost at a minimum?
2. Why is it important for a company to know what its average total cost per item is?
3. Why does average fixed cost always fall?
Module 21 krugman 7
Answers
Complete the average variable costs, average fixed costs, average total costs, and marginal costs
columns in the table below.
Quantity
of toys
produced
(in
thousands)
Variable
costs of
production
Fixed
costs of
production
(per hour)
Total
costs of
production
Average
variable
cost
(VC/Q)
Average
fixed
cost
(FC/Q)
Average
total
cost
(TC/Q)
Marginal
cost of
production
ΔTC/ΔQ
0
$0
$30
$30
1. At what rate of production is average total cost at a minimum? (Between 3,000 and 4,000 toys.
2. Why is it important for a company to know what its average total cost per item is? (Because
1
10
30
40
2
25
30
55
3
45
30
75
4
70
30
100
5
100
30
130
6
135
30
165

Module 21 krugman 8
Handout 21-2
Date_________ Name____________________________ Class________ Professor________________
Widget Production
Widget Production
Production and Cost
Inputs: capital—paper, work surface, and stapler (fixed); labor (variable)
To produce: widgets—fold paper twice, staple
Assume: price of capital = $10/unit, price of labor = $5/unit
K
L
O
APL
MP
FC
VC
TC
MC
AFC
AVC
ATC
1
_____
_____
_____
_____
_____
_____
_____
_____
_____
_____
_____
1
_____
_____
_____
_____
_____
_____
_____
_____
_____
_____
_____
1
_____
_____
_____
_____
_____
_____
_____
_____
_____
_____
_____
1
_____
_____
_____
_____
_____
_____
_____
_____
_____
_____
_____
1
_____
_____
_____
_____
_____
_____
_____
_____
_____
_____
_____
1
_____
_____
_____
_____
_____
_____
_____
_____
_____
_____
_____
1
_____
_____
_____
_____
_____
_____
_____
_____
_____
_____
_____
1
_____
_____
_____
_____
_____
_____
_____
_____
_____

Module 21 krugman 9
Handout 21-3
Date_________ Name____________________________ Class________ Professor________________
Returns to Scale
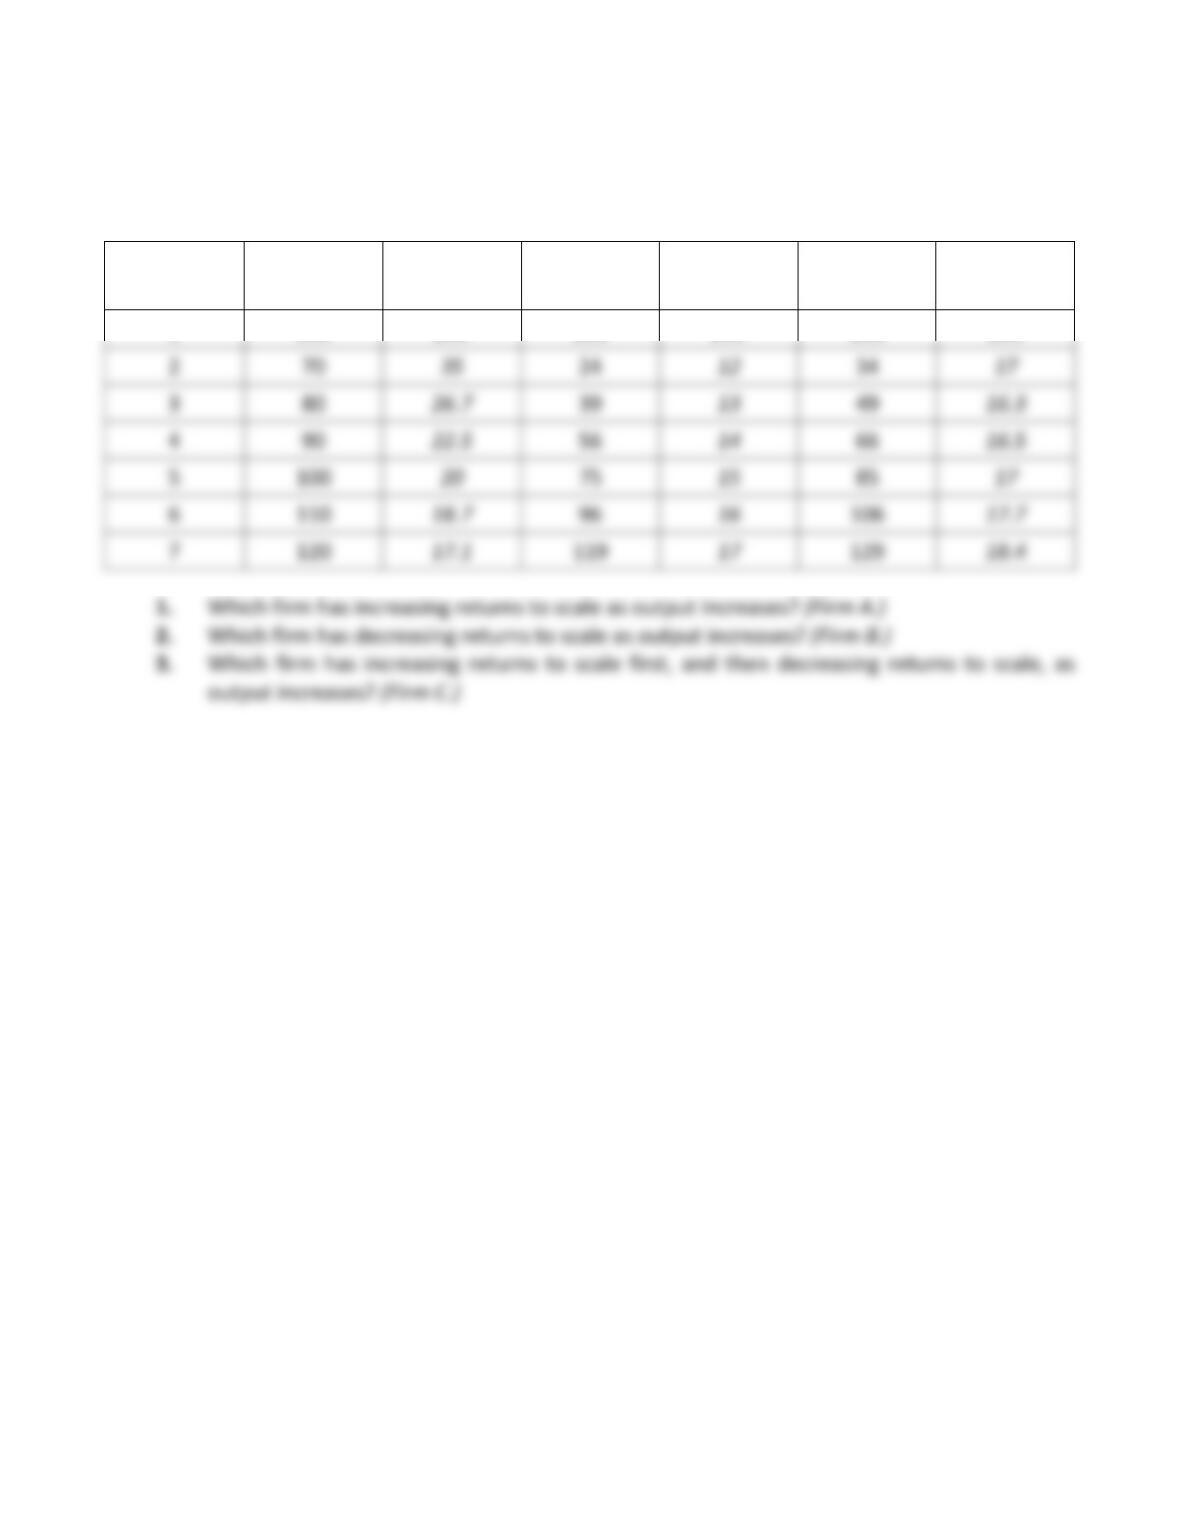
Calculate ATC for Firm A, Firm B, and Firm C.
Quantity
Firm A
TC
Firm A
ATC
Firm B
TC
Firm B
ATC
Firm C
TC
Firm C
ATC
1
$60
$11
$21
2
70
24
34
3
80
39
49
4
90
56
66
5
100
75
85
6
110
96
106
7
120
119
129
1. Which firm has increasing returns to scale as output increases?
2. Which firm has decreasing returns to scale as output increases?
3. Which firm has increasing returns to scale first, and then decreasing returns to scale, as
output increases?
Module 21 krugman 10
Answers
Calculate ATC for Firm A, Firm B, and Firm C.
Quantity
Firm A
TC
Firm A
ATC
Firm B
TC
Firm B
ATC
Firm C
TC
Firm C
ATC
1
$60
$60
$11
$11
$21
$21
2
5
100
6
110
106
7
120
119
129
Module 21 krugman 11
Handout 21-4
Date_________ Name____________________________ Class________ Professor________________
Coca-Cola and the Price of Sugar
In 1985, the Coca-Cola Company was faced with soaring prices for cane sugar. A 1-cent increase in the
price of cane sugar raised its total cost by $20 million. Rather than raise the price, the company looked
for a cheaper input and replaced cane sugar with corn sugar. Because corn was more plentiful in the
United States, it was cheaper to produce.
Answer the following questions:
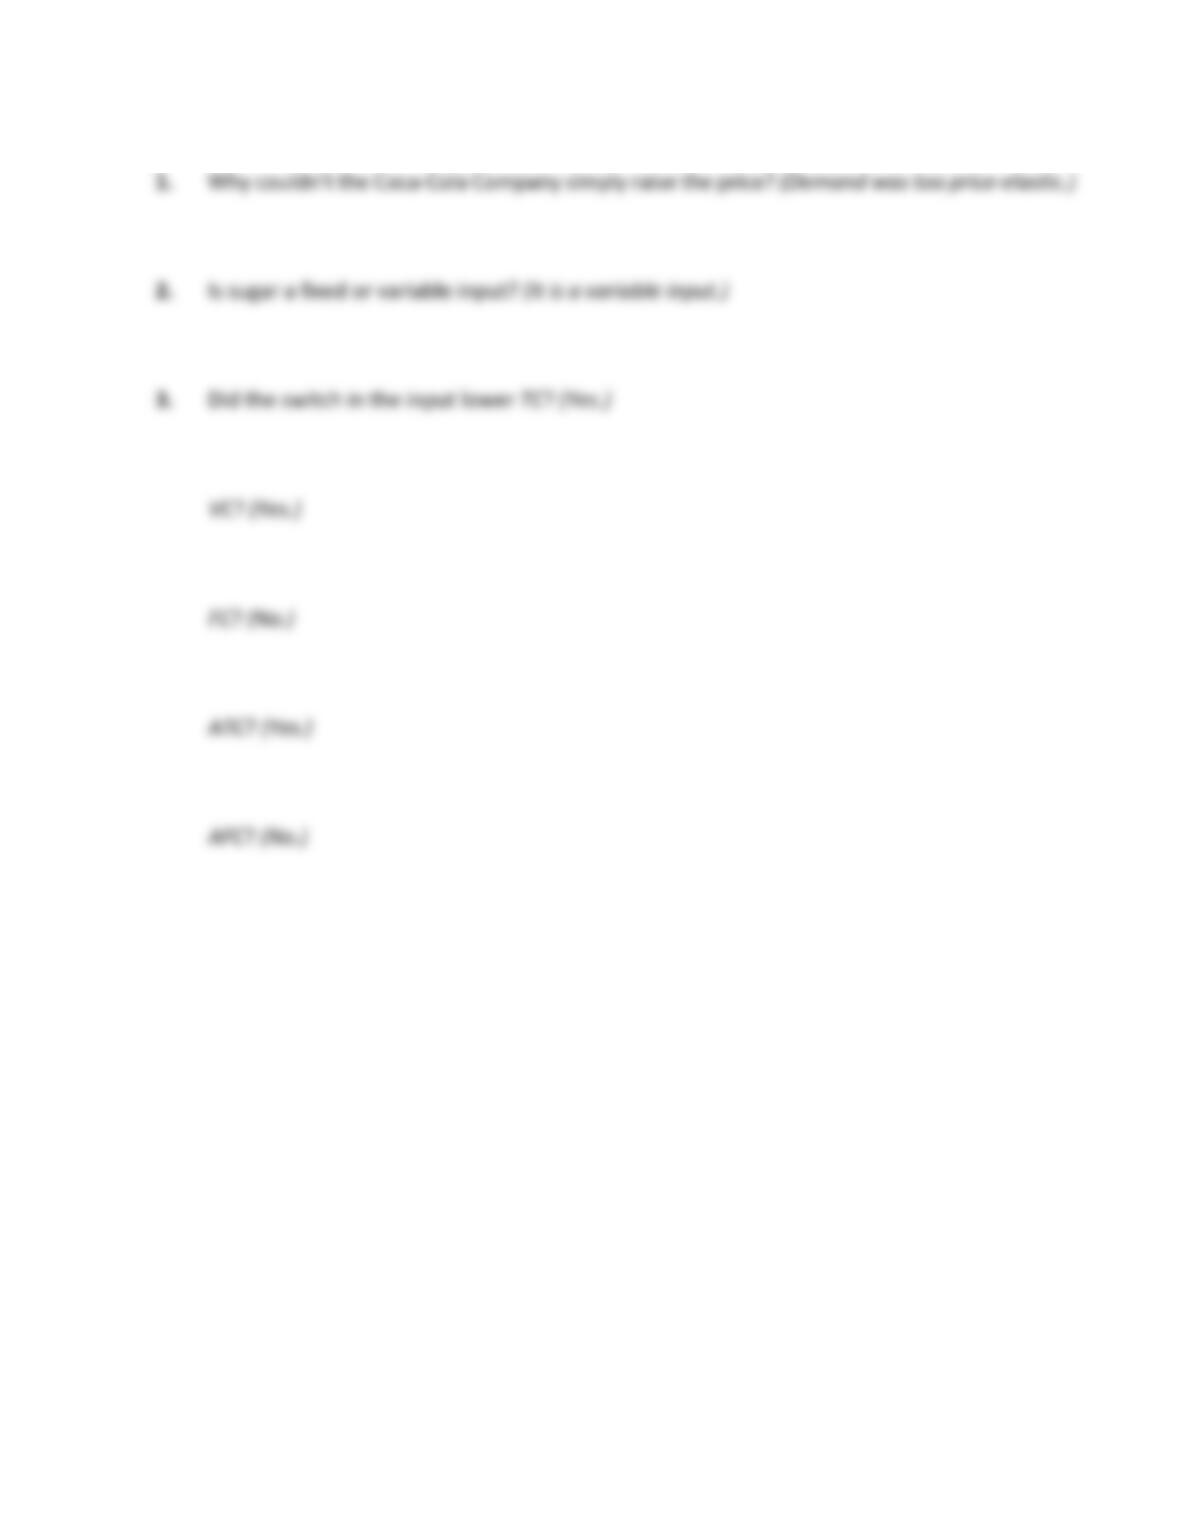
1. Why couldn’t the Coca-Cola Company simply raise the price?
2. Is sugar a fixed or variable input?
3. Did the switch in the input lower TC?
VC?
FC?
ATC?
AFC?
AVC?
Module 21 krugman 12
Answers
AVC? (Yes.)

Module 21 krugman 13
Handout 21-5
Date_________ Name____________________________ Class________ Professor________________
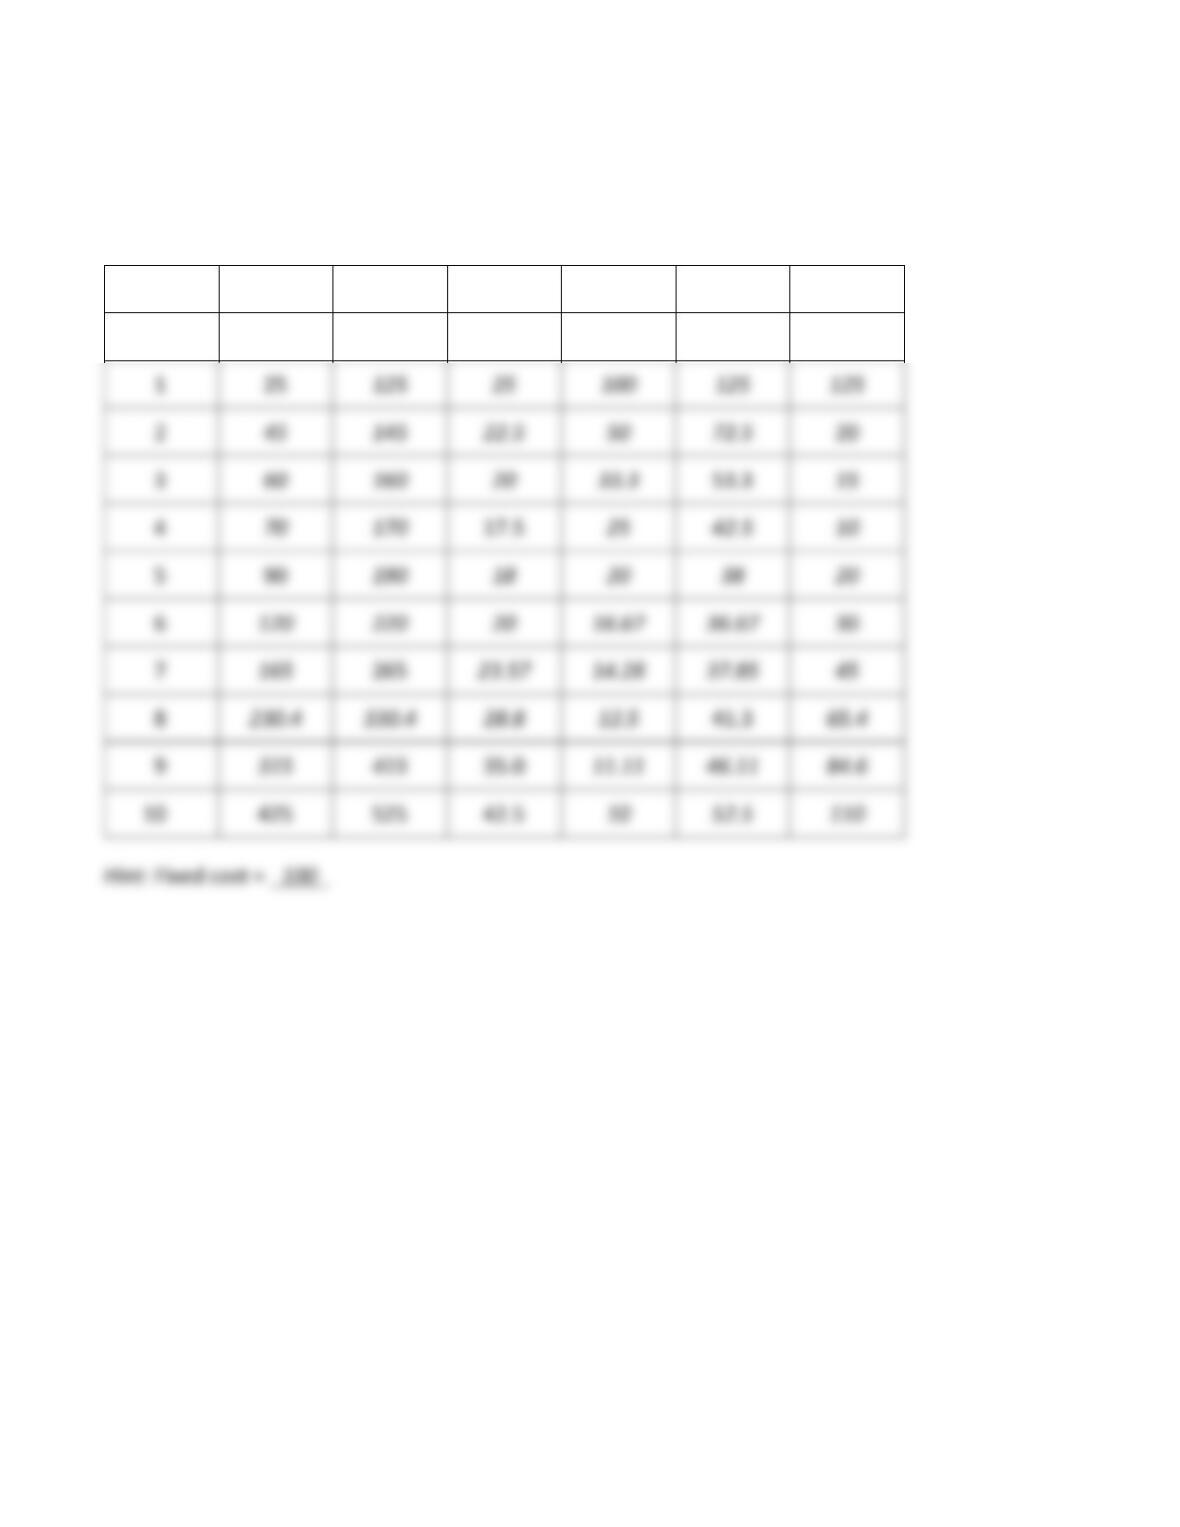
Cost Calculation Puzzle
Fill in the missing numbers using the information provided.
Output
VC
TC
AVC
AFC
ATC
MC
0
100
—
—
—
—
1
25
2
20
3
53.3
4
17.5
5
90
6
30
7
265
8
41.3
9
35.0
10
425
Hint: Fixed cost = _____
Module 21 krugman 14
Answers:
Fill in the missing numbers using the information provided.
Output
VC
TC
AVC
AFC
ATC
MC
0
0
100
—
—
—
—
1
2
3
4
6
8
425
525