Section 12: Factor Markets and the Distribution of
Income
Question 1
1. In 2015, national income in the United States was $15,665.3 billion. In the same year, 148.8
million workers were employed, at an average wage, including benefits, of $62,187 per
worker per year.
a. How much compensation of employees was paid in the United States in 2015?
b. Analyze the factor distribution of income. What percentage of national income was
received in the form of compensation to employees in 2015?
c. Suppose that a huge wave of corporate downsizing leads many terminated employees to
open their own businesses. What is the effect on the factor distribution of income?
d. Suppose the supply of labor rises due to an increase in the retirement age. What happens to
the percentage of national income received in the form of compensation of employees?
Solution 1
Question 2
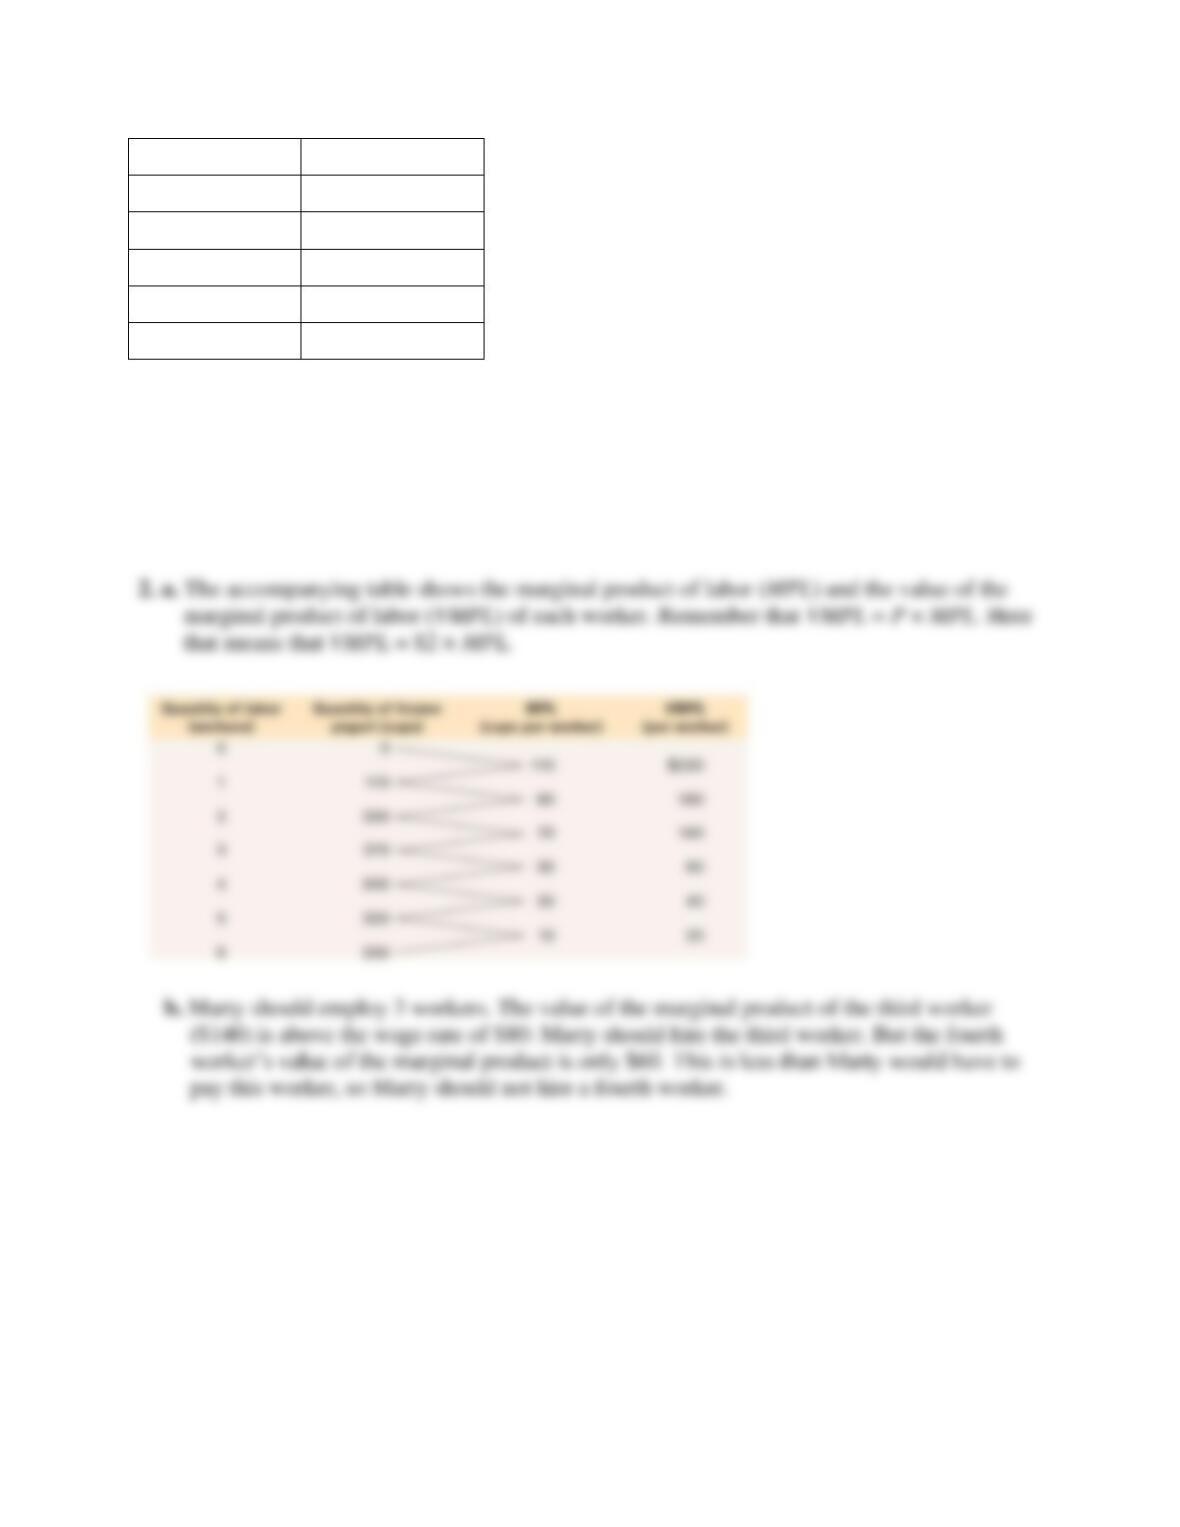
2. Marty’s Frozen Yogurt has the production function per day shown in the accompanying table.
The equilibrium wage rate for a worker is $80 per day. Each cup of frozen yogurt sells for $2.
Quantity of
labor
(workers)
Quantity of
frozen yogurt
(cups)
0
0
1
110
2
200
3
270
4
300
5
320
6
330
a. Calculate the marginal product of labor for each worker and the value of the marginal
product of labor per worker.
b. How many workers should Marty employ?
Solution 2
Question 3
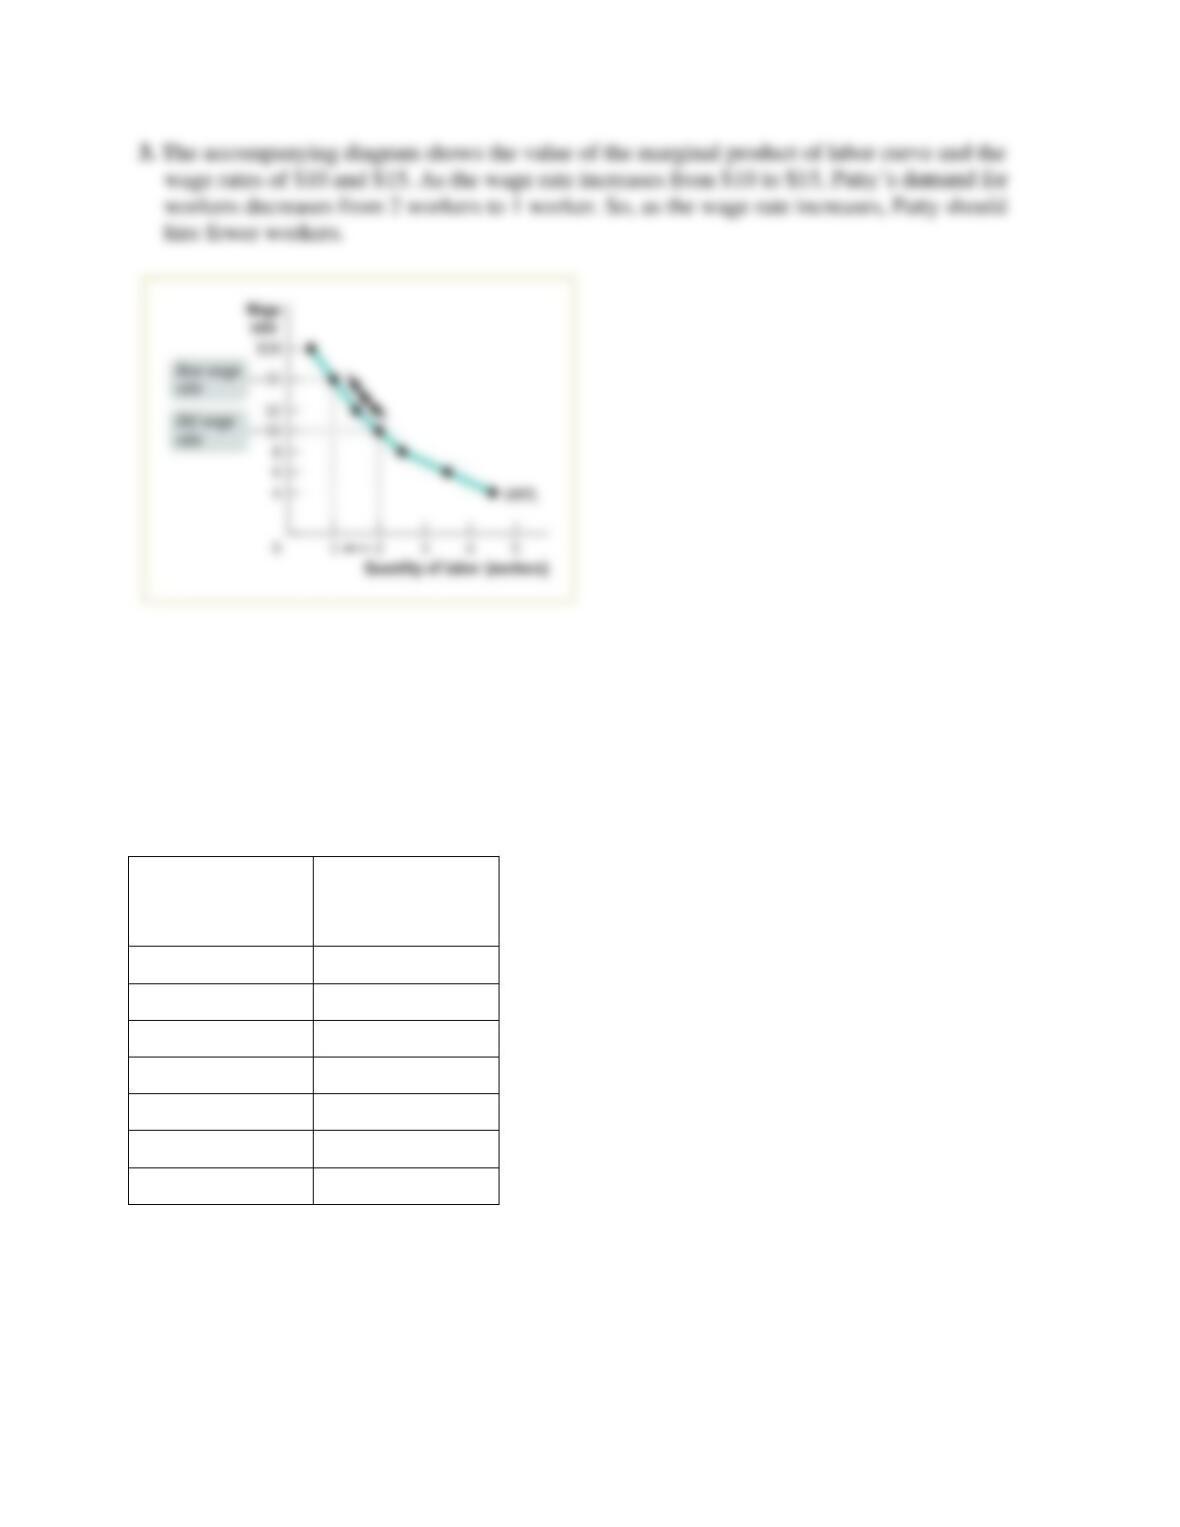
3. The production function for Patty’s Pizza Parlor is given in the table in Problem 17. The price
of pizza is $2, but the hourly wage rate rises from $10 to $15. Use a diagram to determine
how Patty’s demand for workers responds as a result of this wage rate increase.
Solution 3
Question 4
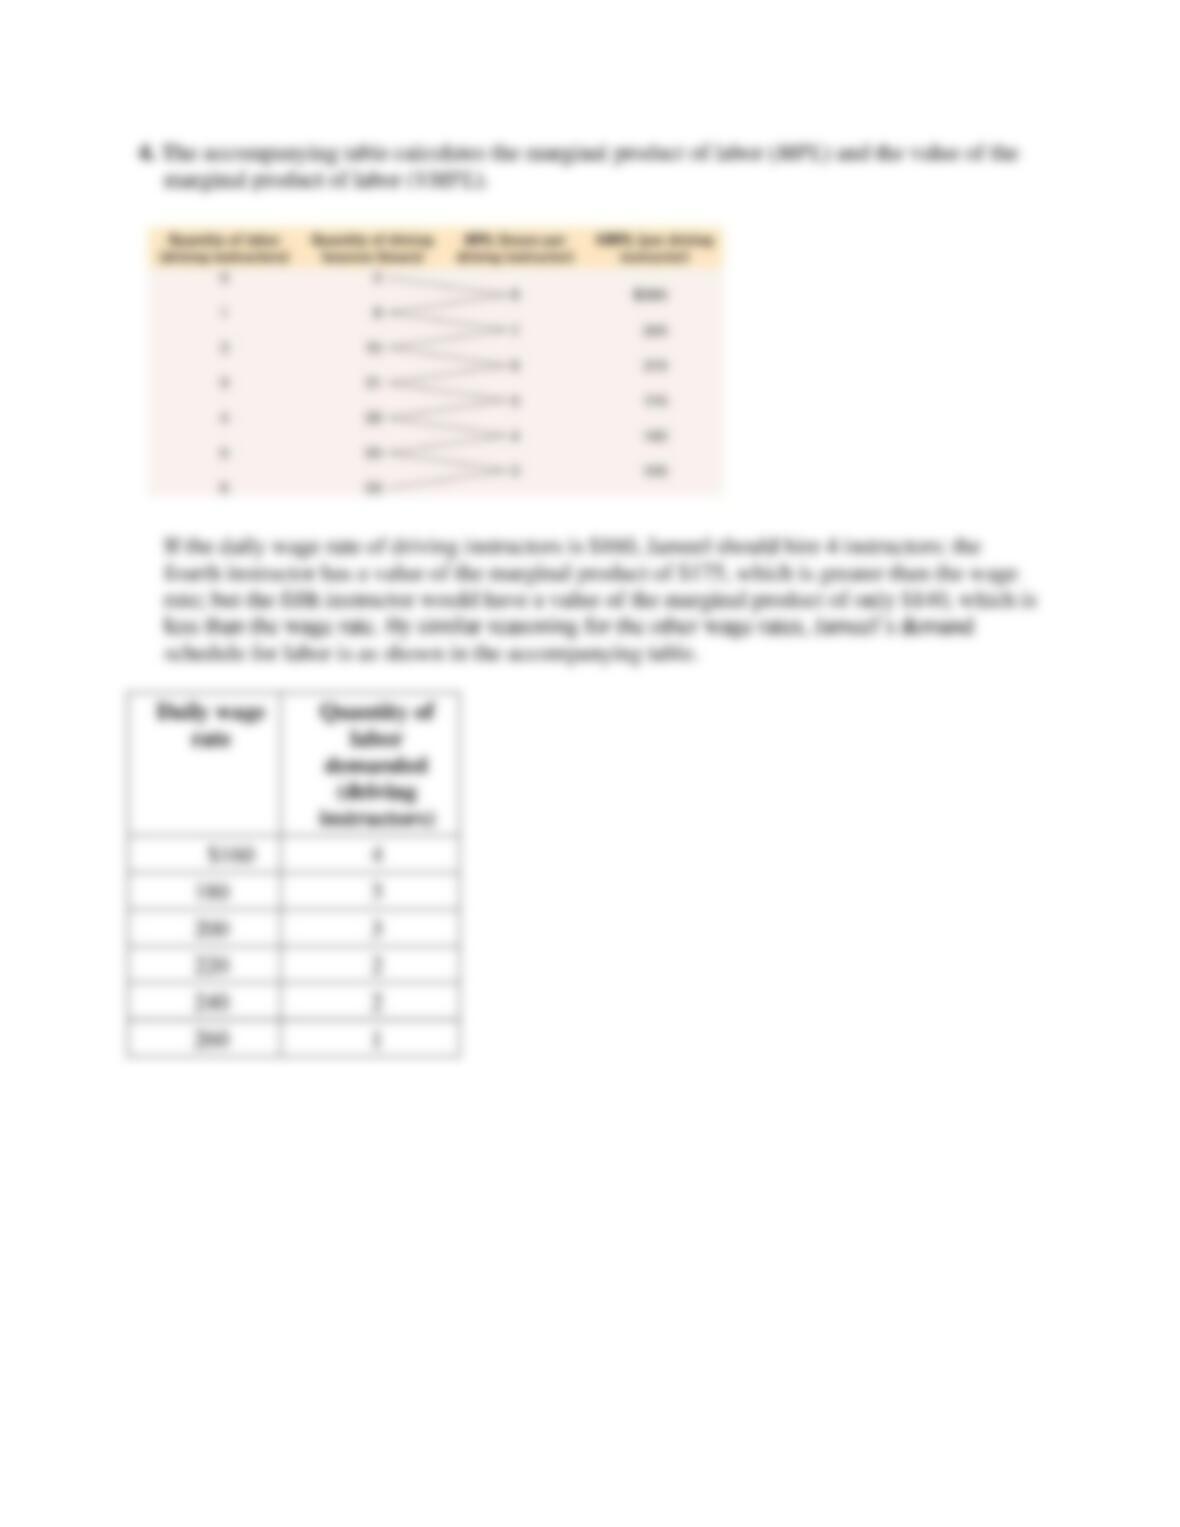
4. Jameel runs a driver education school. The more driving instructors he hires, the more driving
lessons he can sell. But because he owns a limited number of training automobiles, each
additional driving instructor adds less to Jameel’s output of driving lessons. The
accompanying table shows Jameel’s production function per day. Each driving lesson can be
sold at $35 per hour.
Quantity of
labor (driving
instructors)
Quantity of
driving lessons
(hours)
0
0
1
8
2
15
3
21
4
26
5
30
6
33
Determine Jameel’s labor demand schedule (his demand schedule for driving instructors) for
each of the following daily wage rates for driving instructors: $160, $180, $200, $220, $240,
and $260.
Solution 4
Question 5
5. Dale and Dana work at a self-service gas station and convenience store. Dale opens up every
day, and Dana arrives later to help stock the store. They are both paid the current market wage
of $9.50 per hour. But Dale feels he should be paid much more because the revenue generated
from the gas pumps he turns on every morning is much higher than the revenue generated by
the items that Dana stocks. Assess this argument.
Solution 5
Question 6
6. A New York Times article observed that the wage of farmworkers in Mexico was $11 an hour
but the wage of immigrant Mexican farmworkers in California was $9 an hour.
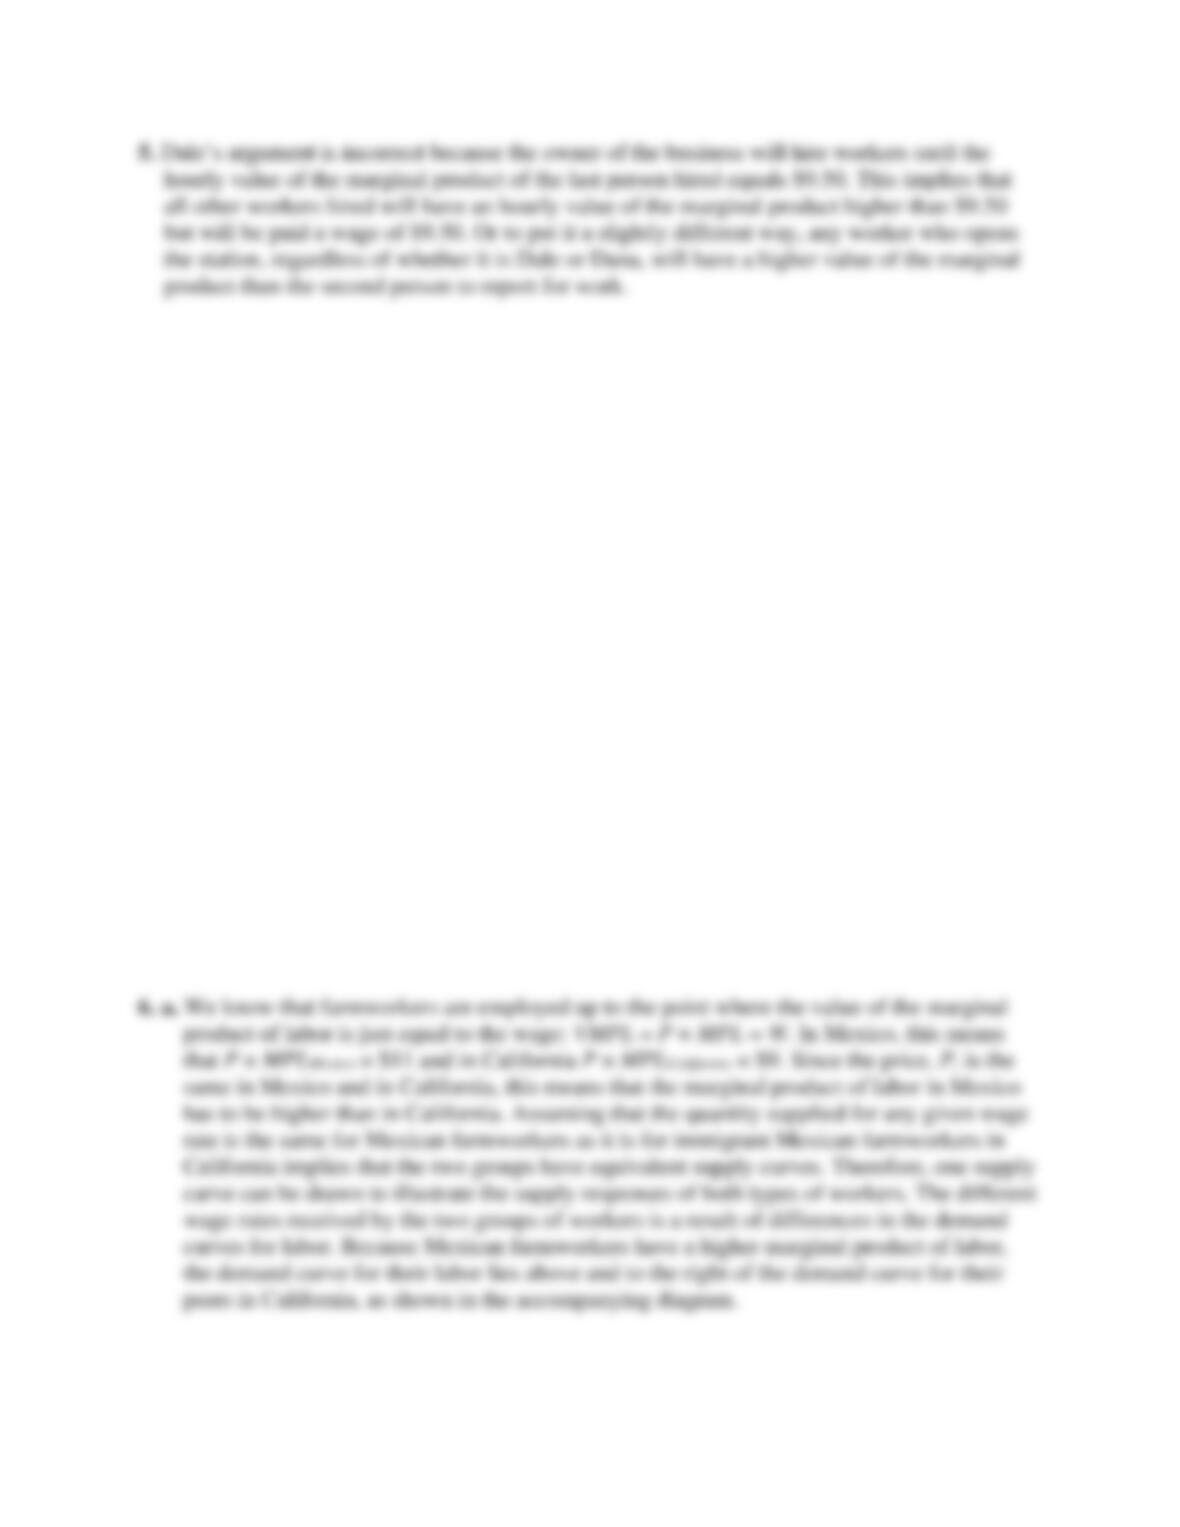
a. Assume that the output sells for the same price in the two countries. Does this imply that
the marginal product of labor of farmworkers is higher in Mexico or in California? Explain
your answer, and illustrate with a diagram that shows the demand and supply curves for
labor in the respective markets. In your diagram, assume that the quantity supplied of labor
for any given wage rate is the same for Mexican farmworkers as it is for immigrant
Mexican farmworkers in California.
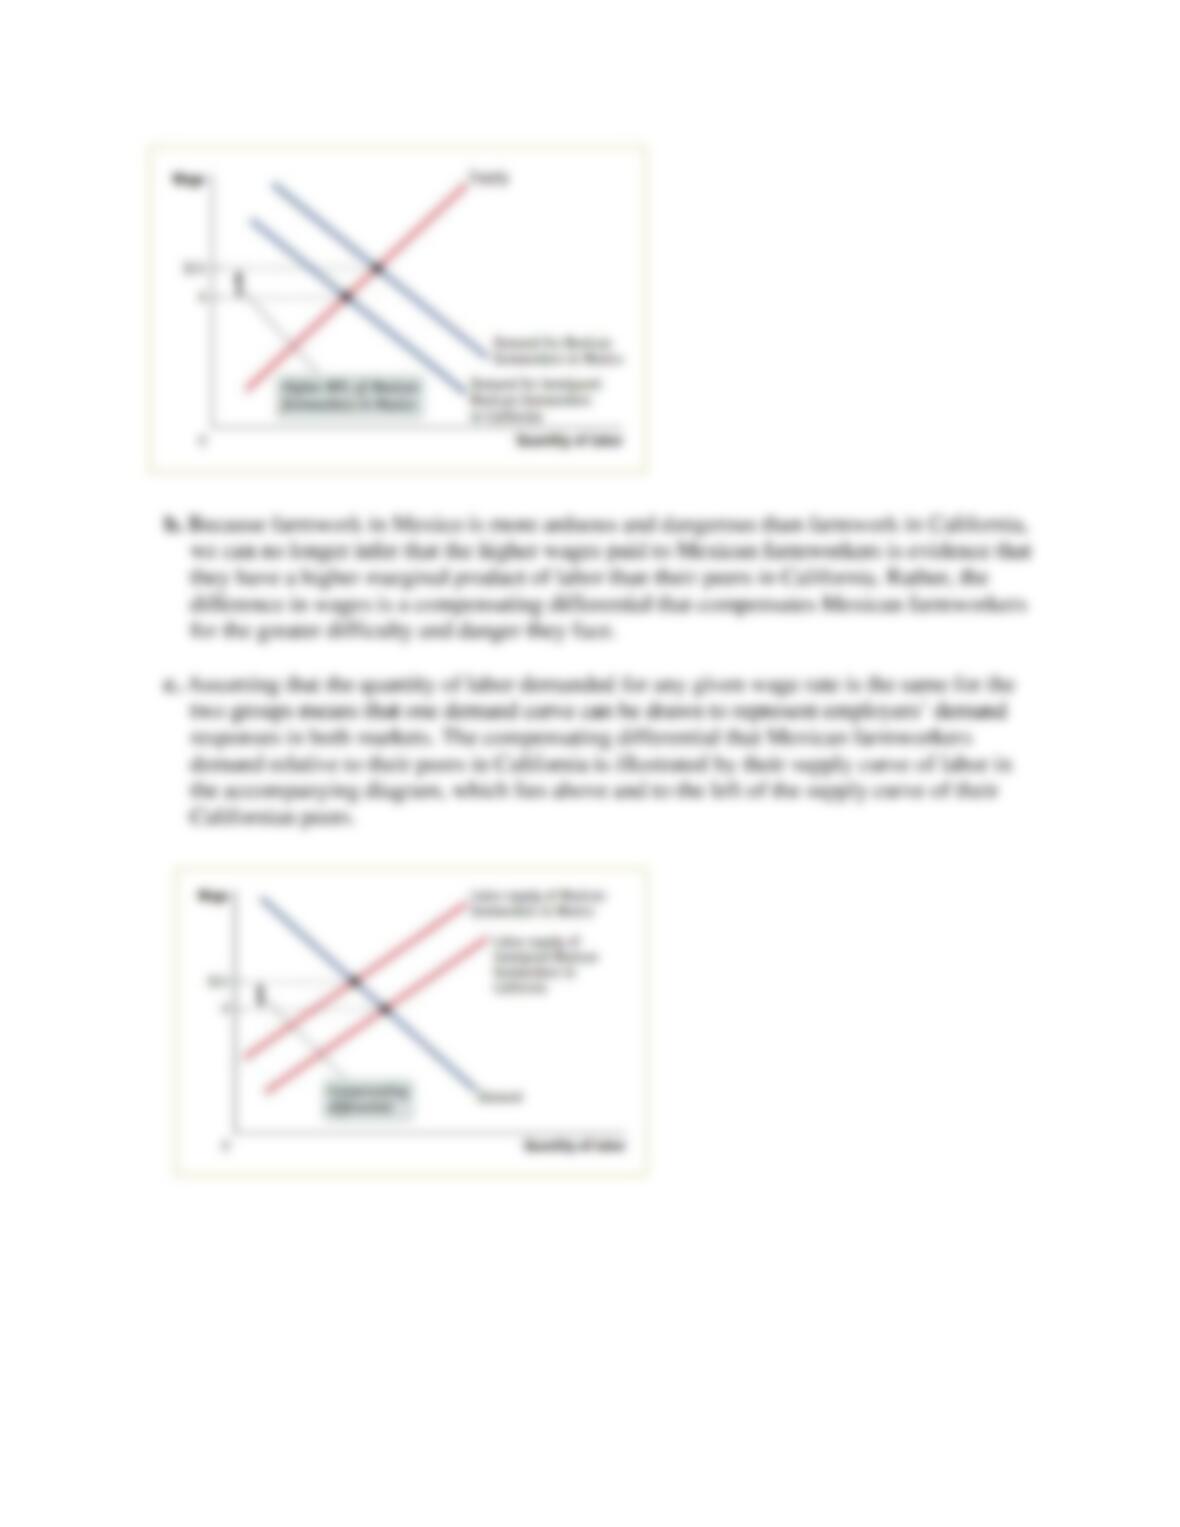
b. Now suppose that farmwork in Mexico is more arduous and more dangerous than
farmwork in California. As a result, the quantity supplied of labor for any given wage rate
is not the same for Mexican farmworkers as it is for immigrant Mexican farmworkers in
California. How does this change your answer to part a? What concept best accounts for
the difference between wage rates for Mexican farmworkers and immigrant Mexican
farmworkers in California?
c. Illustrate your answer to part b with a diagram. In this diagram, assume that the quantity of
labor demanded for any given wage rate is the same for Mexican employers as it is for
Californian employers.
Solution 6
Question 7
7. Research consistently finds that despite nondiscrimination policies, African-American workers
on average receive lower wages than White workers do. What are the possible reasons for
this? Are these reasons consistent with marginal productivity theory?
Solution 7
Question 8
8. Greta is an enthusiastic amateur gardener and spends a lot of her free time working in her
yard. She also has a demanding and well-paid job as a freelance advertising consultant.
Because the advertising business is going through a difficult time, the hourly consulting fee
Greta can charge falls. Greta decides to spend more time gardening and less time consulting.
Explain her decision in terms of income and substitution effects.
Solution 8
Question 9
9. You are the governor’s economic policy adviser. The governor wants to put in place policies
that encourage employed people to work more hours at their jobs and that encourage
unemployed people to find and take jobs. Assess each of the following policies in terms of
reaching that goal. Explain your reasoning in terms of income and substitution effects, and
indicate when the impact of the policy may be ambiguous.
a. The state income tax rate is lowered, which has the effect of increasing workers’ after-tax
wage rate.
b. The state income tax rate is increased, which has the effect of decreasing workers’ after–
tax wage rate.
c. The state property tax rate is increased, which reduces workers’ after-tax income.

Solution 9
Question 10
10. In the city of Metropolis, there are 100 residents, each of whom lives until age 75. Residents
of Metropolis have the following incomes over their lifetime: Through age 14, they earn
nothing. From age 15 until age 29, they earn 200 metros (the currency of Metropolis) per
year. From age 30 to age 49, they earn 400 metros. From age 50 to age 64, they earn 300
metros. Finally, at age 65 they retire and are paid a pension of 100 metros per year until they
die at age 75. Each year, everyone consumes whatever their income is that year (that is, there
is no saving and no borrowing). Currently, 20 residents are 10 years old, 20 residents are 20
years old, 20 residents are 40 years old, 20 residents are 60 years old, and 20 residents are 70
years old.
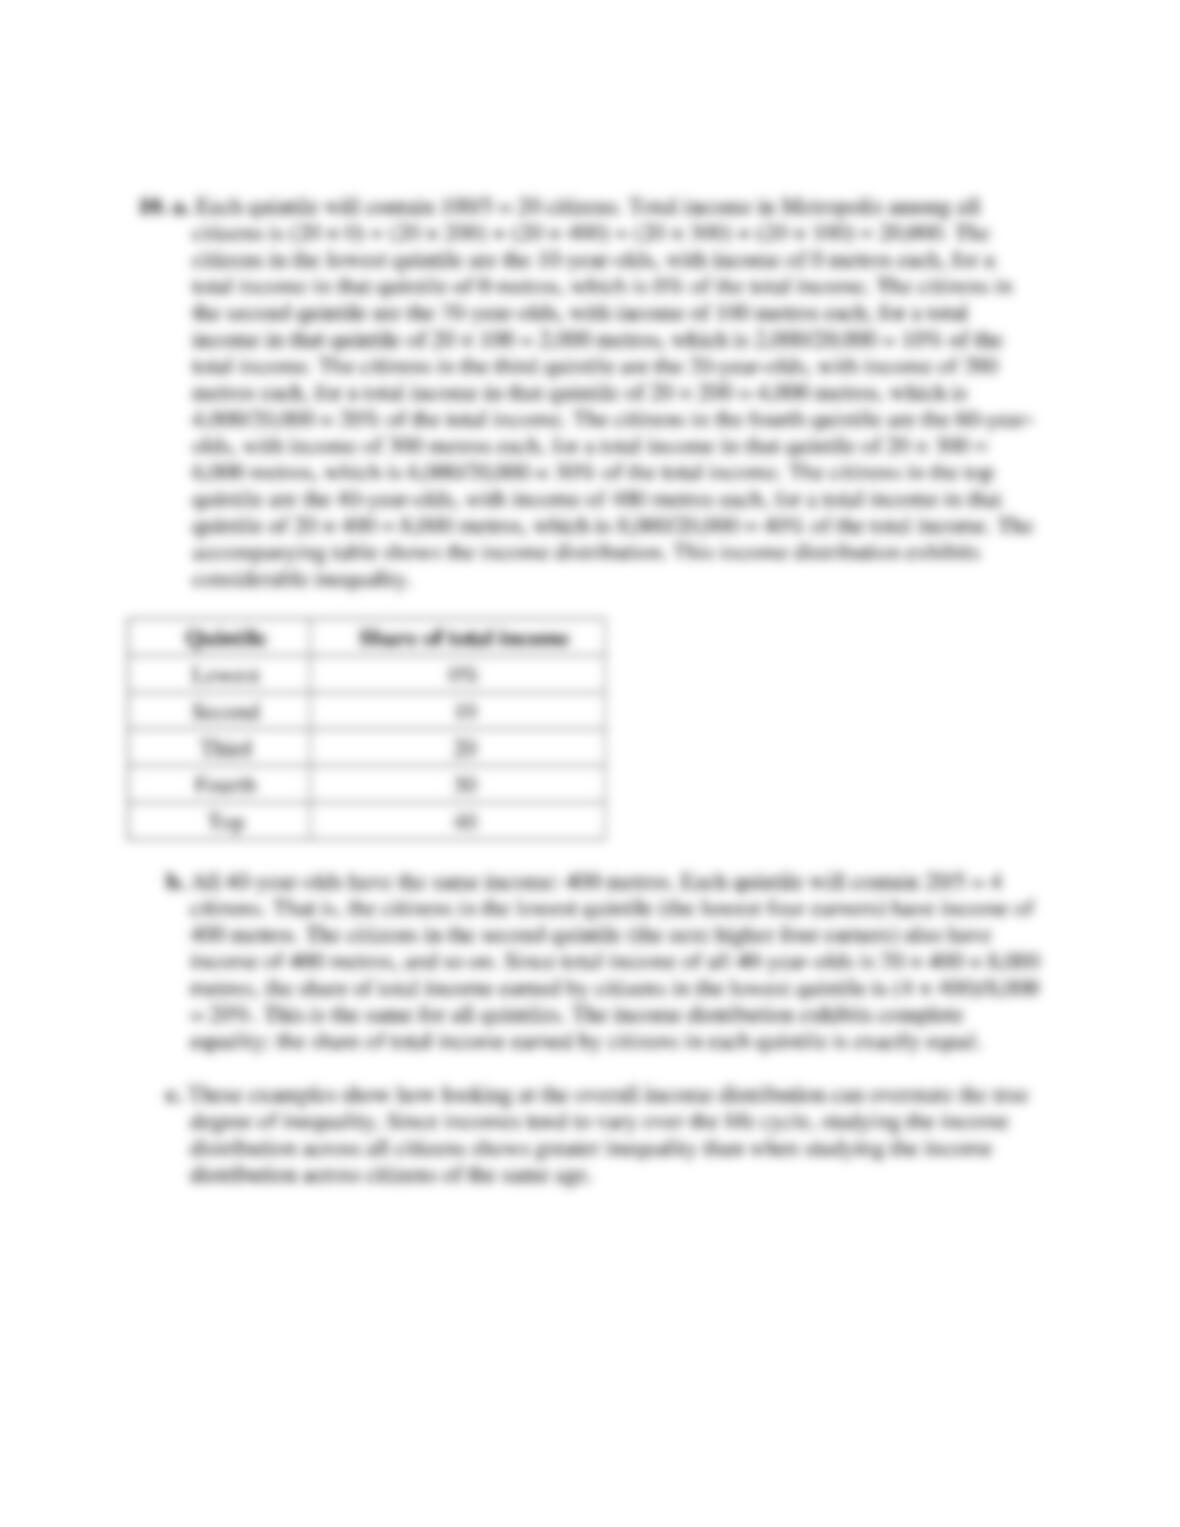
a. Study the income distribution among all residents of Metropolis. Split the population into
quintiles according to their income. How much income does a resident in the lowest
quintile have? In the second, third, fourth, and top quintiles? What share of total income of
all residents goes to the residents in each quintile? Construct a table showing the share of
total income that goes to each quintile. Does this income distribution show inequality?
b. Now look only at the 20 residents of Metropolis who are currently 40 years old, and study
the income distribution among only those residents. Split those 20 residents into quintiles
according to their income. How much income does a resident in the lowest quintile have?
In the second, third, fourth, and top quintiles? What share of total income of all 40-year-
olds goes to the residents in each quintile? Does this income distribution show inequality?
c. What is the relevance of these examples for assessing data on the distribution of income in
any country?
Solution 10
Question 11
11. The accompanying table presents data from the U.S. Census Bureau on median and mean
income of male workers for the years 1972 and 2015. The income figures are adjusted to
eliminate the effect of inflation.

Year
Median income
Mean income
(in 2015 dollars)
1972
$37,760
$43,766
2015
37,138
54,757
Data
from:
U.S.
Census
Bureau.
a. By what percentage has median income changed over this period? By what percentage has
mean income changed over this period?
b. Between 1972 and 2015, has the income distribution become less or more unequal?
Explain.
Solution 11
Question 12
12. There are 100 households in the economy of Equalor. Initially, 99 of them have an income of
$10,000 each, and one household has an income of $1,010,000.
a. What is the median income in this economy? What is the mean income?
Through its poverty programs, the government of Equalor now redistributes income: it takes
$990,000 away from the richest household and distributes it equally among the remaining 99
households.
b. What is the median income in this economy now? What is the mean income? Has the
median income changed? Has the mean income changed? Which indicator (mean or
median household income) is a better indicator of the typical Equalorian household’s
income? Explain.

Solution 12
Question 13
13 The tax system in Taxilvania includes a negative income tax. For all incomes below $10,000,
individuals pay an income tax of -40% (that is, they receive a payment of 40% of their
income). For any income above the $10,000 threshold, the tax rate on that additional income
is 10%.
a. For each scenario in the table, calculate the amount of income tax to be paid and after-tax
income.
b. Can you find a situation in this tax system where earning more pre-tax income actually
results in less after-tax income? Explain.
Scenarios
1
Lowani earns income of $8,000
2
Midram earns income of $40,000
3
Hi-Wan earns income of $100,000
Solution 13

Question 14
14. In the city of Notchingham, each worker is paid a wage rate of $10 per hour. Notchingham
administers its own unemployment benefit, which is structured as follows: If you are
unemployed (that is, if you do not work at all), you get unemployment benefits (a transfer
from the government) of $50 per day. As soon as you work for only one hour, the
unemployment benefit is completely withdrawn. That is, there is a notch in the benefit system.
a. How much income does an unemployed person have per day? How much daily income
does an individual who works four hours per day have? How many hours do you need to
work to earn just the same as if you were unemployed?
b. Will anyone ever accept a part-time job that requires working four hours per day, rather
than being unemployed?
c. Suppose that Notchingham now changes the way in which the unemployment benefit is
withdrawn. For each additional dollar an individual earns, $0.50 of the unemployment
benefit is withdrawn. How much daily income does an individual who works four hours per
day now have? Is there an incentive now to work four hours per day rather than being
unemployed?
Solution 14

Question 15
15. The accompanying table shows data on the total number of people in the United States and
the number of all people who were uninsured, for selected years from 2003 to 2015. It also
shows data on the total number of poor children in the United States—those under 18 and
below the poverty threshold—and the number of poor children who were uninsured.
Year
Total
people
Unins
ured
people
Total poor
children
Uninsured poor
children
(millions)
2003
288.3
43.4
12.9
8.3
2005
293.8
44.8
12.9
8.0
2007
299.1
45.7
13.3
8.1
2009
304.3
50.7
15.5
7.5
2011
308.8
48.6
16.1
7.0
2013
313.1
41.8
15.8
5.4
2015
318.4
29.0
14.5
4.5
Data
from:
U.S.
Census
Bureau
.
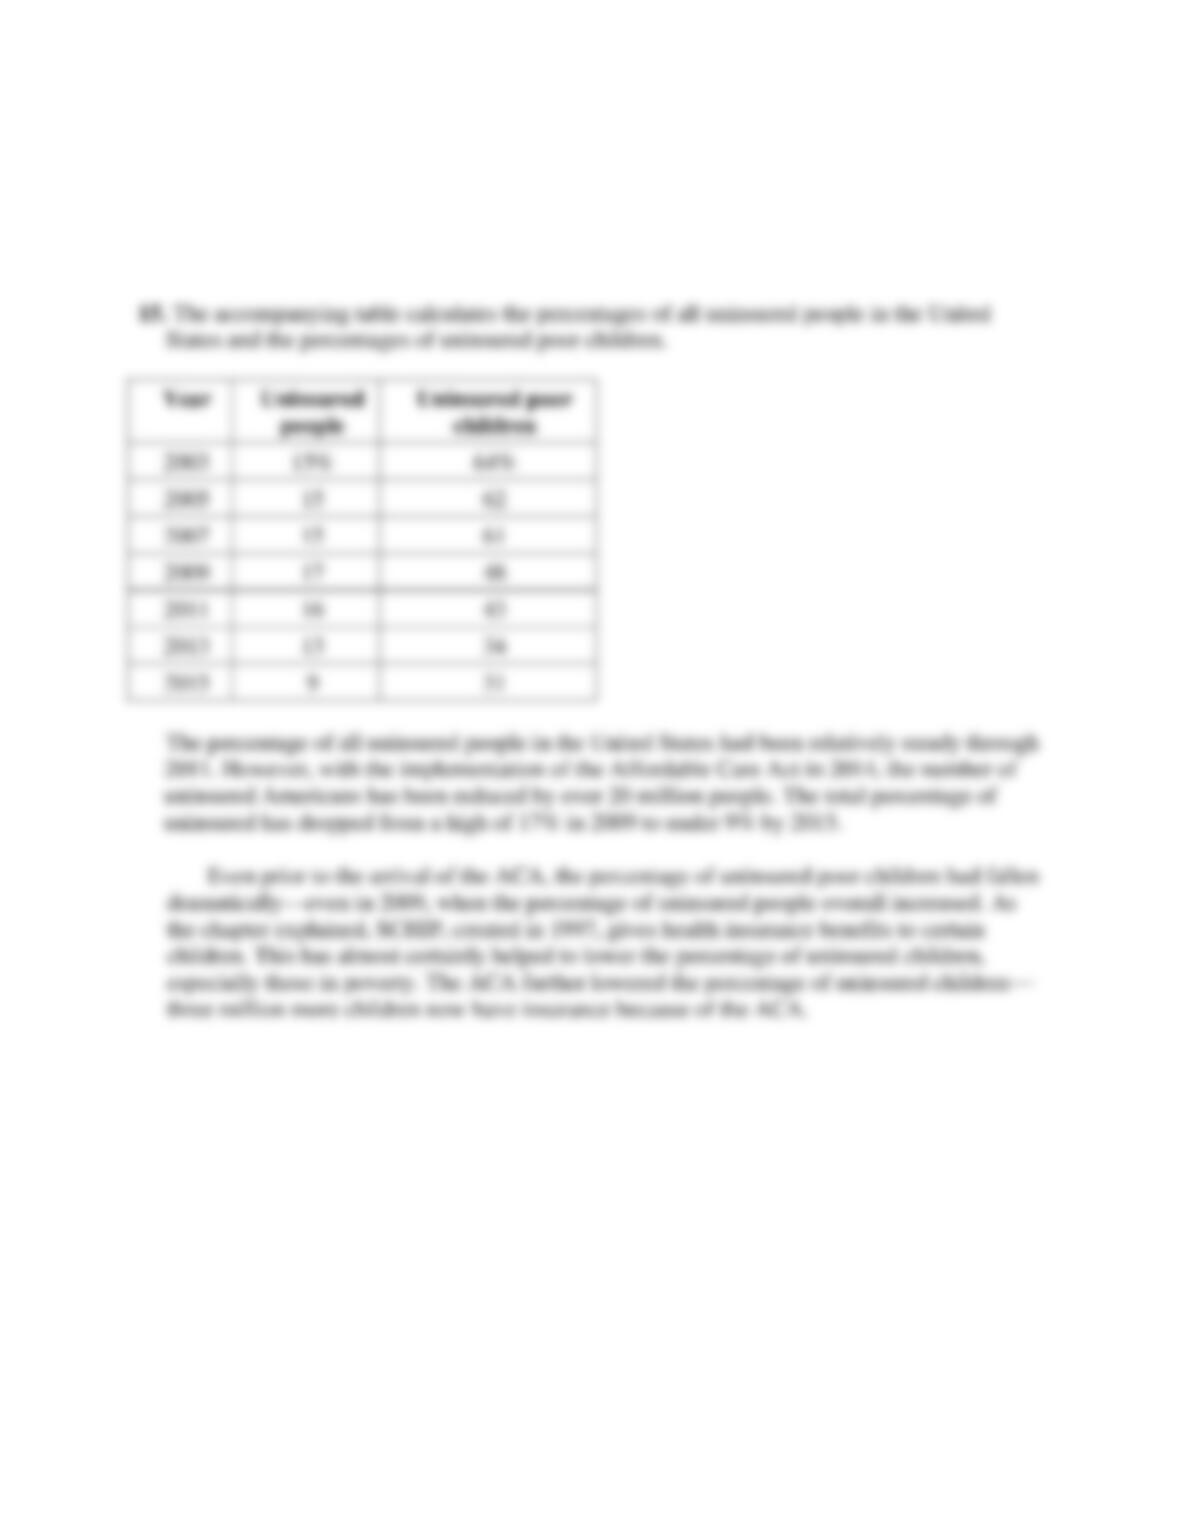
For each year, calculate the percentage of all people who were uninsured and the percentage
of poor children who were uninsured. How have these percentages changed over time? What
is a possible explanation for the change in the percentage of uninsured poor children?
Solution 15
Question 16
16. For this Discovering Data exercise, go to FRED (fred.stlouisfed.org) to create a line graph
that compares poverty rates for different counties across the United States. In the search bar
enter “Estimated Percent of People of All Ages in Poverty for United States” and select the
subsequent series. Follow the steps below to add the series for additional counties. Then
answer the questions that follow.
i. Select “Edit Graph” and under “Add Line” enter “Estimated Percent of People in Poverty
for Wayne County, MI,” which includes Detroit, Michigan.
ii. Repeat step i to add the following counties:

i. King County, WA (for Seattle, Washington)
ii. Miami-Dade County, FL (for Miami, Florida)
iii. San Francisco County/City, CA (for San Francisco, California)
iv. Cuyahoga County, OH (for Cleveland, OH)
iii In the graph frame change the start date to 1997-01-01 and the end date to 2014-01-01.
a. Which counties have the lowest poverty rates? Highest? How do poverty rates compare to
the national average?
b. How has the difference in poverty rates changed from 2004 (prior to the Great Recession)
to 2012 (after the Great Recession)?
c. Create a second line graph including “Estimated Percent of People of All Ages in Poverty
for United States” and a second line with your home county. How does the poverty rate in
your home county compare with that of the national average?
Solution 16
Question 17
WORK IT OUT Interactive step-by-step help with solving this problem can be found
online.
17. Patty’s Pizza Parlor has the production function per hour shown in the accompanying table.
The hourly wage rate for each worker is $10. Each pizza sells for $2.
Quantity of
labor
(workers)
Quantity of
pizza
0
0
1
9
2
15
3
19
4
22
5
24
a. Calculate the marginal product of labor for each worker and the value of the marginal
product of labor per worker.
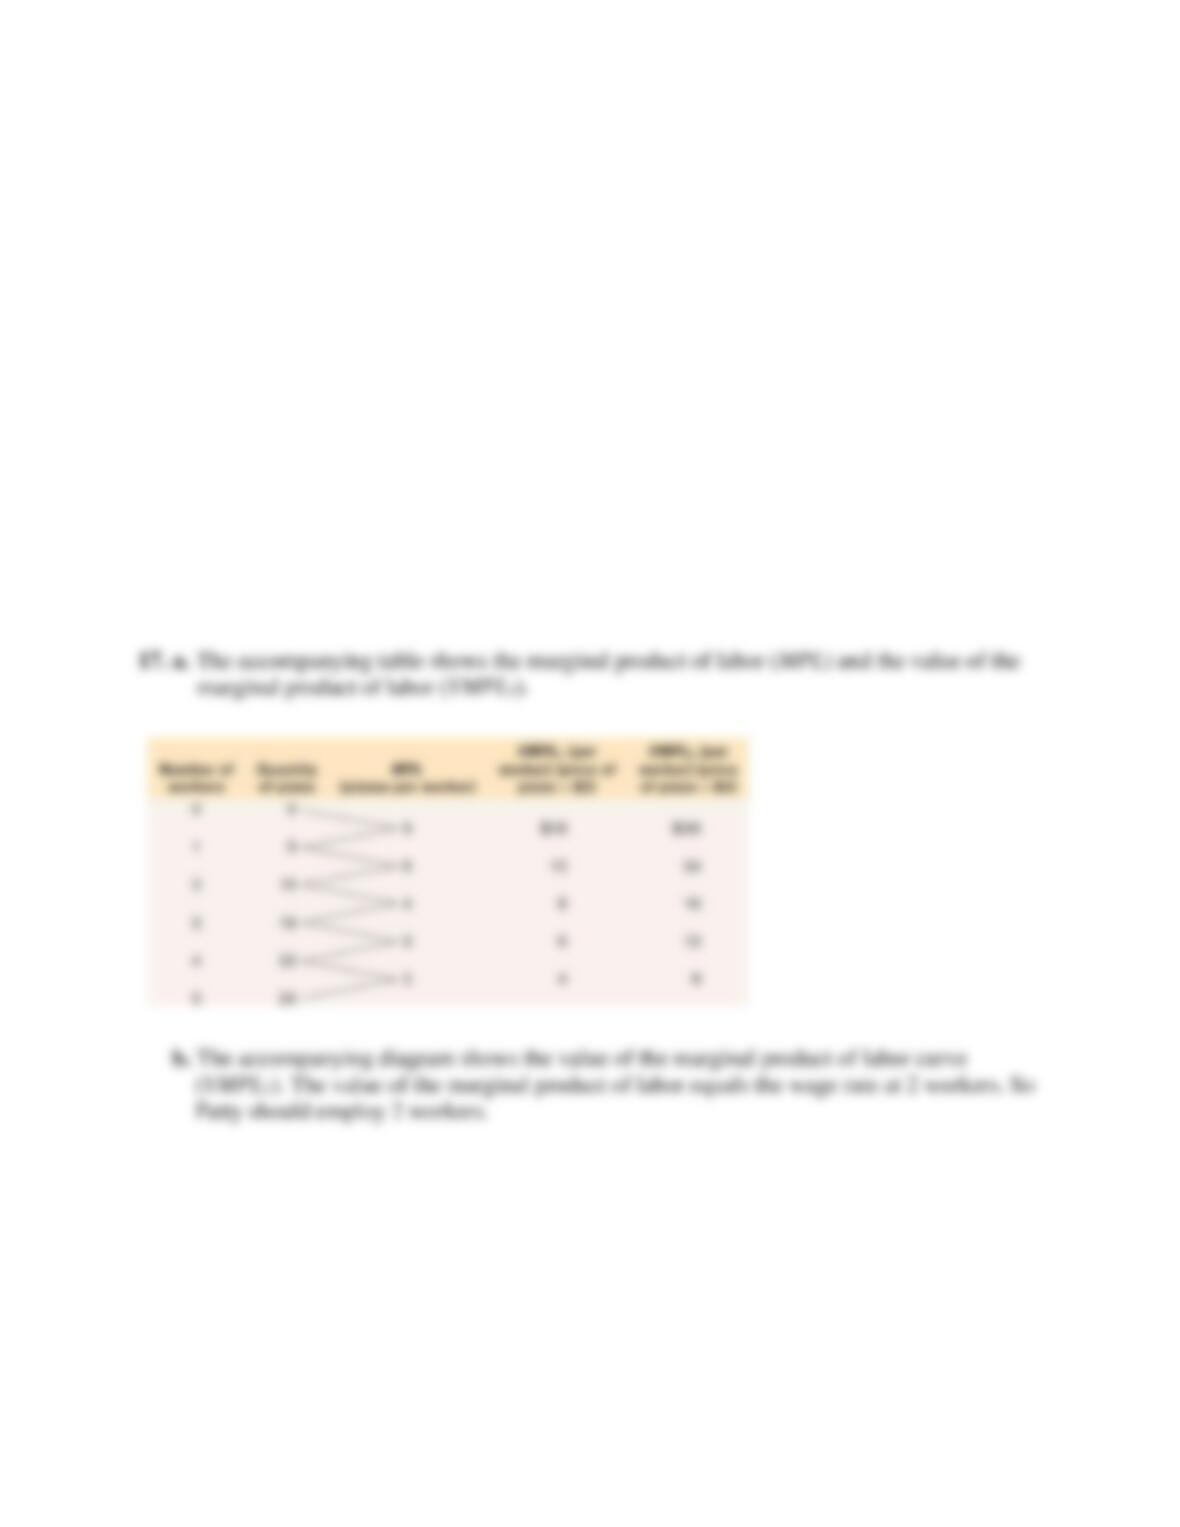
b. Draw the value of the marginal product of labor curve. Use your diagram to determine
how many workers Patty should employ.
c. The price of pizza increases to $4. Calculate the value of the marginal product of labor per
worker, and draw the new value of the marginal product of labor curve in your diagram.
Use your diagram to determine how many workers Patty should employ now.
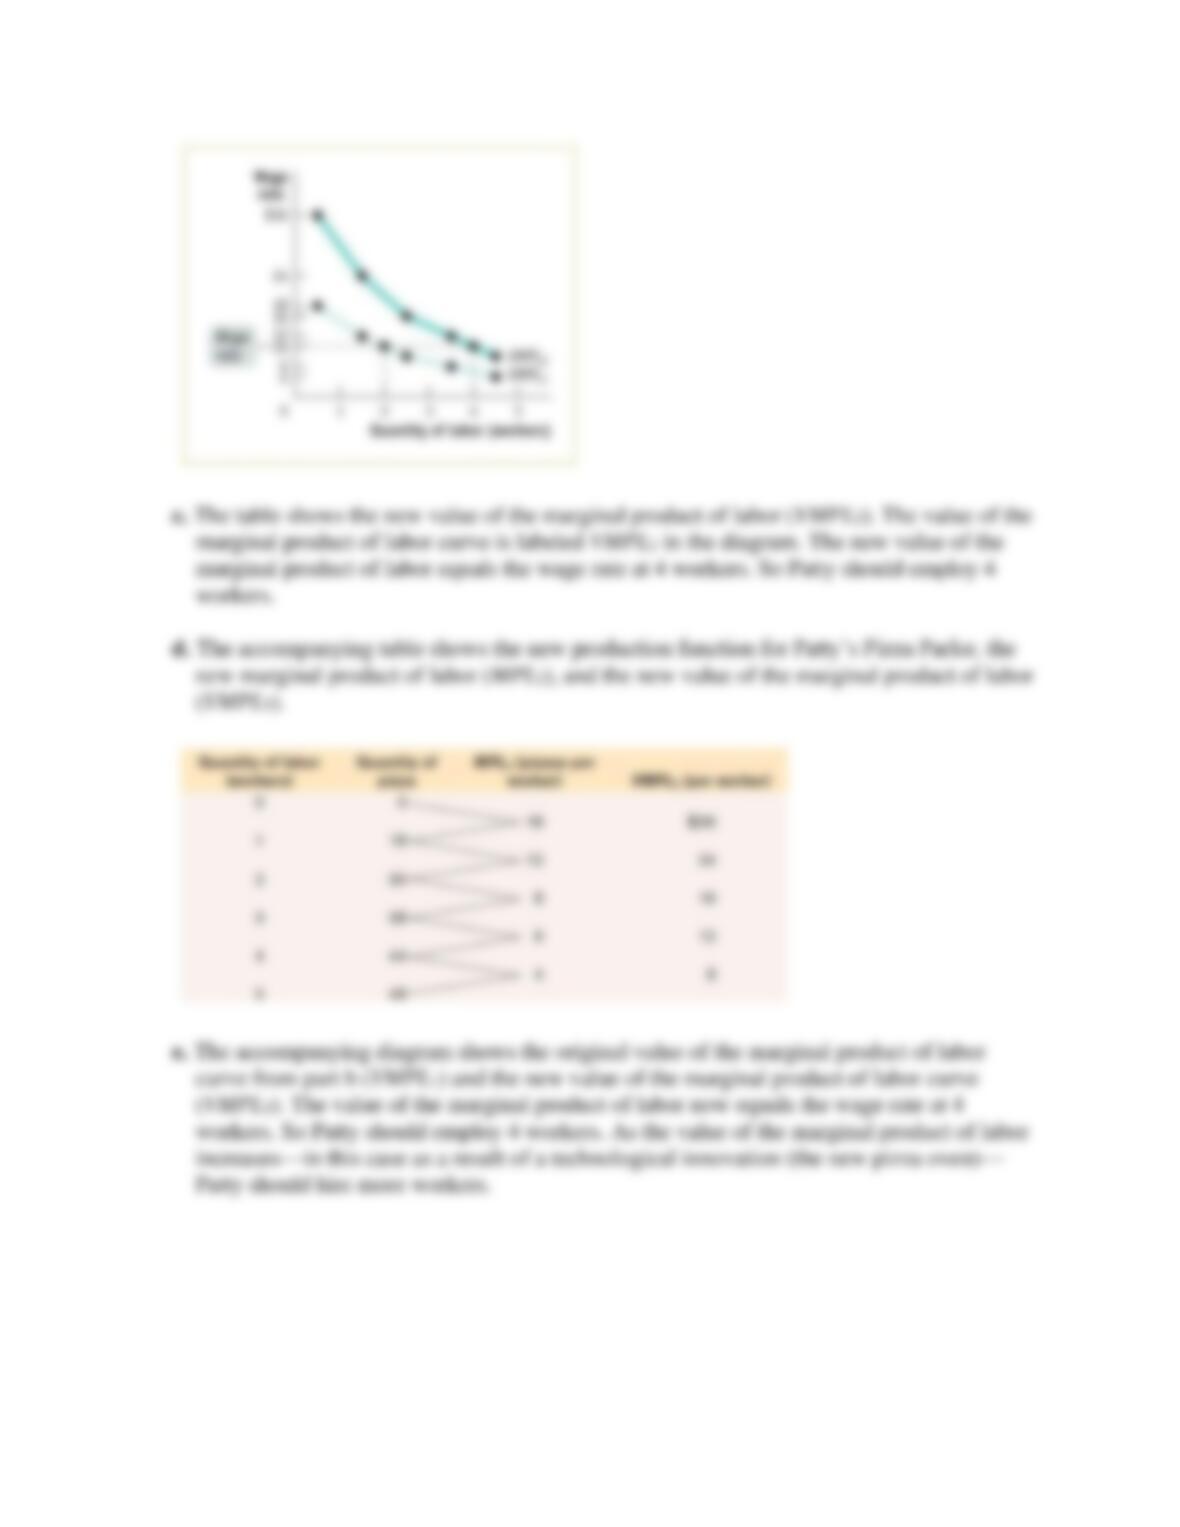
Now let’s assume that Patty buys a new high-tech pizza oven that allows her workers to
become twice as productive as before. That is, the first worker now produces 18 pizzas per
hour instead of 9, and so on.
d. Calculate the new marginal product of labor and the new value of the marginal product of
labor at the original price of $2 per pizza.
e. Use a diagram to determine how Patty’s hiring decision responds to this increase in the
productivity of her workforce.
Solution 17