Section 1 Appendix: Graphs in Economics
Question 1
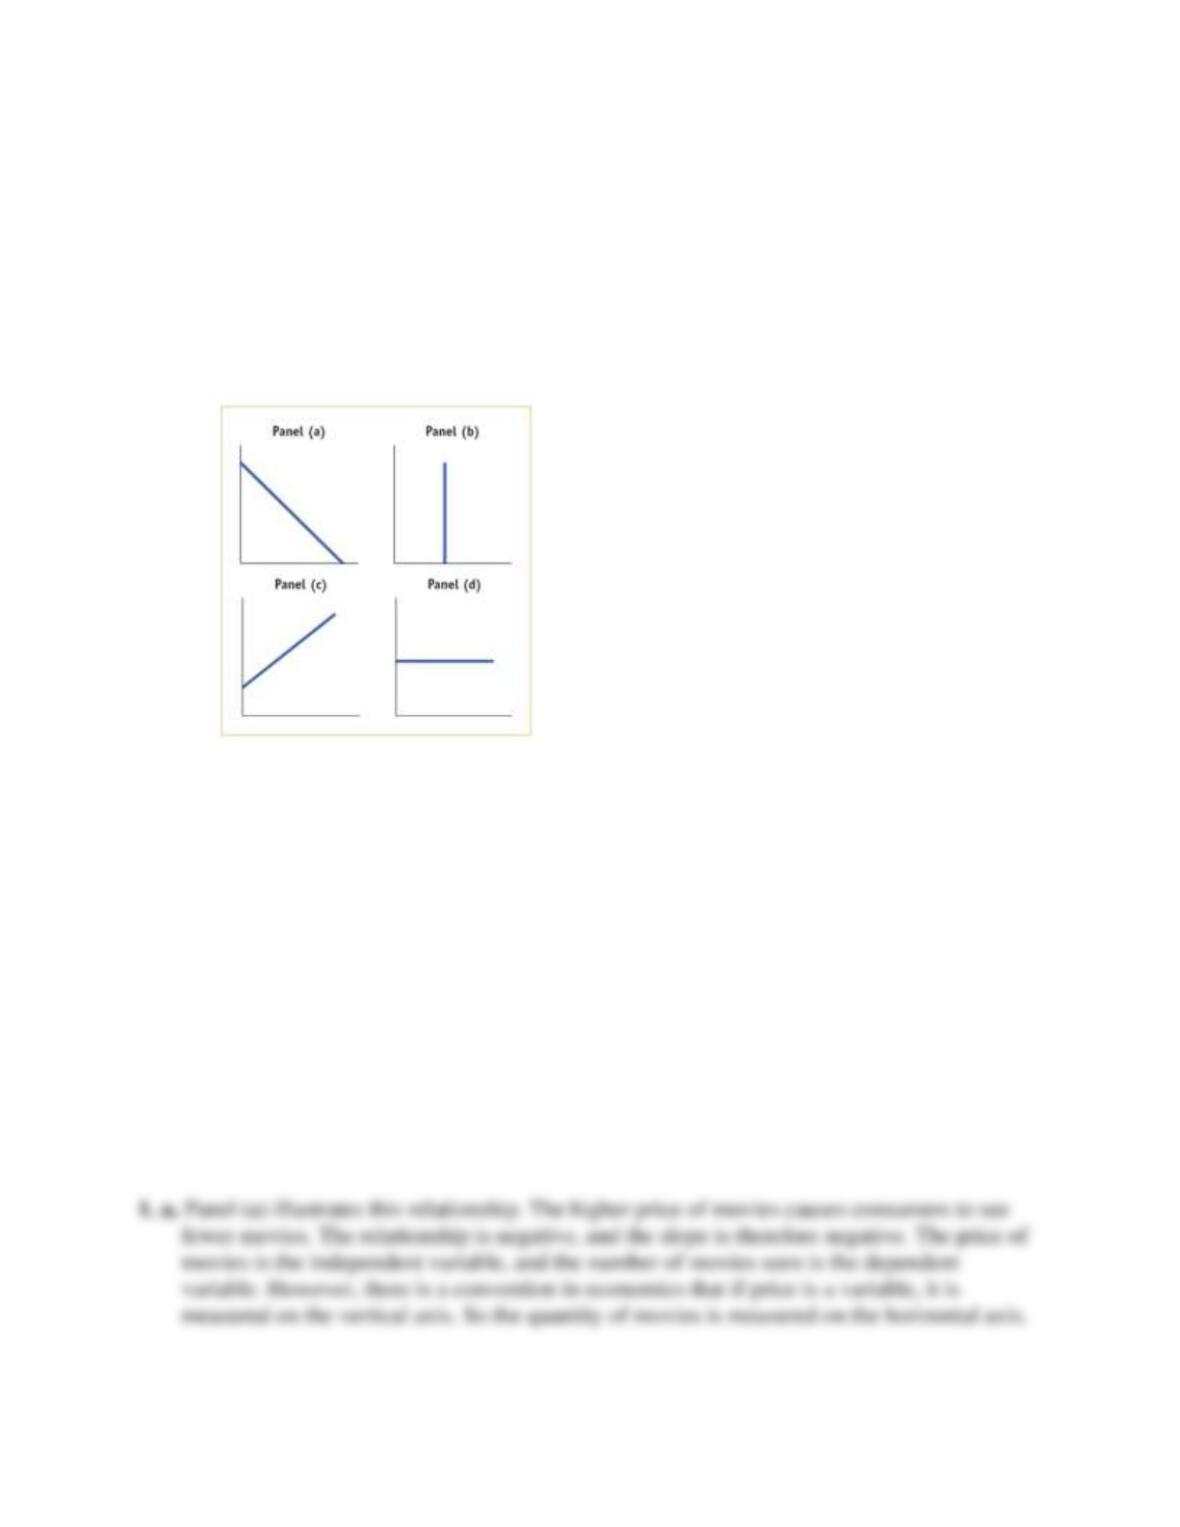
1. Study the four accompanying diagrams. Consider the following statements and indicate
which diagram matches each statement. Which variable would appear on the horizontal
and which on the vertical axis? In each of these statements, is the slope positive, negative,
zero, or infinity?
a. If the price of movies increases, fewer consumers go to see movies.
b. More experienced workers typically have higher incomes than less experienced workers.
c. Whatever the temperature outside, Americans consume the same number of hot dogs per
day.
d. Consumers buy more frozen yogurt when the price of ice cream goes up.
e. Research finds no relationship between the number of diet books purchased and the number
of pounds lost by the average dieter.
f. Regardless of its price, Americans buy the same quantity of salt.
Solution 1
Question 2
2. During the Reagan administration, economist Arthur Laffer argued in favor of lowering
income tax rates in order to increase tax revenues. Like most economists, he believed that at
tax rates above a certain level, tax revenue would fall because high taxes would discourage
some people from working and that people would refuse to work at all if they received no
income after paying taxes. This relationship between tax rates and tax revenue is graphically
summarized in what is widely known as the Laffer curve. Plot the Laffer curve relationship
assuming that it has the shape of a nonlinear curve. The following questions will help you
construct the graph.
a. Which is the independent variable? Which is the dependent variable? On which axis do you
therefore measure the income tax rate? On which axis do you measure income tax revenue?
b. What would tax revenue be at a 0% income tax rate?
c. The maximum possible income tax rate is 100%. What would tax revenue be at a 100%
income tax rate?
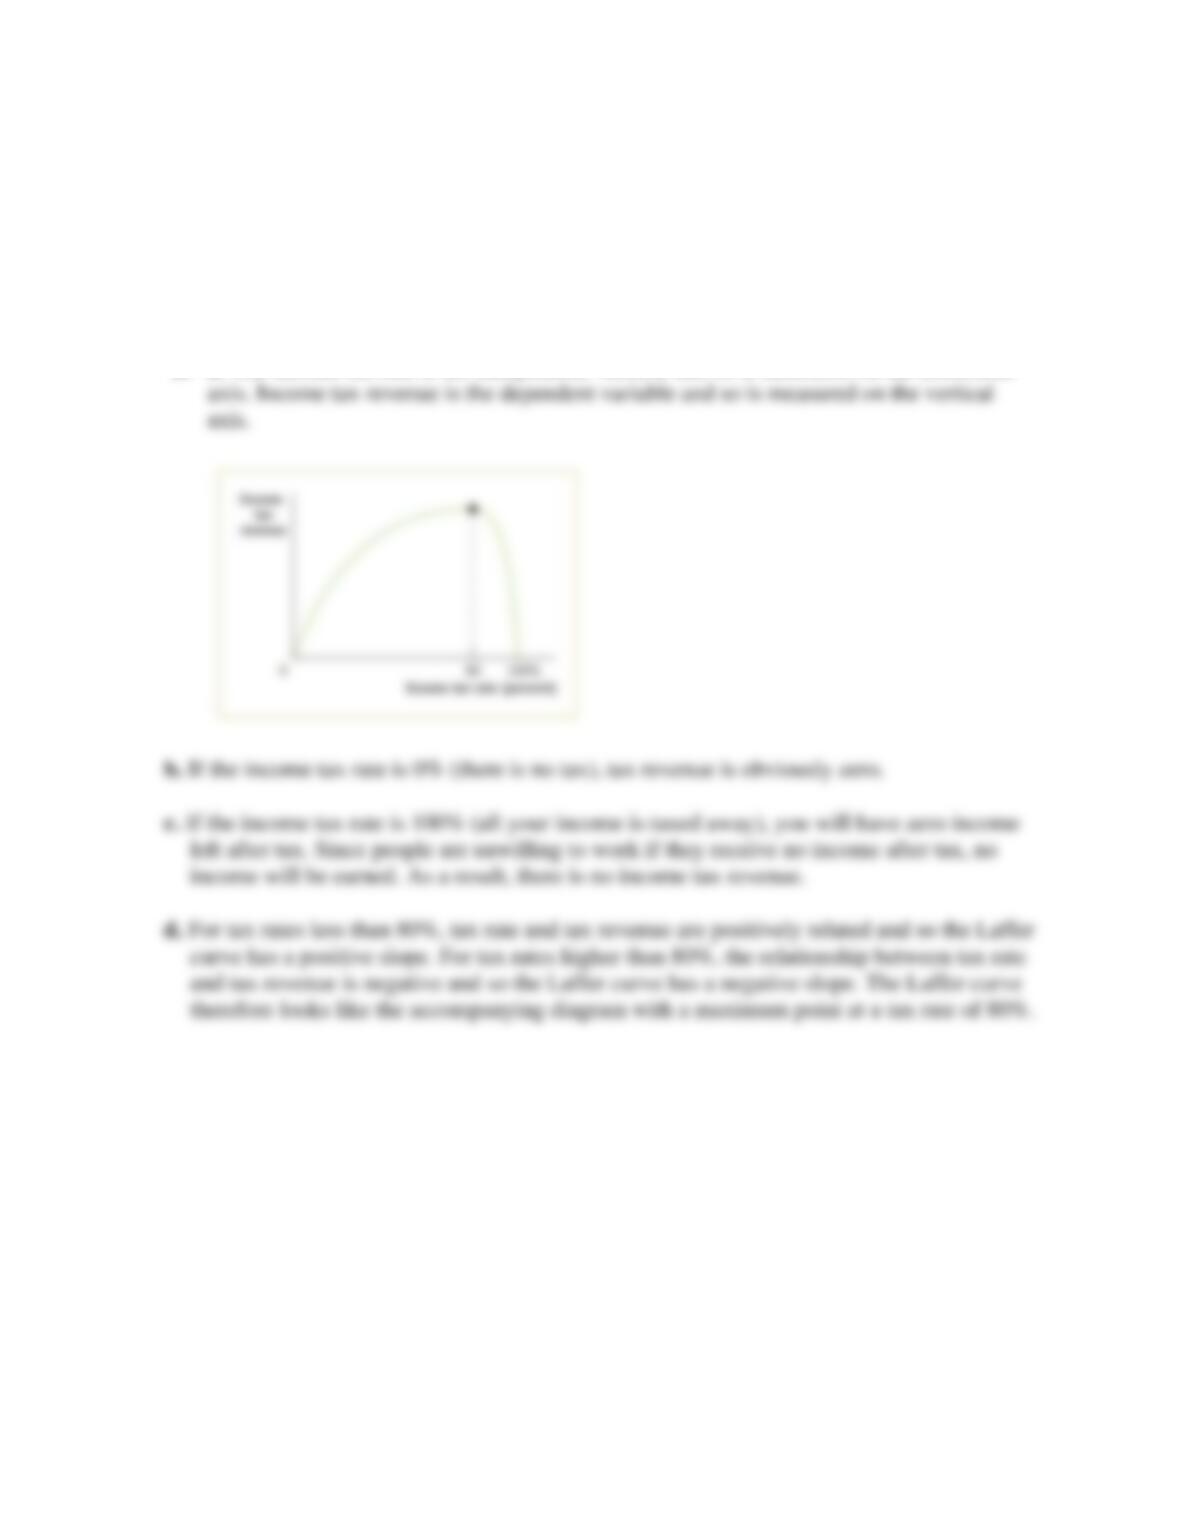
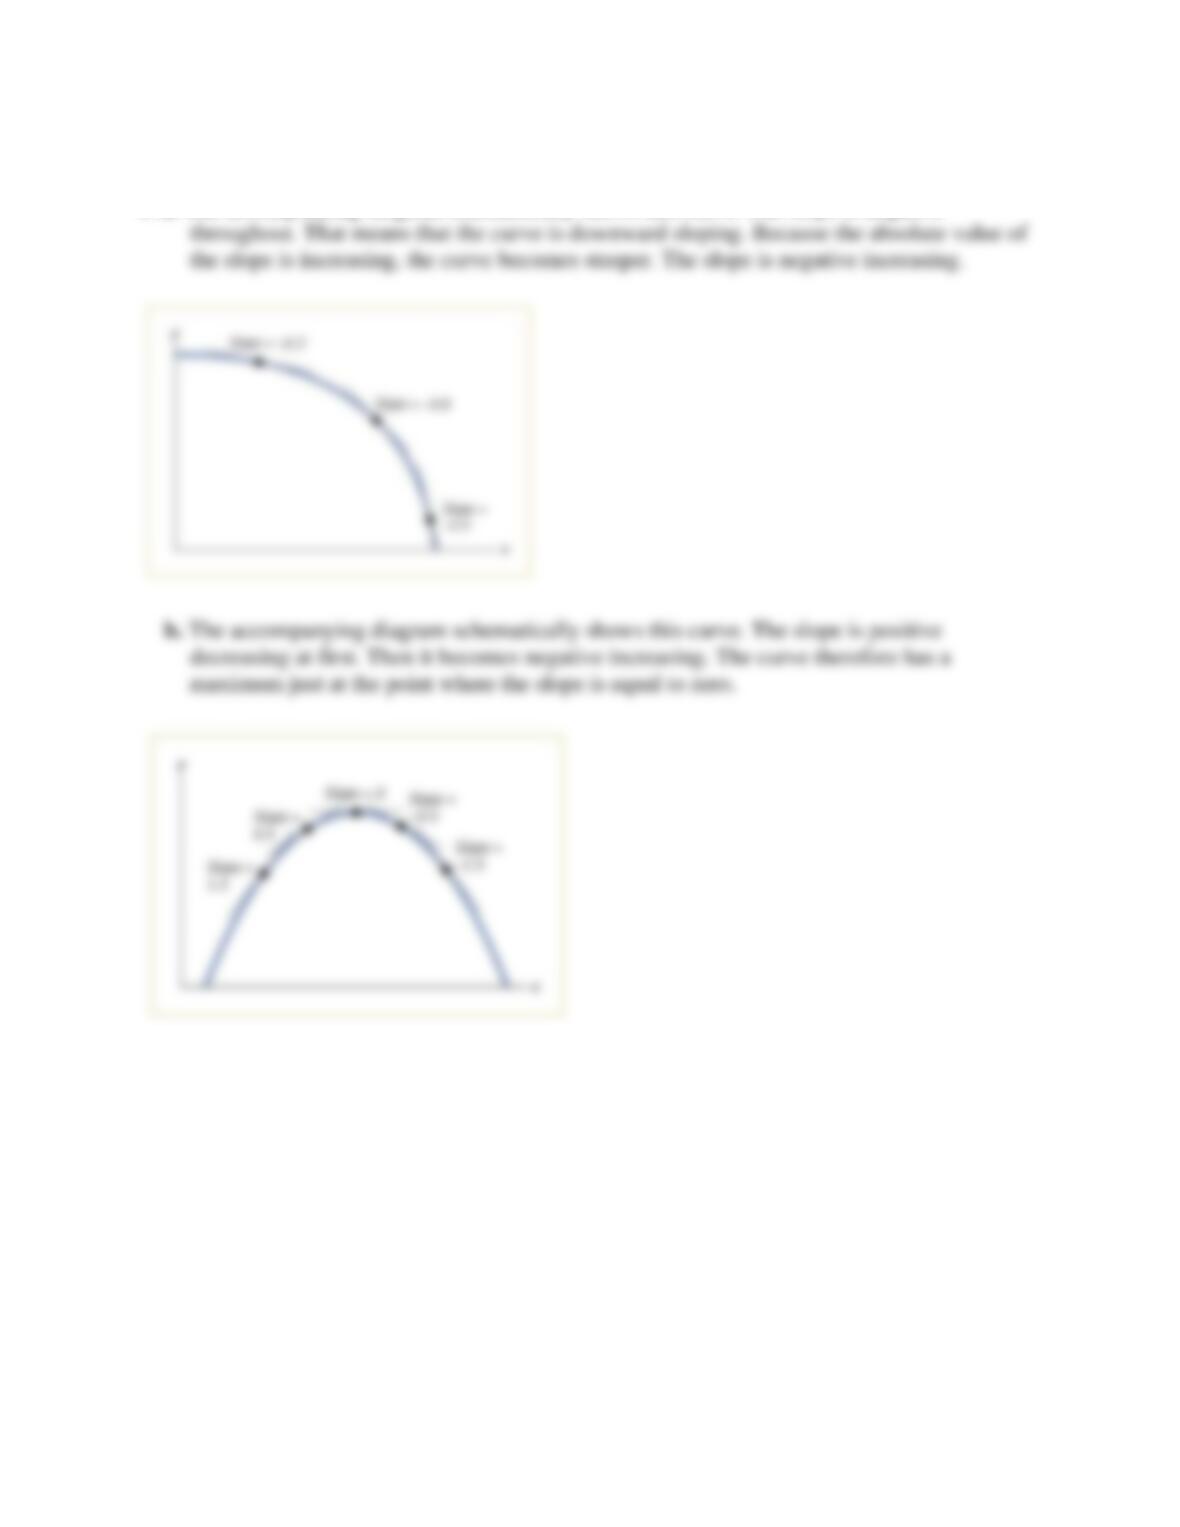
d. Estimates now show that the maximum point on the Laffer curve is (approximately) at a tax
rate of 80%. For tax rates less than 80%, how would you describe the relationship between
the tax rate and tax revenue, and how is this relationship reflected in the slope? For tax
rates higher than 80%, how would you describe the relationship between the tax rate and
tax revenue, and how is this relationship reflected in the slope?
Solution 2
2. a. The income tax rate is the independent variable and so is measured on the horizontal
Question 3
3. In the accompanying figures, the numbers on the axes have been lost. All you know is that the
units shown on the vertical axis are the same as the units on the horizontal axis.
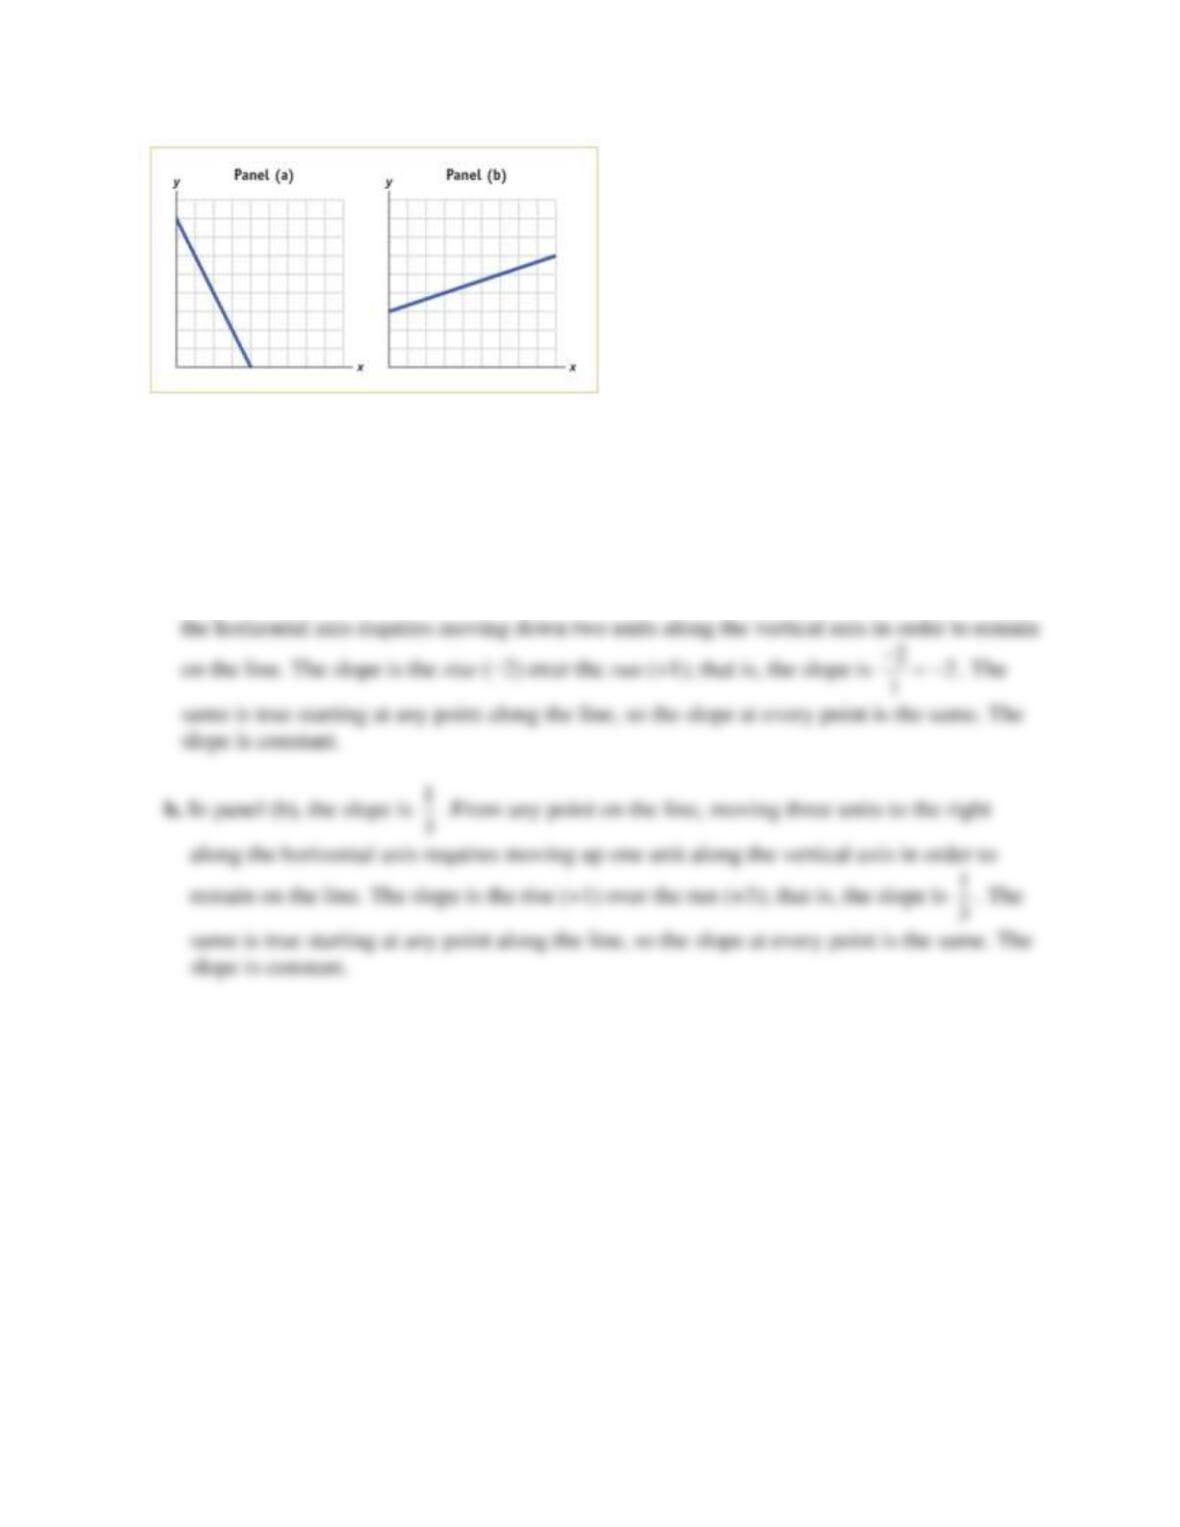
a. In panel (a), what is the slope of the line? Show that the slope is constant along the line.
b. In panel (b), what is the slope of the line? Show that the slope is constant along the line.
Solution 3
3. a. In panel (a), the slope is -2. From any point on the line, moving one unit to the right along
Question 4
4. Answer each of the following questions by drawing a schematic diagram.
a. Taking measurements of the slope of a curve at three points farther and farther to the right
along the horizontal axis, the slope of the curve changes from −0.3, to −0.8, to −2.5,
measured by the point method. Draw a schematic diagram of this curve. How would you
describe the relationship illustrated in your diagram?
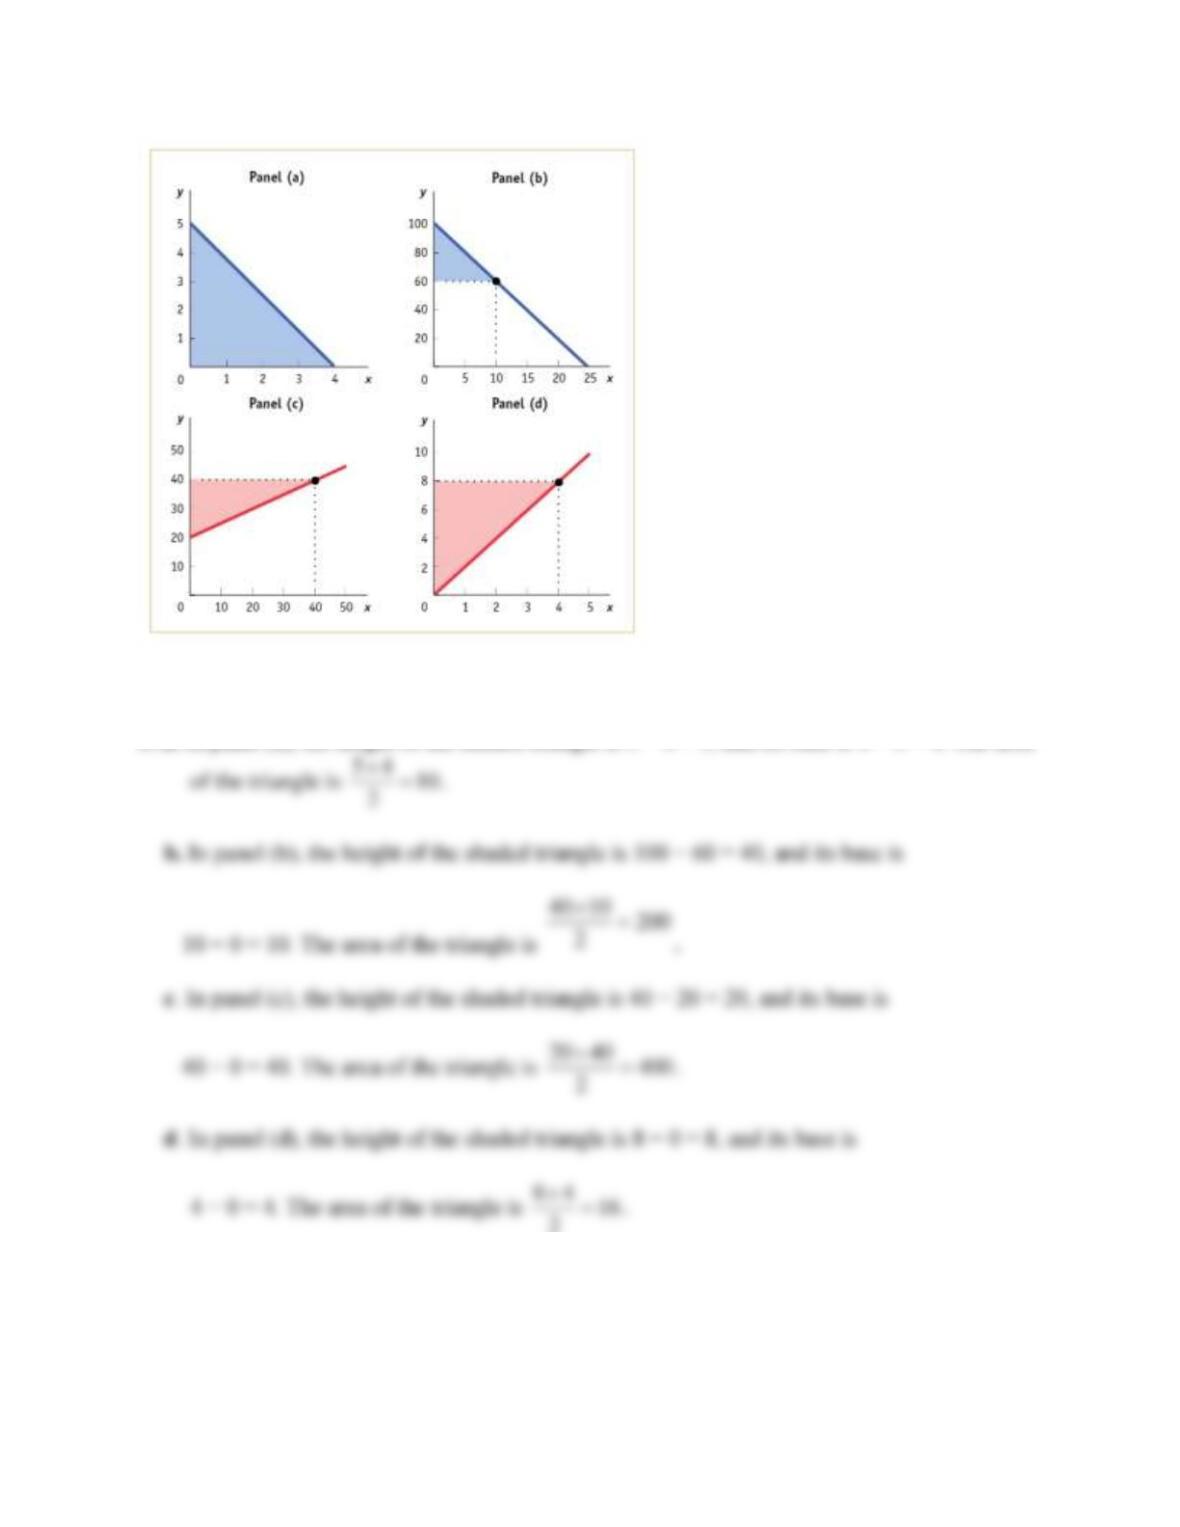
b. Taking measurements of the slope of a curve at five points farther and farther to the right
along the horizontal axis, the slope of the curve changes from 1.5, to 0.5, to 0, to −0.5, to
−1.5, measured by the point method. Draw a schematic diagram of this curve. Does it have
a maximum or a minimum?
Solution 4
4 .a. The accompanying diagram schematically shows this curve. The slope is negative
Question 5
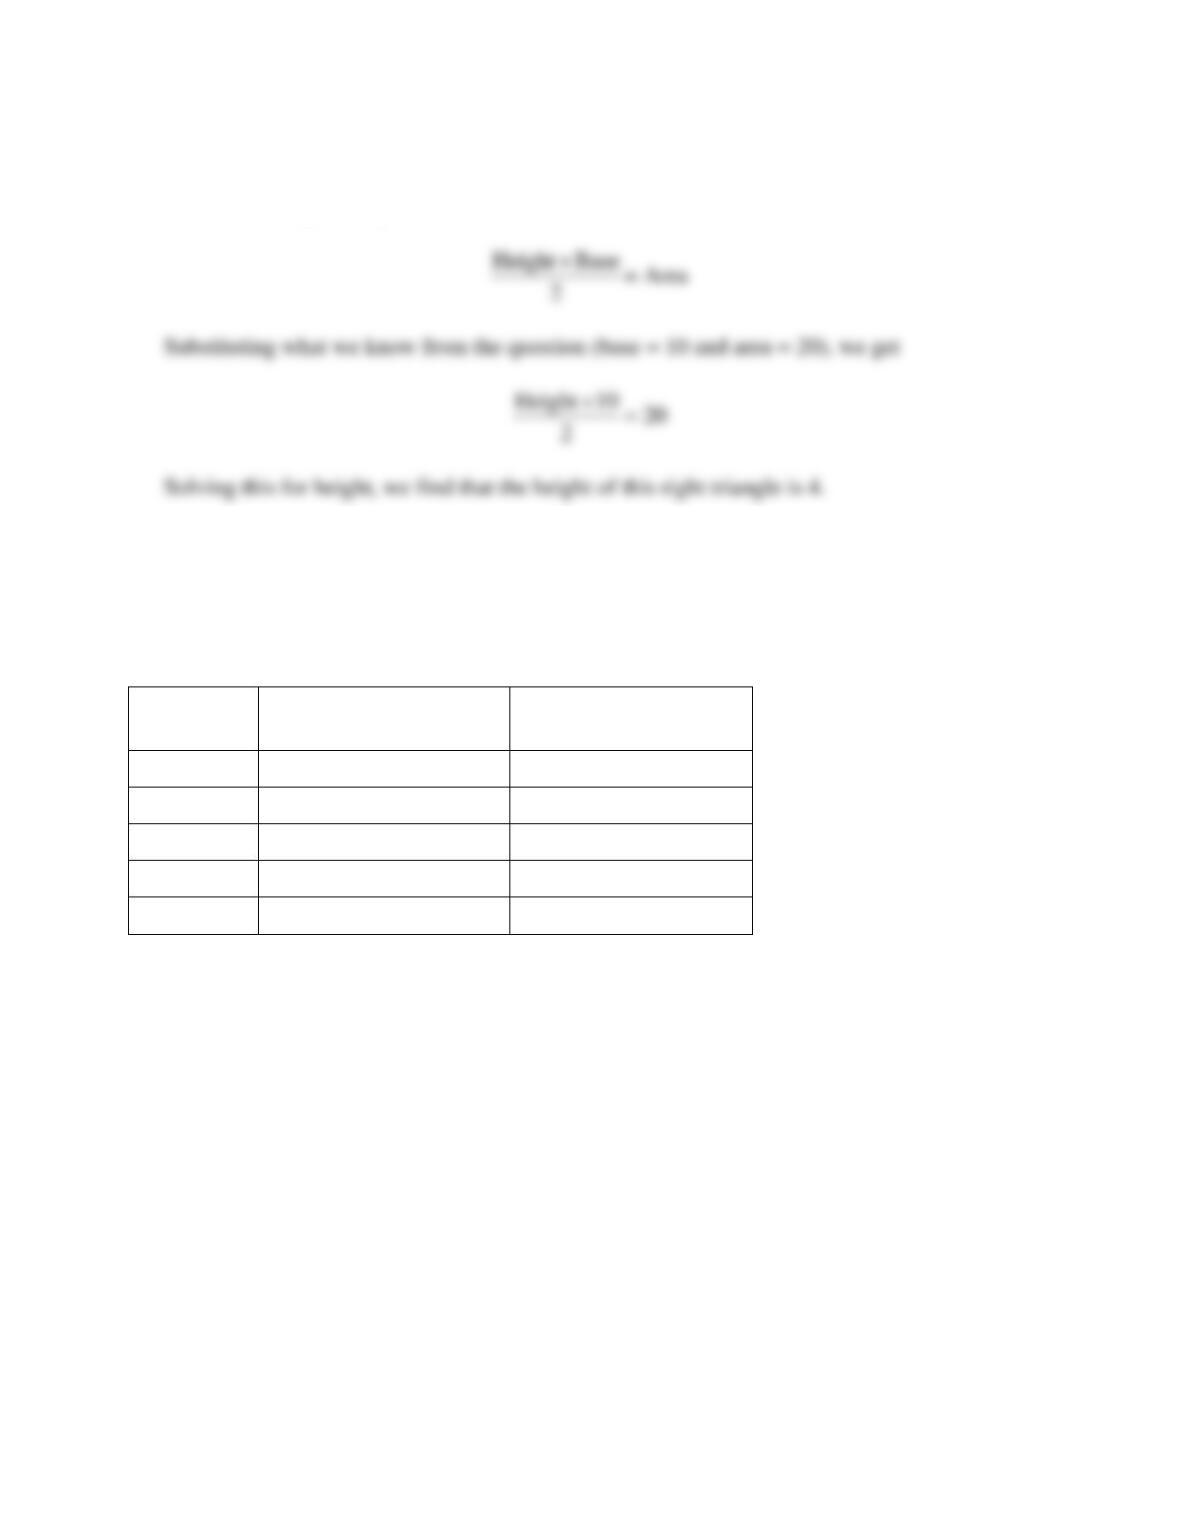
5. For each of the accompanying diagrams, calculate the area of the shaded right triangle.
Solution 5
5. a. In panel (a), the height of the shaded triangle is 5 − 0 = 5, and its base is 4 − 0 = 4. The area
2
Question 6
6. The base of a right triangle is 10, and its area is 20. What is the height of this right triangle?
Solution 6
6. The area of a right triangle is calculated as
Question 7
7. The accompanying table shows the relationship between workers’ hours of work per week and
their hourly wage rate. Apart from the fact that they receive a different hourly wage rate and
work different hours, these five workers are otherwise identical.
Name
Quantity of labor
(hours per week)
Wage rate (per
hour)
Athena
30
$15
Boris
35
30
Curt
37
45
Diego
36
60
Emily
32
75
a. Which variable is the independent variable? Which is the dependent variable?
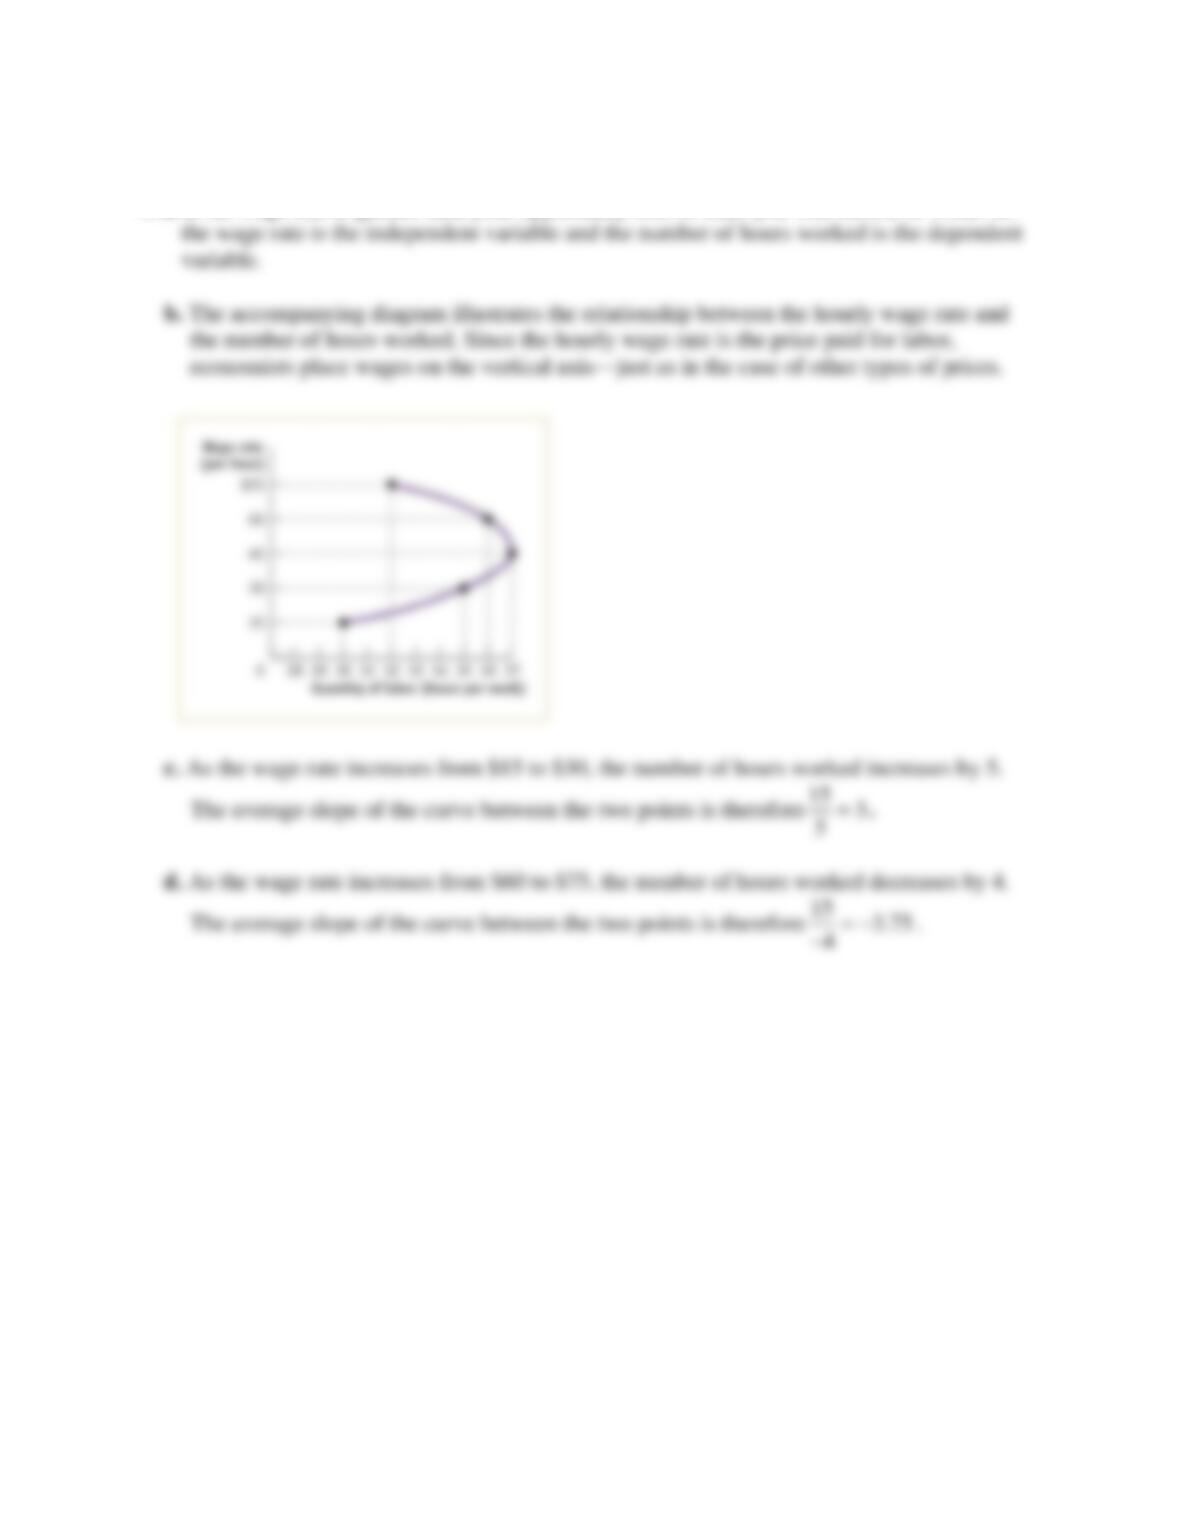
b. Draw a scatter diagram illustrating this relationship. Draw a (nonlinear) curve that connects
the points. Put the hourly wage rate on the vertical axis.
c. As the wage rate increases from $15 to $30, how does the number of hours worked respond
according to the relationship depicted here? What is the average slope of the curve between
Athena’s and Boris’s data points using the arc method?
d. As the wage rate increases from $60 to $75, how does the number of hours worked respond
according to the relationship depicted here? What is the average slope of the curve between
Diego’s and Emily’s data points using the arc method?
Solution 7
7. a. If the wage rate is greater than your opportunity cost of time, you will choose to work. So
Question 8
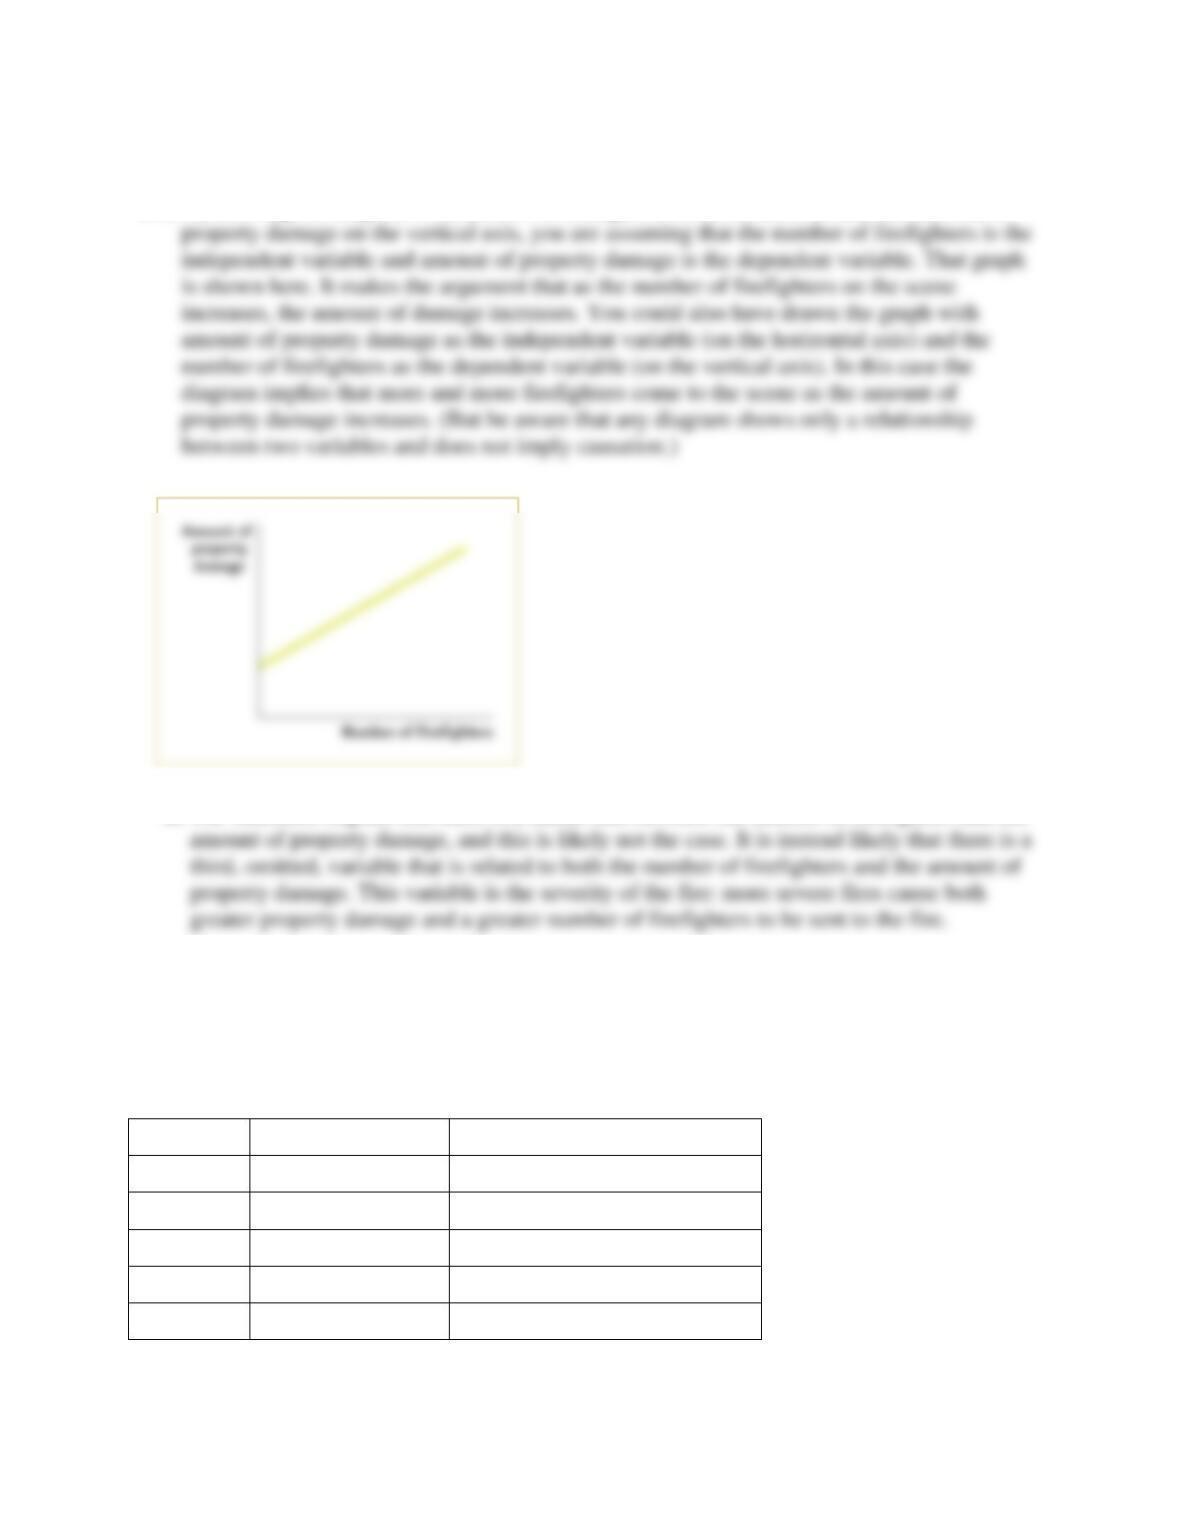
8. An insurance company has found that the severity of property damage in a fire is positively
related to the number of firefighters arriving at the scene.
a. Draw a diagram that depicts this finding with number of firefighters on the horizontal axis
and amount of property damage on the vertical axis. What is the argument made by this
diagram? Suppose you reverse what is measured on the two axes. What is the argument
made then?
b. Should the insurance company ask the city to send fewer firefighters to any fire in order to
reduce its payouts to policy holders?
Solution 8
8. a. By drawing the diagram with number of firefighters on the horizontal axis and amount of
b. The statement implies that there is a causal link between the number of firefighters and the
Question 9
9. This table illustrates annual salaries and income tax owed by five individuals. Despite
receiving different annual salaries and owing different amounts of income tax, these five
individuals are otherwise identical.
Name
Annual salary
Annual income tax owed
Susan
$22,000
$3,304
Eduardo
63,000
14,317
John
3,000
454
Camila
94,000
23,927
Peter
37,000
7,020
a. If you were to plot these points on a graph, what would be the average slope of the curve
between the points for Eduardo’s and Camila’s salaries and taxes using the arc method?
How would you interpret this value for slope?
b. What is the average slope of the curve between the points for John’s and Susan’s salaries
and taxes using the arc method? How would you interpret that value for slope?
c. What happens to the slope as salary increases? What does this relationship imply about how
the level of income taxes affects a person’s incentive to earn a higher salary?
Solution 9
9. a. Annual salary is the independent variable and so is measured on the horizontal axis. Annual
[Start Box]
Question 10
WORK IT OUT Interactive step-by-step help with solving this problem can be found online.
10. Studies have found a relationship between a country’s yearly rate of economic growth and
the yearly rate of increase in airborne pollutants. It is believed that a higher rate of economic
growth allows a country’s residents to have more cars and travel more, thereby releasing
more airborne pollutants.
a. Which variable is the independent variable? Which is the dependent variable?
b. Suppose that in the country of Sudland, when the yearly rate of economic growth fell from
3.0% to 1.5%, the yearly rate of increase in airborne pollutants fell from 6% to 5%. What
is the average slope of a nonlinear curve between these points using the arc method?
c. Assume that when the yearly rate of economic growth rose from 3.5% to 4.5%, the yearly
rate of increase in airborne pollutants rose from 5.5% to 7.5%. What is the average slope
of a nonlinear curve between these two points using the arc method?
d. How would you describe the relationship between the two variables here?
[End Box]
Solution 10
10. a. According to the question, economic growth causes the increase in airborne pollutants.