Section 5: International Trade
Question 1
1. For each of the following trade relationships, explain the likely source of the comparative
advantage of each of the exporting countries.
a. The United States exports software to Venezuela, and Venezuela exports oil to the United
States.
b. The United States exports airplanes to China, and China exports clothing to the United
States.
c. The United States exports wheat to Colombia, and Colombia exports coffee to the United
States.
Solution 1
Question 2
2. Shoes are labor-intensive and satellites are capital-intensive to produce. The United States has
abundant capital. China has abundant labor. According to the Heckscher–Ohlin model, which
good will China export? Which good will the United States export? In the United States, what
will happen to the price of labor (the wage) and to the price of capital?
Solution 2
Question 3
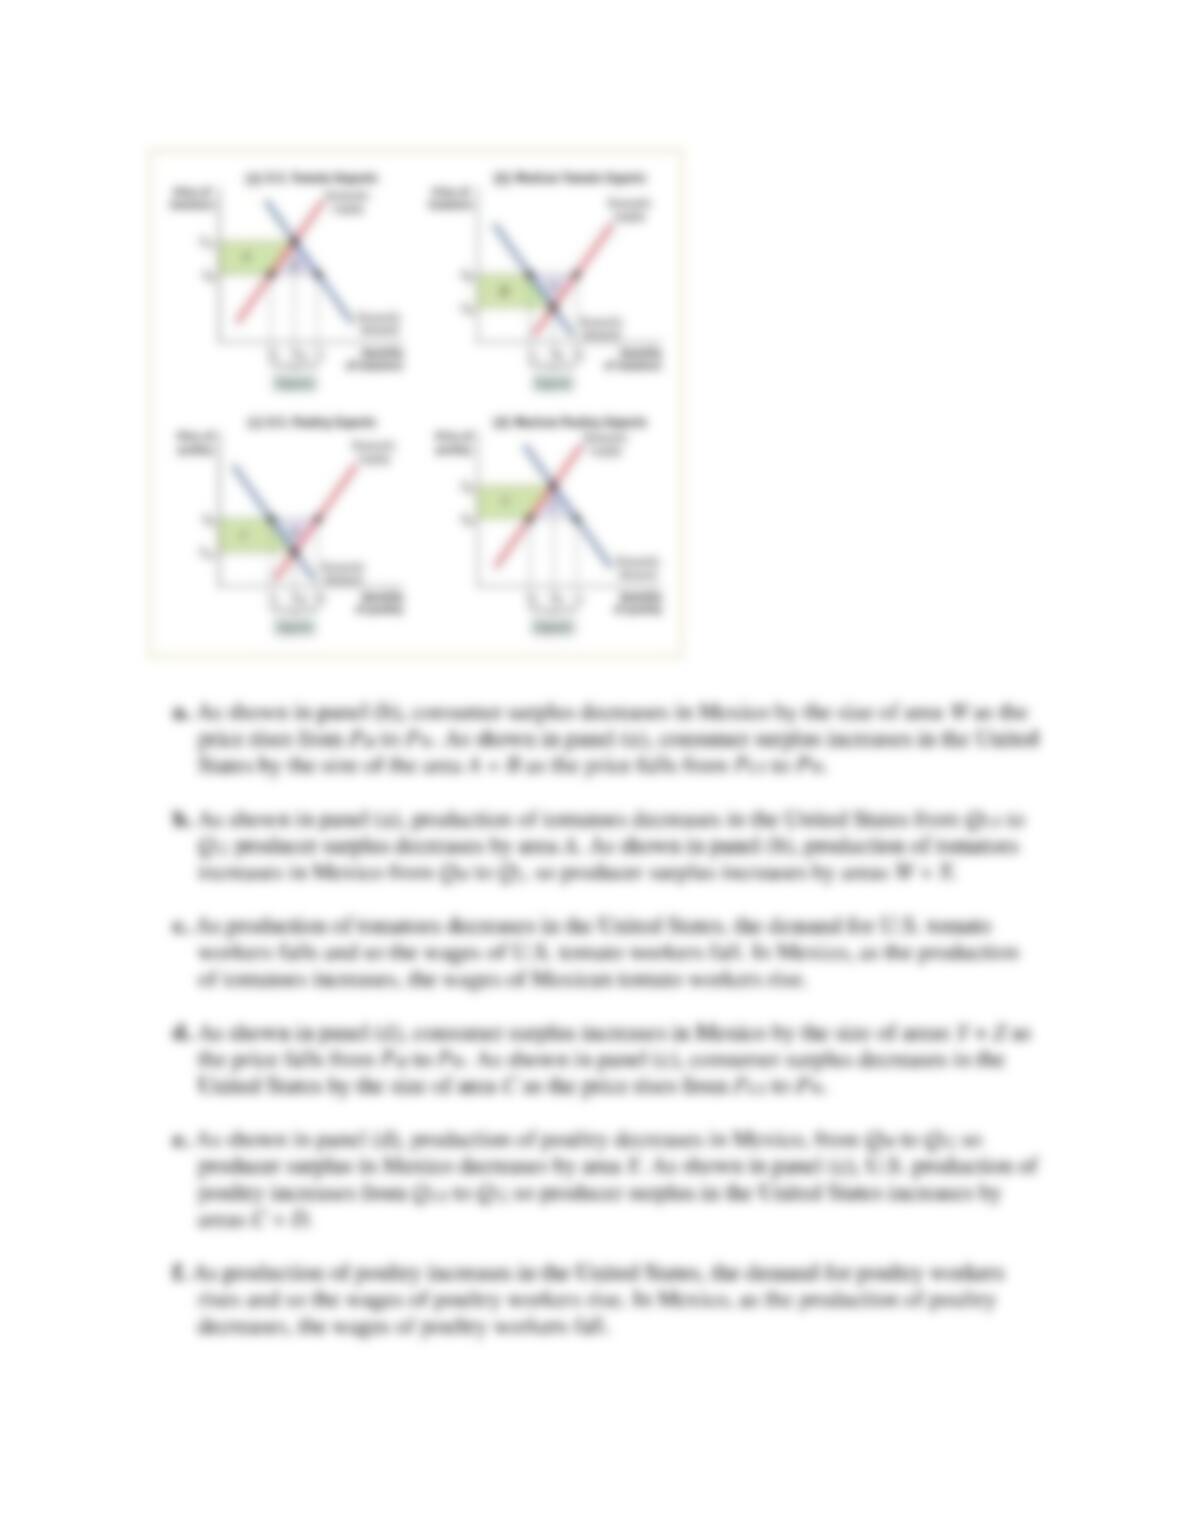
3. Before the North American Free Trade Agreement (NAFTA) gradually eliminated import
tariffs on goods, the autarky price of tomatoes in Mexico was below the world price and in
the United States was above the world price. Similarly, the autarky price of poultry in Mexico
was above the world price and in the United States was below the world price. Draw
diagrams with domestic supply and demand curves for each country and each of the two
goods. (You will need to draw four diagrams, total.) As a result of NAFTA, the United States
now imports tomatoes from Mexico and the United States now exports poultry to Mexico.
How would you expect the following groups to be affected?
a. Mexican and U.S. consumers of tomatoes. Illustrate the effect on consumer surplus in your
diagram.
b. Mexican and U.S. producers of tomatoes. Illustrate the effect on producer surplus in your
diagram.
c. Mexican and U.S. tomato workers.
d. Mexican and U.S. consumers of poultry. Illustrate the effect on consumer surplus in your
diagram.
e. Mexican and U.S. producers of poultry. Illustrate the effect on producer surplus in your
diagram.
f. Mexican and U.S. poultry workers.
Solution 3
Question 4
4. The accompanying table shows the U.S. domestic demand schedule and domestic supply
schedule for oranges. Suppose that the world price of oranges is $0.30 per orange.
Price of orange
Quantity of oranges
demanded (thousands)
Quantity of oranges
supplied (thousands)
$1.00
2
11
0.90
4
10
0.80
6
9
0.70
8
8
0.60
10
7
0.50
12
6
0.40
14
5
0.30
16
4
0.20
18
3
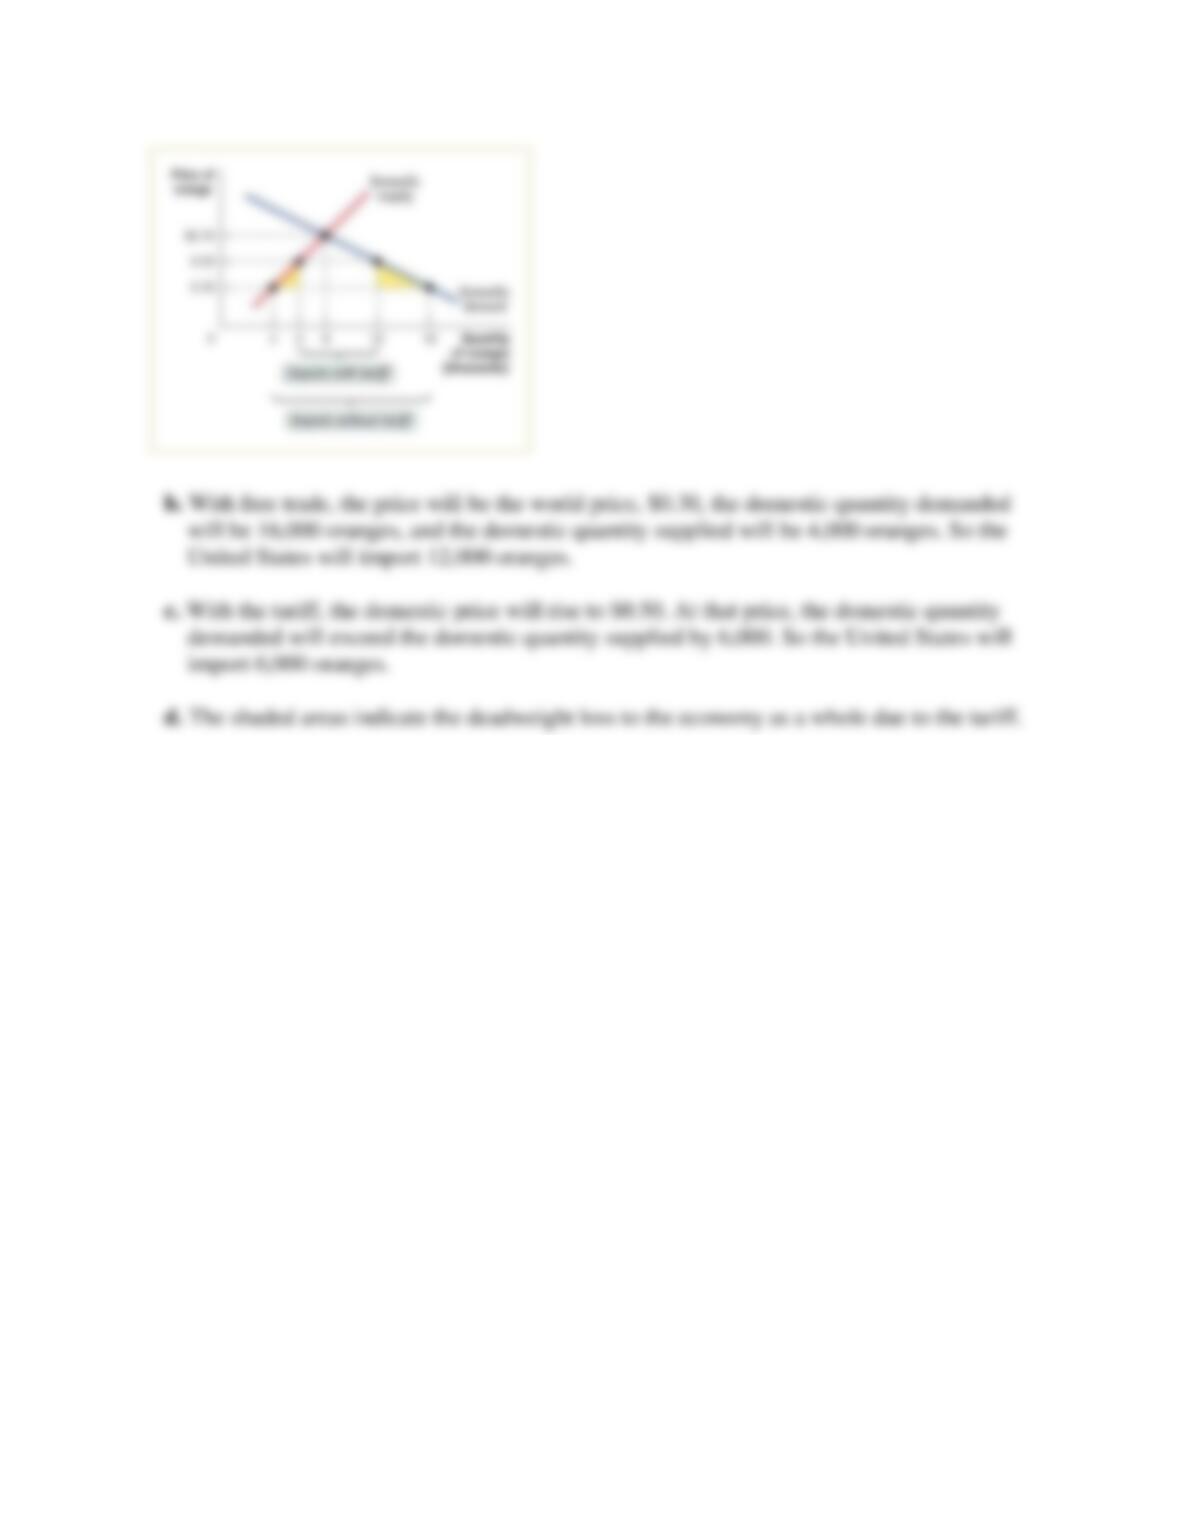
a. Draw the U.S. domestic supply curve and domestic demand curve.
b. With free trade, how many oranges will the United States import or export?
Suppose that the U.S. government imposes a tariff on oranges of $0.20 per orange.
c. How many oranges will the United States import or export after introduction of the tariff?
d. In your diagram, shade the gain or loss to the economy as a whole from the introduction of
this tariff.
Solution 4
Question 5
5. For this Discovering Data exercise, use FRED (fred.stlouisfed.org) to create a graph
comparing exports from California, Florida, Michigan, Pennsylvania, and Washington to
China. In the search bar enter “Value of exports to China from California” and select the
subsequent series. Follow the steps below to add the remaining states:
i. Select “Edit Graph,” under “Add Line” enter “Value of exports to China from Florida,”
then select “Add data series.”
ii. Repeat step i for Michigan, Pennsylvania, and Washington.
iii. In the date bar start the graph with 2002-01-01.
a. As of 2012, which two states exported the most goods to China? What were the dollar
values of those exports? Which three states exported the least to China?
b. How did exports to China change from 2002 to 2012? Construct a table to show the
change in the value of exports from 2002 to 2012 for each state.
Follow the steps below to edit your graph and calculate the percent of exports to China
relative to the total exports for each state:
i. Select “Edit Graph” and under “Edit Lines” select “Edit Line 1.”
ii. Under the heading “Customize Data” add “Value of Exports to World from California”
(hint: make sure the states match) and add the series.
iii. In the “Formula box” enter 100*(a/b) to create the percent term.
iv. Repeat steps i through iii for the remaining states.
c. As a percent of total exports, rank the states in order of most to fewest exports.
d. Washington State’s largest exports to China are airplanes from Boeing, licenses for the use
of Microsoft products, and the agricultural products wheat, apples, and hops. Microsoft
and Boeing produce unique products at a relatively high price but many other states
produce wheat, apples, and hops. The other states export largely regular goods to China.
How does this situation explain the pattern of exports to China across the states?
Solution 5
Question 6
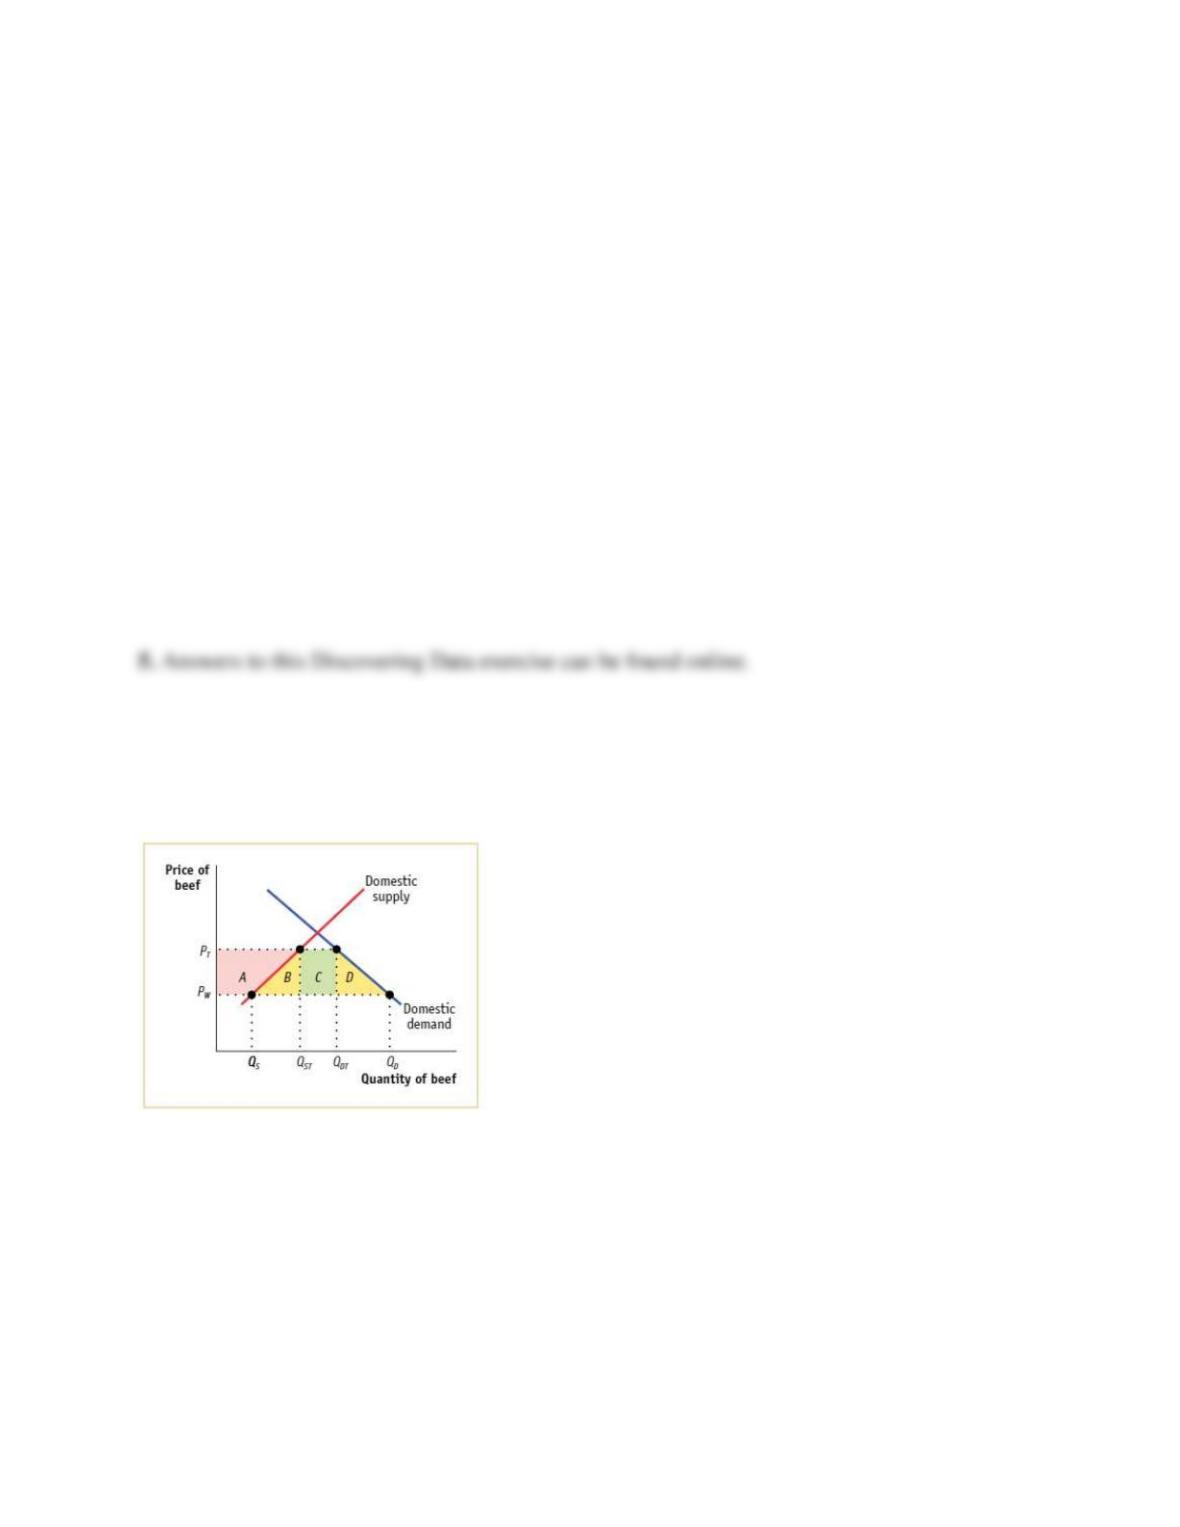
6. The accompanying diagram illustrates the U.S. domestic demand curve and domestic supply
curve for beef.
The world price of beef is PW. The United States currently imposes an import tariff on beef, so
the price of beef is PT. Congress decides to eliminate the tariff. In terms of the areas marked in
the diagram, answer the following questions.
a. With the elimination of the tariff what is the gain/loss in consumer surplus?
b. With the elimination of the tariff what is the gain/loss in producer surplus?
c. With the elimination of the tariff what is the gain/loss to the government?
d. With the elimination of the tariff what is the gain/loss to the economy as a whole?
Solution 6
Question 7
7. As the United States has opened up to trade, it has lost many of its low-skill manufacturing
jobs, but it has gained jobs in high-skill industries, such as the software industry. Explain
whether the United States as a whole has been made better off by trade.
Solution 7
Question 8
8. The United States is highly protective of its agricultural (food) industry, imposing import
tariffs, and sometimes quotas, on imports of agricultural goods. This section presented three
arguments for trade protection. For each argument, discuss whether it is a valid justification
for trade protection of U.S. agricultural products.
Solution 8
Question 9
9. In World Trade Organization (WTO) negotiations, if a country agrees to reduce trade barriers
(tariffs or quotas), it usually refers to this as a concession to other countries. Do you think
that this terminology is appropriate?
Solution 9
Question 10
10. Producers in import-competing industries often make the following argument: “Other
countries have an advantage in production of certain goods purely because workers abroad
are paid lower wages. In fact, American workers are much more productive than foreign
workers. So import-competing industries need to be protected.” Is this a valid argument?
Explain your answer.
Solution 10
Question 11
WORK IT OUT Interactive step-by-step help with solving this problem can be found
online.

11. Assume Saudi Arabia and the United States face the production possibilities for oil and cars
shown in the accompanying table.
Saudi
Arabia
United States
Quantity
of oil
(millions
of barrels)
Quantity of
cars
(millions)
Quantity of oil
(millions of
barrels)
Quantity of cars
(millions)
0
4
0
10.0
200
3
100
7.5
400
2
200
5.0
600
1
300
2.5
800
0
400
0
a. What is the opportunity cost of producing a car in Saudi Arabia? In the United States?
What is the opportunity cost of producing a barrel of oil in Saudi Arabia? In the United
States?
b. Which country has the comparative advantage in producing oil? In producing cars?
c. Suppose that in autarky, Saudi Arabia produces 200 million barrels of oil and 3 million
cars; and suppose that the United States produces 300 million barrels of oil and 2.5 million
cars. Without trade, can Saudi Arabia produce more oil and more cars? Without trade, can
the United States produce more oil and more cars?
Suppose now that each country specializes in the good in which it has the comparative
advantage, and the two countries trade. Also assume that for each country the value of
imports must equal the value of exports.
d. What is the total quantity of oil produced? What is the total quantity of cars produced?
e. Is it possible for Saudi Arabia to consume 400 million barrels of oil and 5 million cars and
for the United States to consume 400 million barrels of oil and 5 million cars?
f. Suppose that, in fact, Saudi Arabia consumes 300 million barrels of oil and 4 million cars
and the United States consumes 500 million barrels of oil and 6 million cars. How many
barrels of oil does the United States import? How many cars does the United States
export? Suppose a car costs $10,000 on the world market. How much, then, does a barrel
of oil cost on the world market?
Solution 11