Question 12
12. The accompanying table shows hypothetical demand and supply schedules for milk per year.
The U.S. government decides that the incomes of dairy farmers should be maintained at a
level that allows the traditional family dairy farm to survive. So it implements a price floor of
$1 per pint by buying surplus milk until the market price is $1 per pint.
Price of milk
(per pint)
Quantity of milk
(millions of pints
per year)
Quantity demanded
Quantity supplied
$1.20
550
850
1.10
600
800
1.00
650
750
0.90
700
700
0.80
750
650
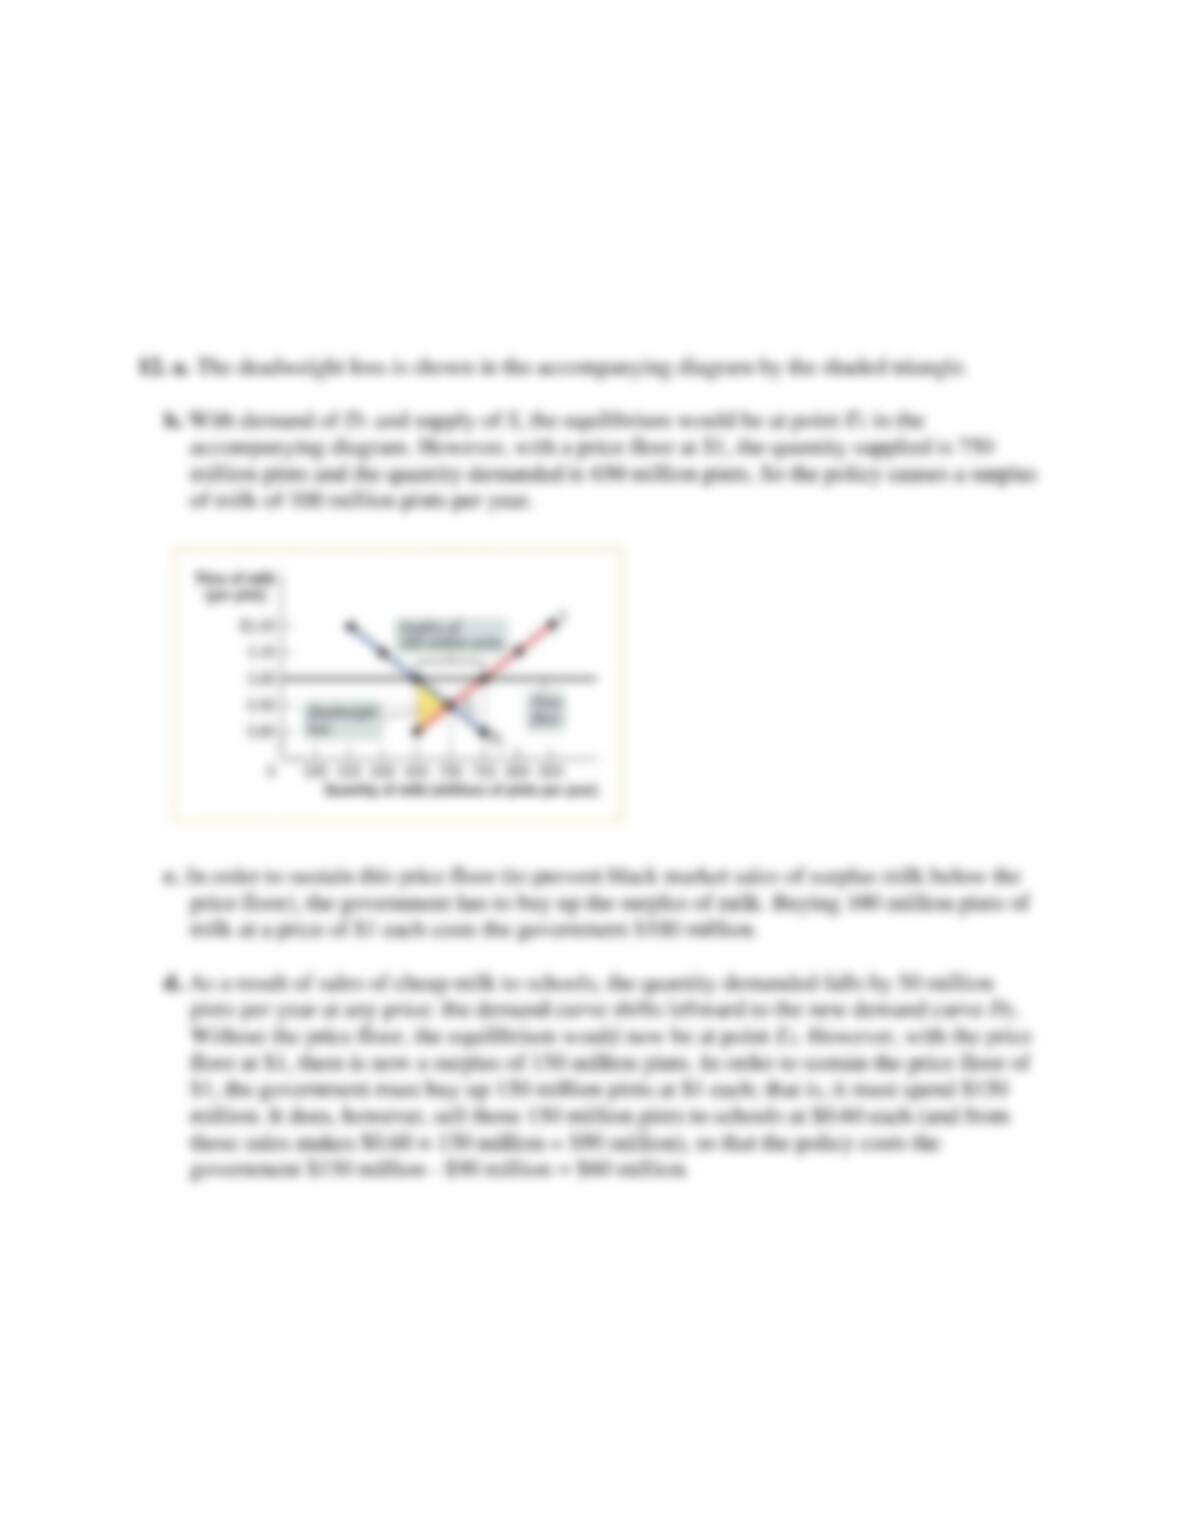
a. In a diagram, show the deadweight loss from the inefficiently low quantity bought and sold.
b. How much surplus milk will be produced as a result of this policy?
c. What will be the cost to the government of this policy?
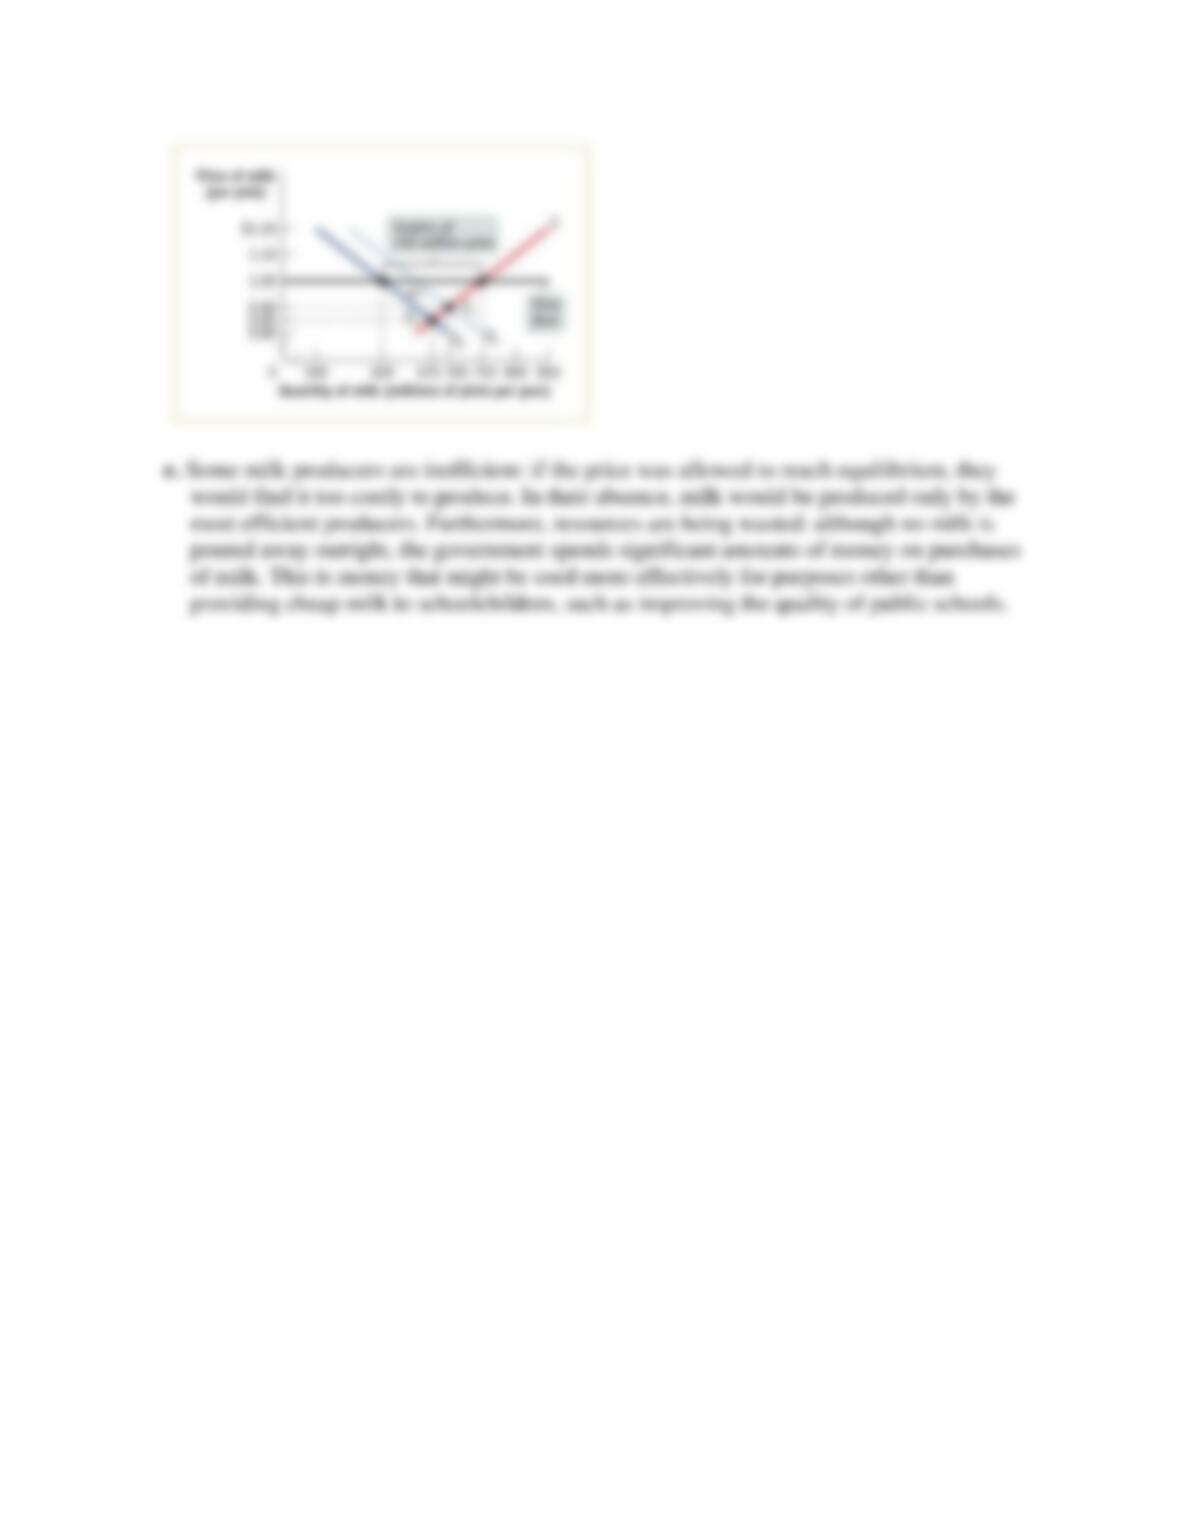
d. Since milk is an important source of protein and calcium, the government decides to
provide the surplus milk it purchases to elementary schools at a price of only $0.60 per
pint. Assume that schools will buy any amount of milk available at this low price. But
parents now reduce their purchases of milk at any price by 50 million pints per year
because they know their children are getting milk at school. How much will the dairy
program now cost the government?
e. Explain how inefficiencies in the form of inefficient allocation to sellers and wasted
resources arise from this policy.
Solution 12
Question 13
13. In many European countries high minimum wages have led to high levels of unemployment
and underemployment, and to a two-tier labor system. In the formal labor market, workers
have good jobs that pay at least the minimum wage. In the informal, or black market for labor,
workers have poor jobs and receive less than the minimum wage.
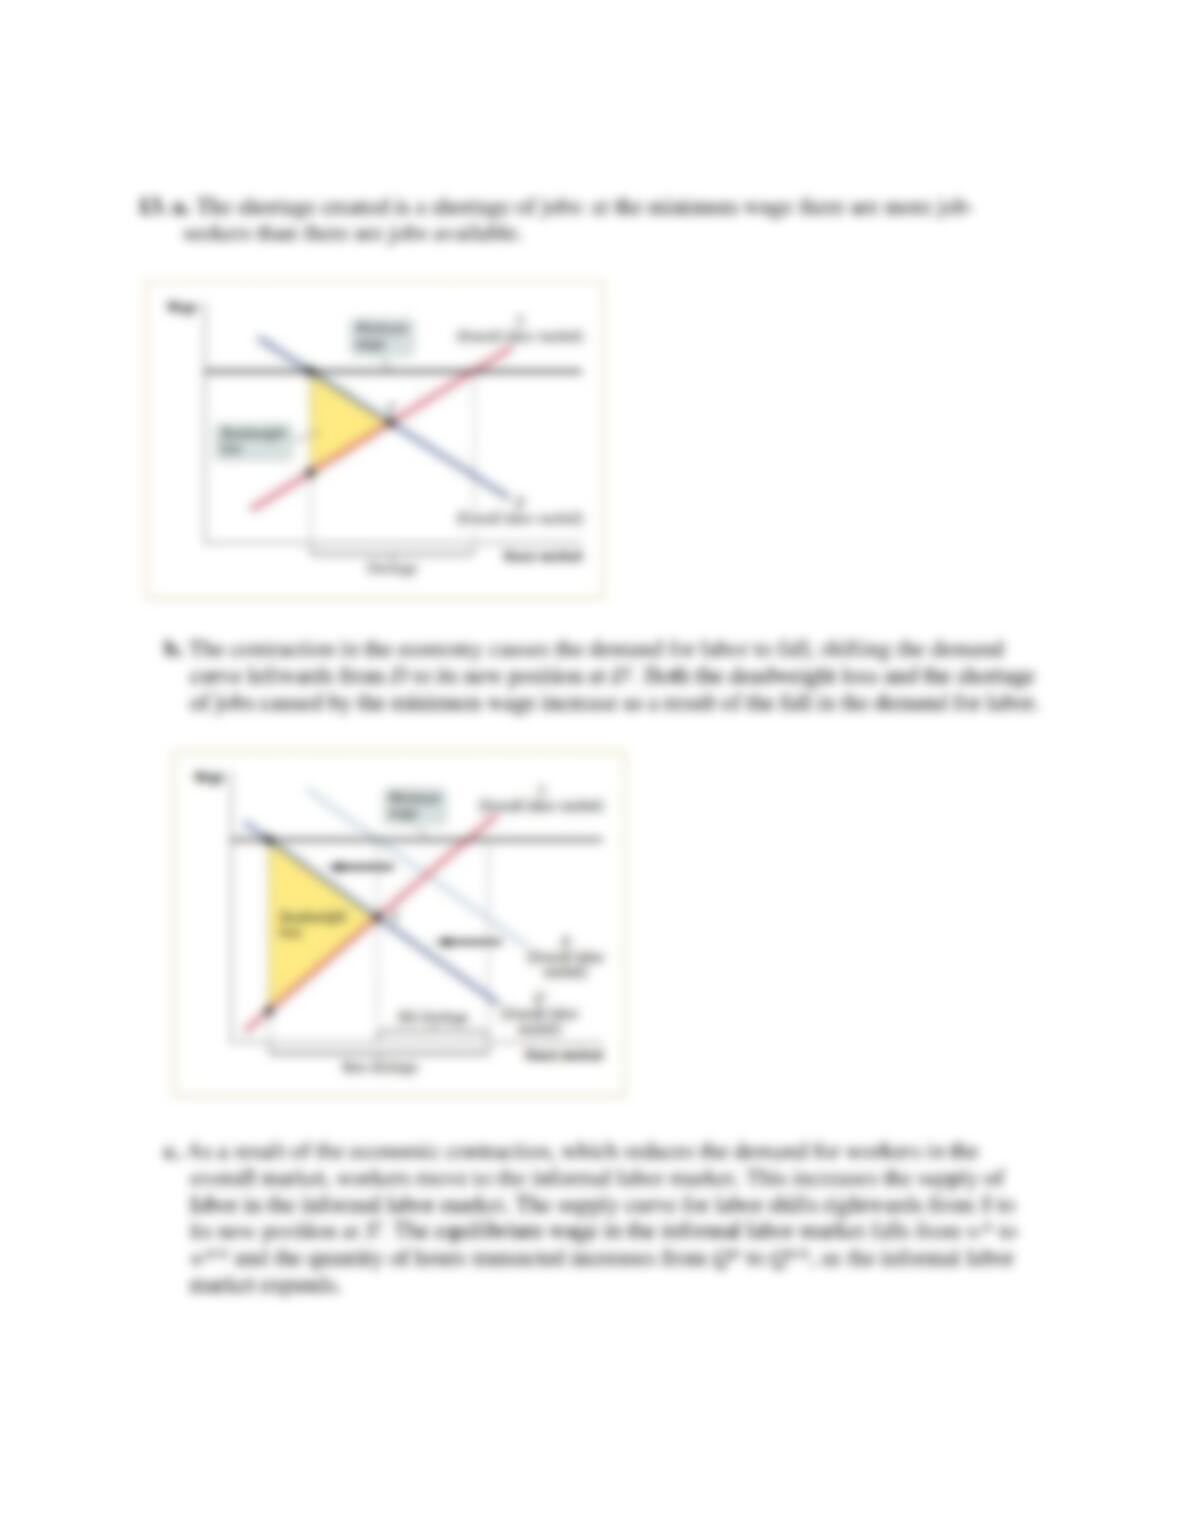
a. Draw a demand and supply diagram showing the effect of the imposition of a minimum
wage on the overall market for labor, with wage on the vertical axis and hours of labor on
the horizontal axis. Your supply curve should represent the hours of labor offered by
workers according to the wage, and the demand curve should represent the hours of labor
demanded by employers according to the wage. On your diagram show the deadweight loss
from the imposition of a minimum wage. What type of shortage is created? Illustrate on
your diagram the size of the shortage.
b. Assume that the imposition of the high minimum wage causes a contraction in the economy
so that employers in the formal sector cut their production and their demand for workers.
Illustrate the effect of this on the overall market for labor. What happens to the size of the
deadweight loss? The shortage? Illustrate with a diagram.
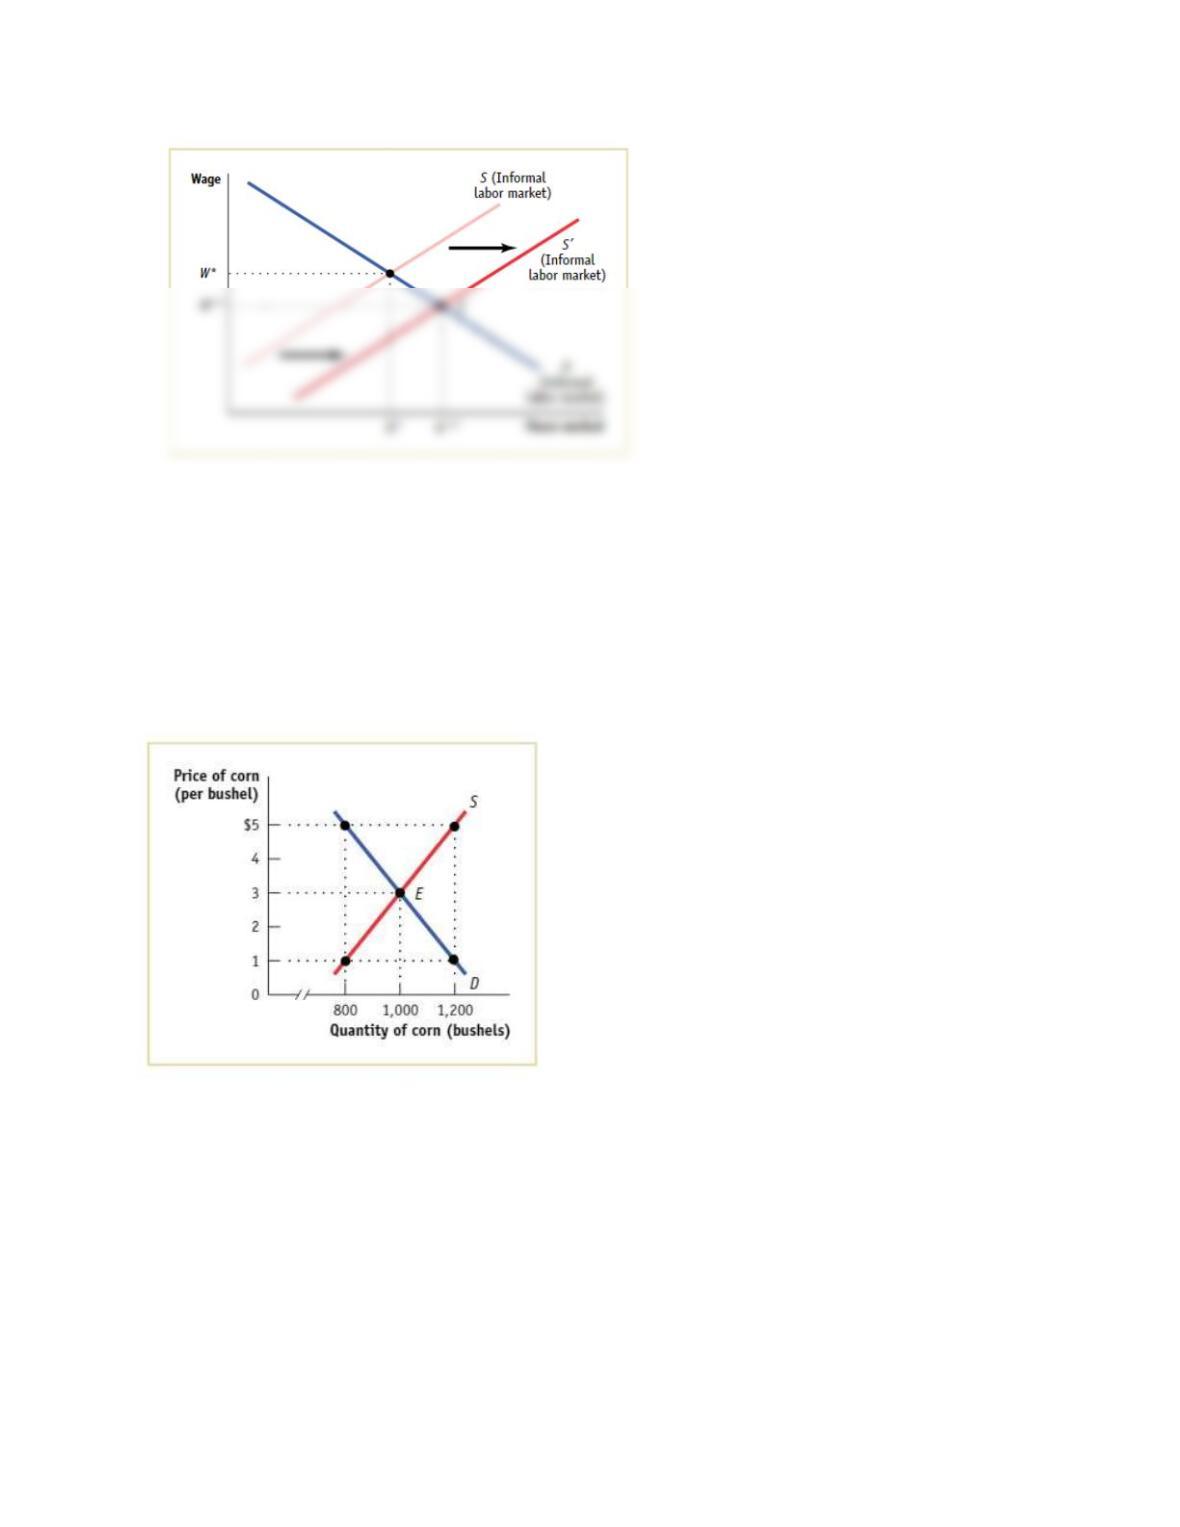
c. Assume that the workers who cannot get a job paying at least the minimum wage move into
the informal labor market where there is no minimum wage. What happens to the size of
the informal market for labor as a result of the economic contraction? What happens to the
equilibrium wage in the informal labor market? Illustrate with a supply and demand
diagram for the informal market.
Solution 13
Question 14
14. For the last 80 years the U.S. government has used price supports to provide income
assistance to American farmers. To implement these price supports, at times the government
has used price floors, which it maintains by buying up the surplus farm products. At other
times, it has used target prices, a policy by which the government gives the farmer an amount
equal to the difference between the market price and the target price for each unit sold.
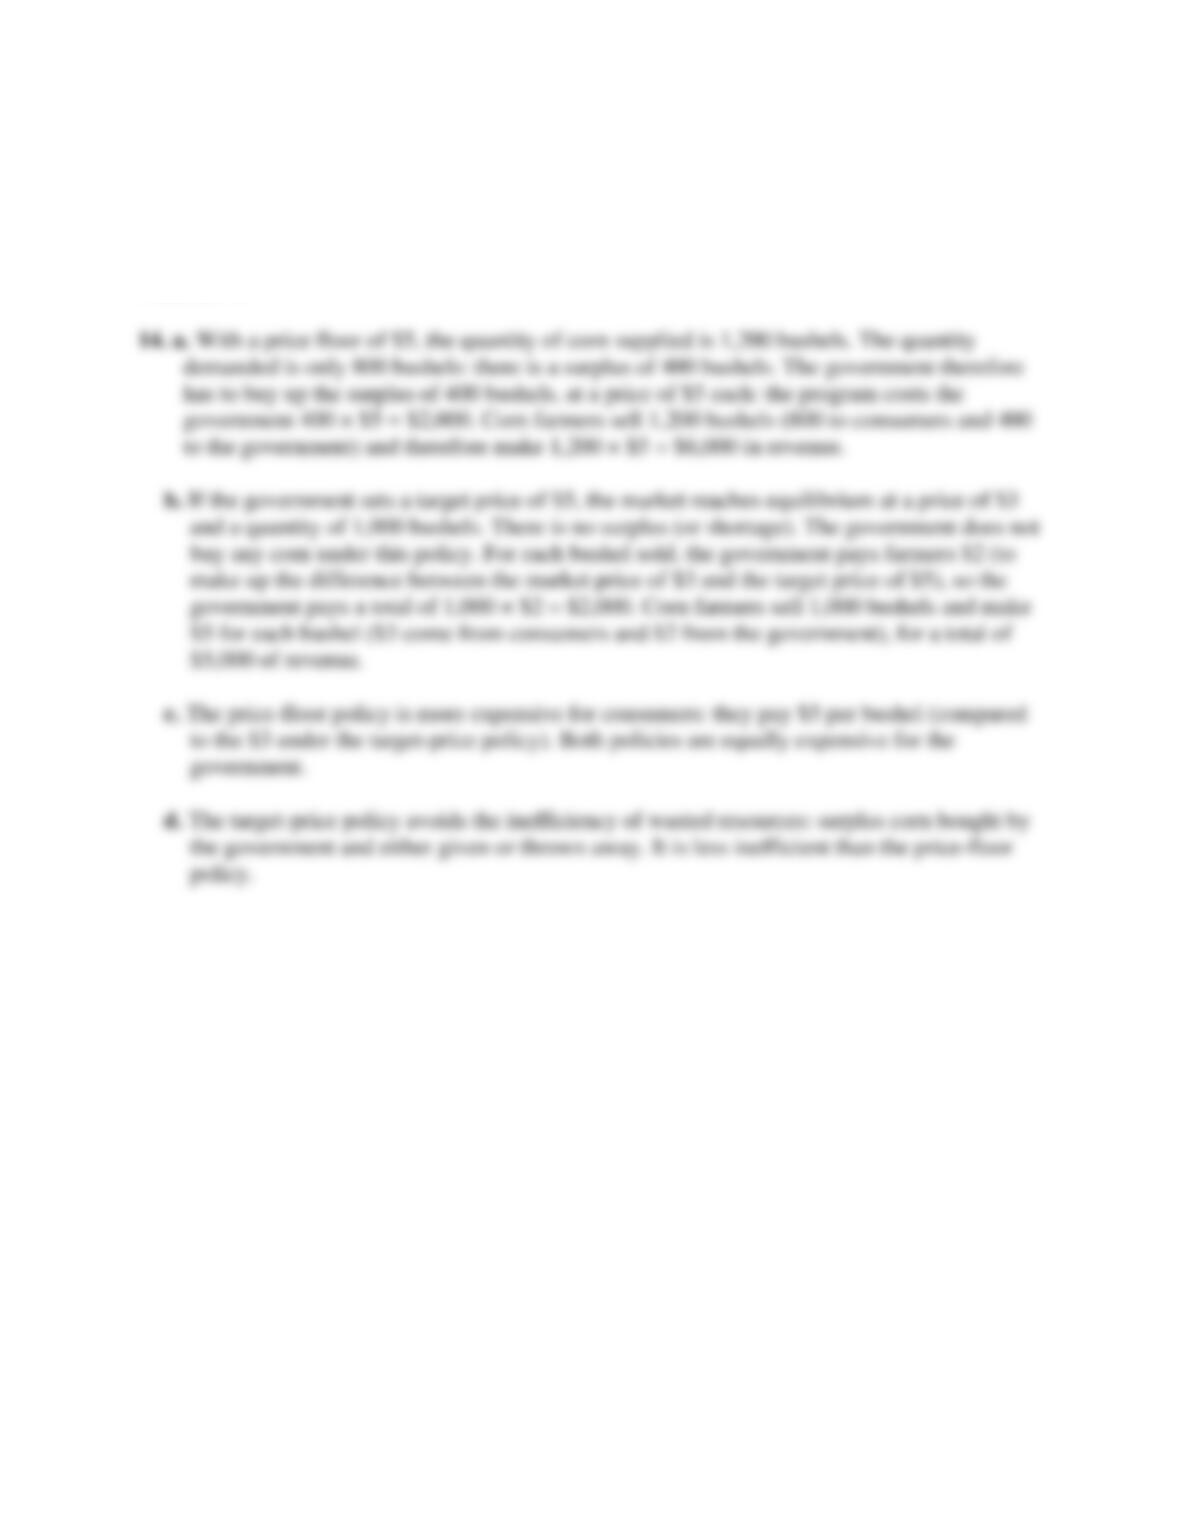
Consider the market for corn depicted in the accompanying diagram.
a. If the government sets a price floor of $5 per bushel, how many bushels of corn are
produced? How many are purchased by consumers? By the government? How much does
the program cost the government? How much revenue do corn farmers receive?
b. Suppose the government sets a target price of $5 per bushel for any quantity supplied up to
1,000 bushels. How many bushels of corn are purchased by consumers and at what price?
By the government? How much does the program cost the government? How much
revenue do corn farmers receive?
c. Which of these programs (in parts a and b) costs corn consumers more? Which program
costs the government more? Explain.
d. Is one of these policies less inefficient than the other? Explain.
Solution 14
Question 15
15. The Venezuelan government has imposed a price ceiling on the retail price of roasted coffee
beans. The accompanying diagram shows the market for coffee beans. In the absence of
price controls, the equilibrium is at point E, with an equilibrium price of PE and an
equilibrium quantity bought and sold of QE.
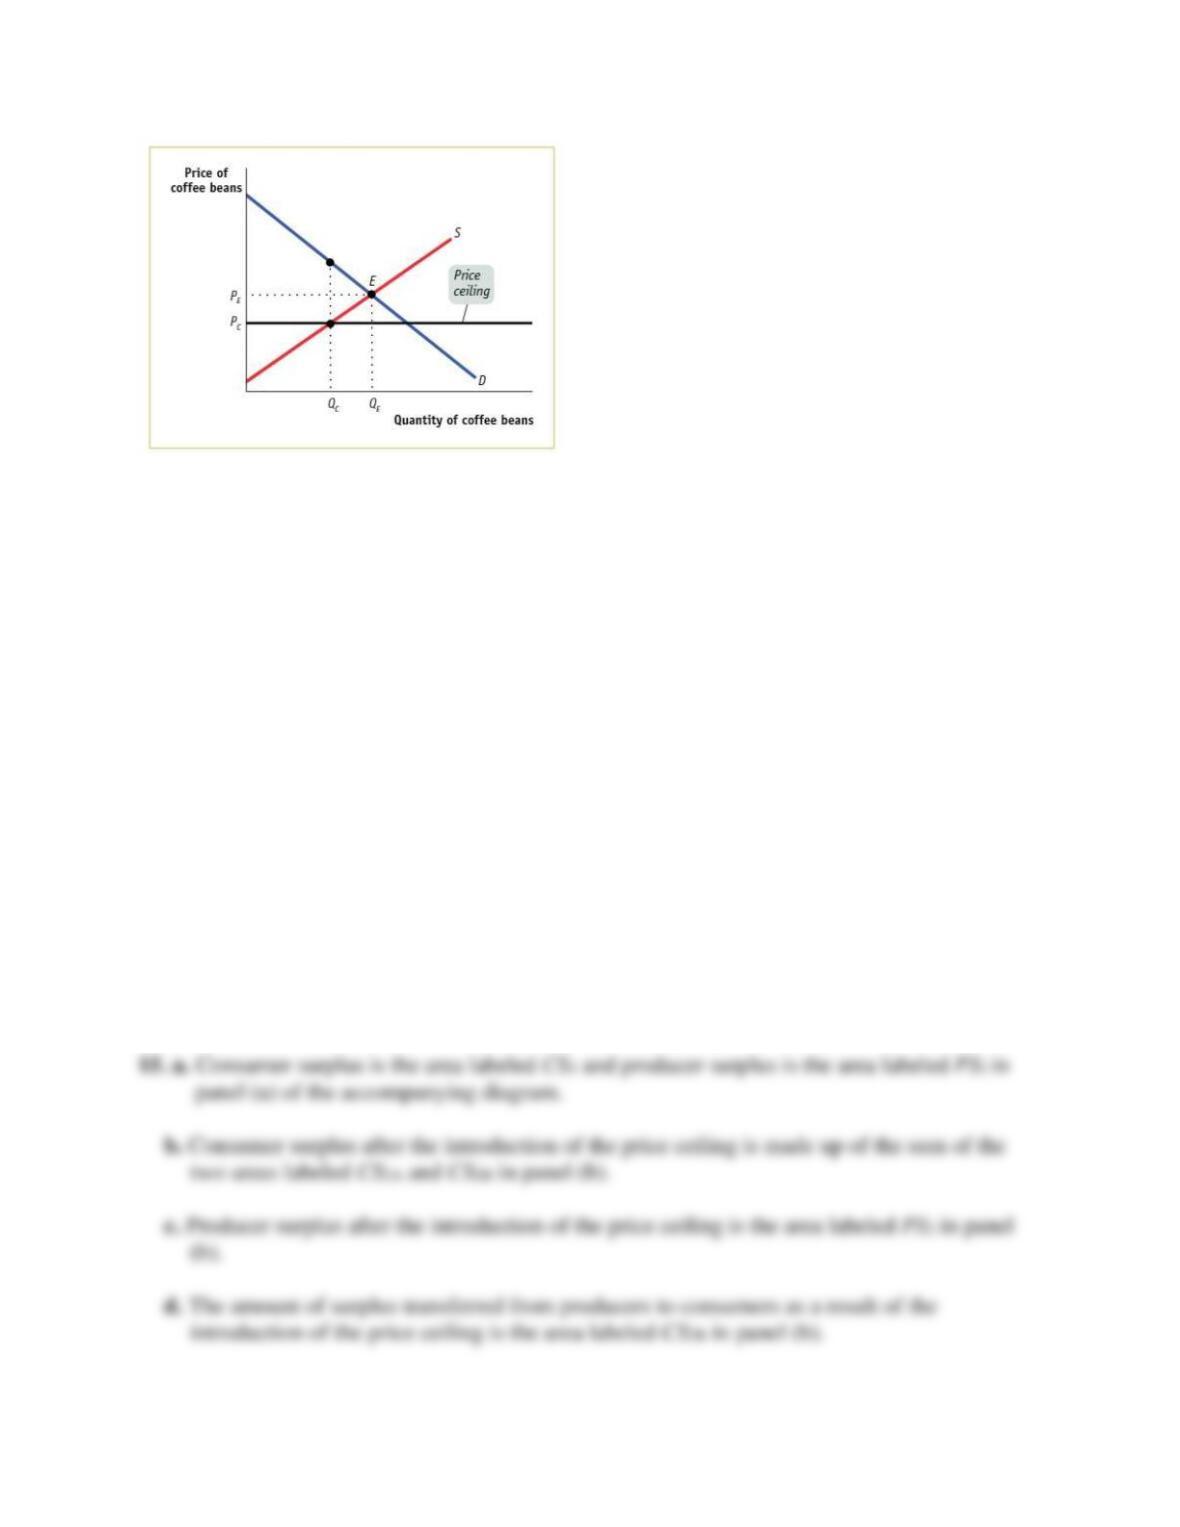
a. Show the consumer and producer surplus before the introduction of the price ceiling.
After the introduction of the price ceiling, the price falls to PC and the quantity bought and
sold falls to QC.
b. Show the consumer surplus after the introduction of the price ceiling (assuming that the
consumers with the highest willingness to pay get to buy the available coffee beans; that is,
assuming that there is no inefficient allocation to consumers).
c. Show the producer surplus after the introduction of the price ceiling (assuming that the
producers with the lowest cost get to sell their coffee beans; that is, assuming that there is
no inefficient allocation of sales among producers).
d. Using the diagram, show how much of what was producer surplus before the introduction
of the price ceiling has been transferred to consumers as a result of the price ceiling.
e. Using the diagram, show how much of what was total surplus before the introduction of the
price ceiling has been lost. That is, how great is the deadweight loss?
Solution 15
Question 16
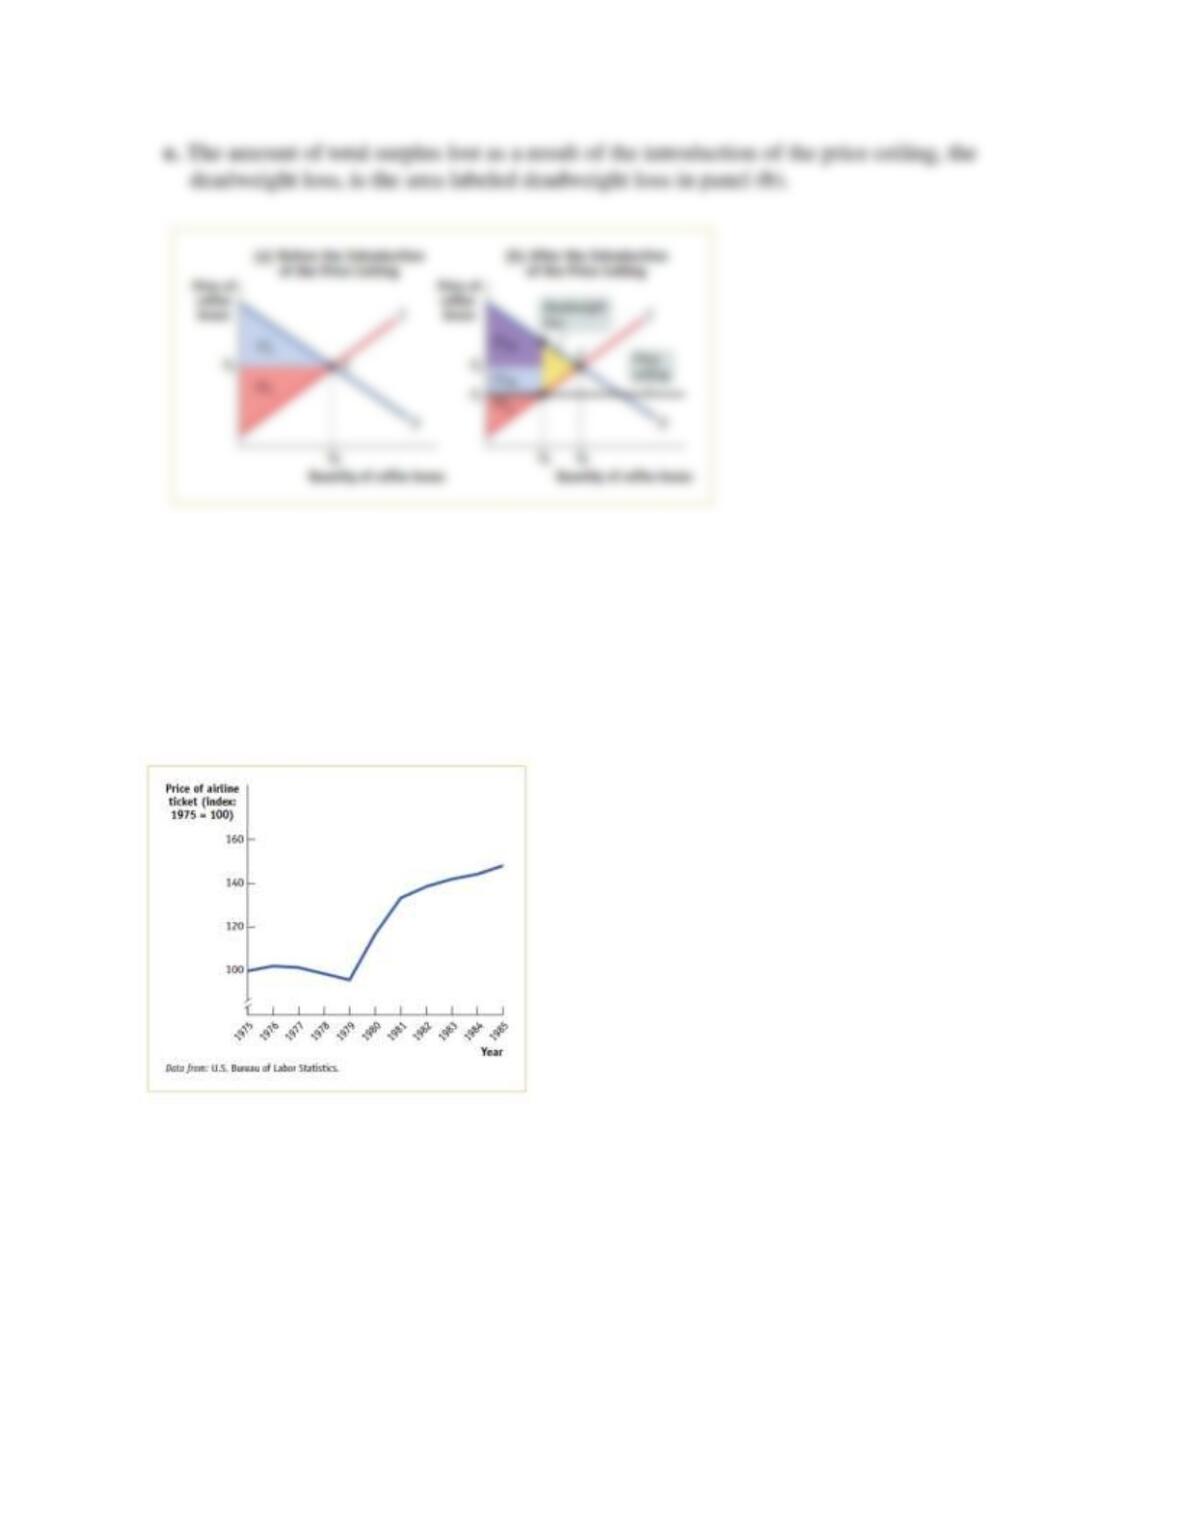
16. The accompanying diagram shows data from the U.S. Bureau of Labor Statistics on the
average price of an airline ticket in the United States from 1975 until 1985, adjusted to
eliminate the effect of inflation (the general increase in the prices of all goods over time). In
1978, the United States Airline Deregulation Act removed the price floor on airline fares,
and it also allowed the airlines greater flexibility to offer new routes.
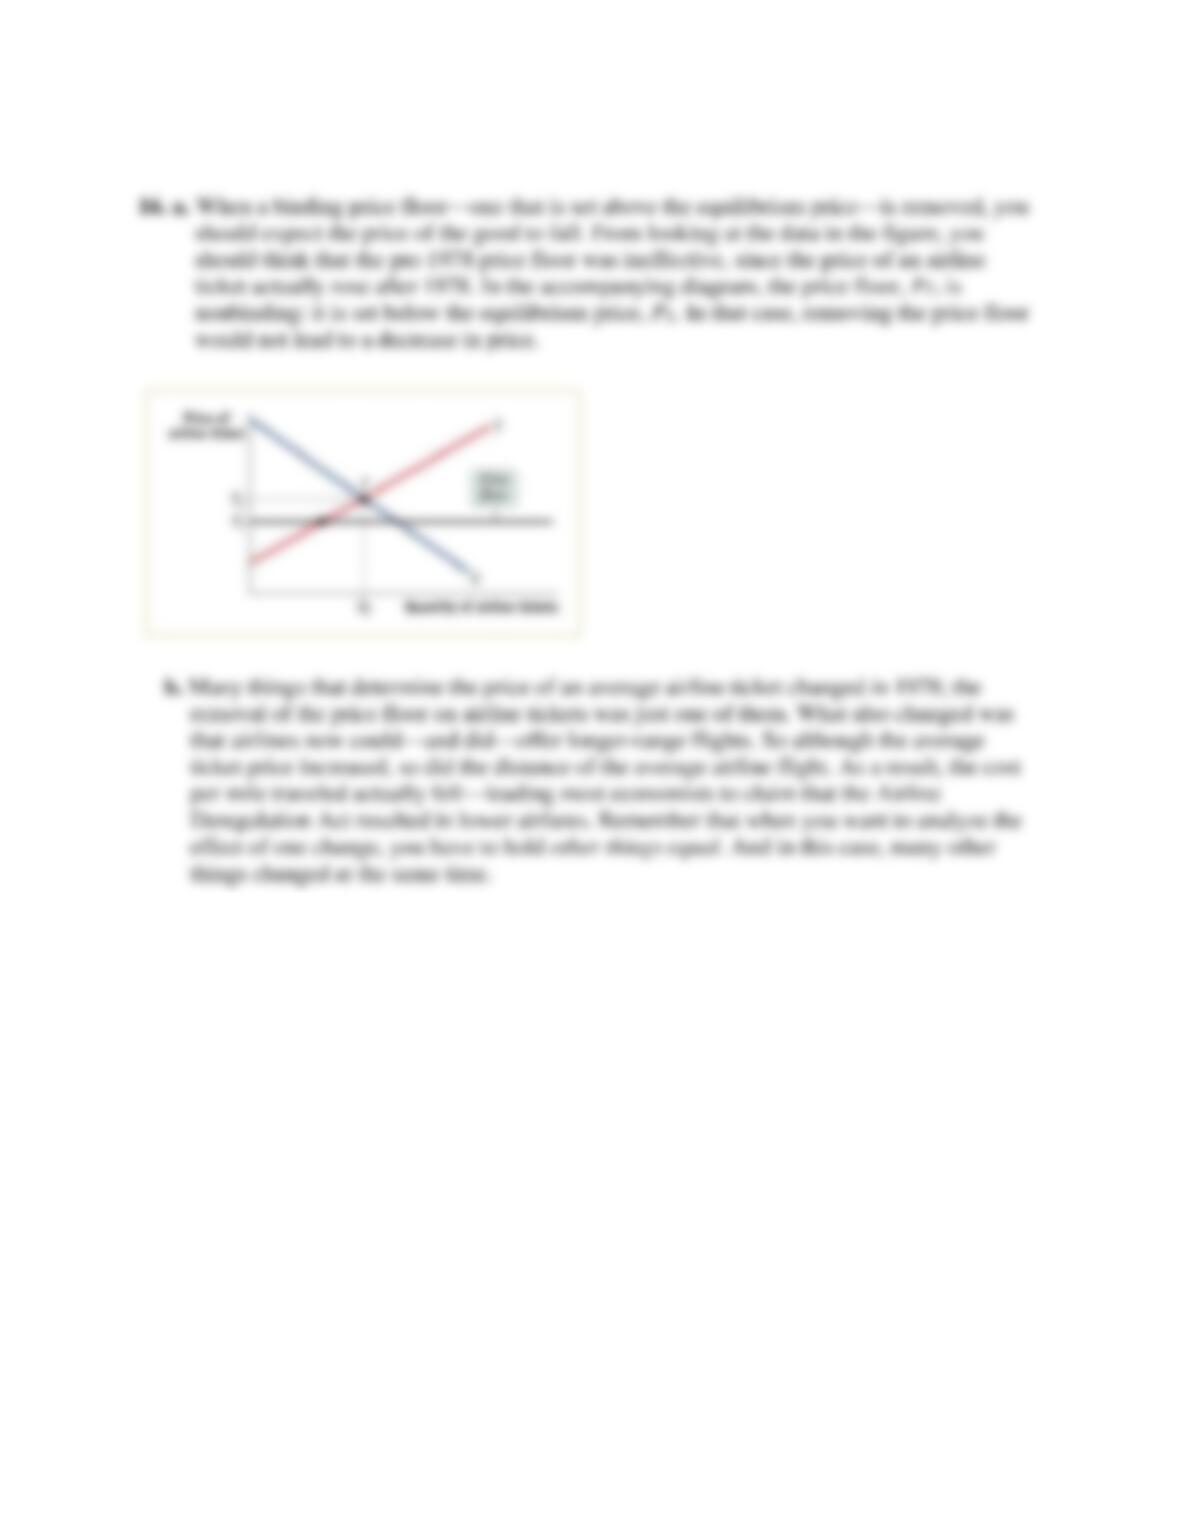
a. Looking at the data on airline ticket prices in the diagram, do you think the price floor that
existed before 1978 was binding or nonbinding? That is, do you think it was set above or
below the equilibrium price? Draw a supply and demand diagram, showing where the price
floor that existed before 1978 was in relation to the equilibrium price.
b. Most economists agree that the average airline ticket price per mile traveled actually fell as
a result of the Airline Deregulation Act. How might you reconcile that view with what you
see in the diagram?
Solution 16
Question 17
17. Many college students attempt to land internships before graduation to burnish their resumes,
gain experience in a chosen field, or try out possible careers. The hope shared by all of these
prospective interns is that they will find internships that pay more than typical summer jobs,
such as waiting tables or flipping burgers.
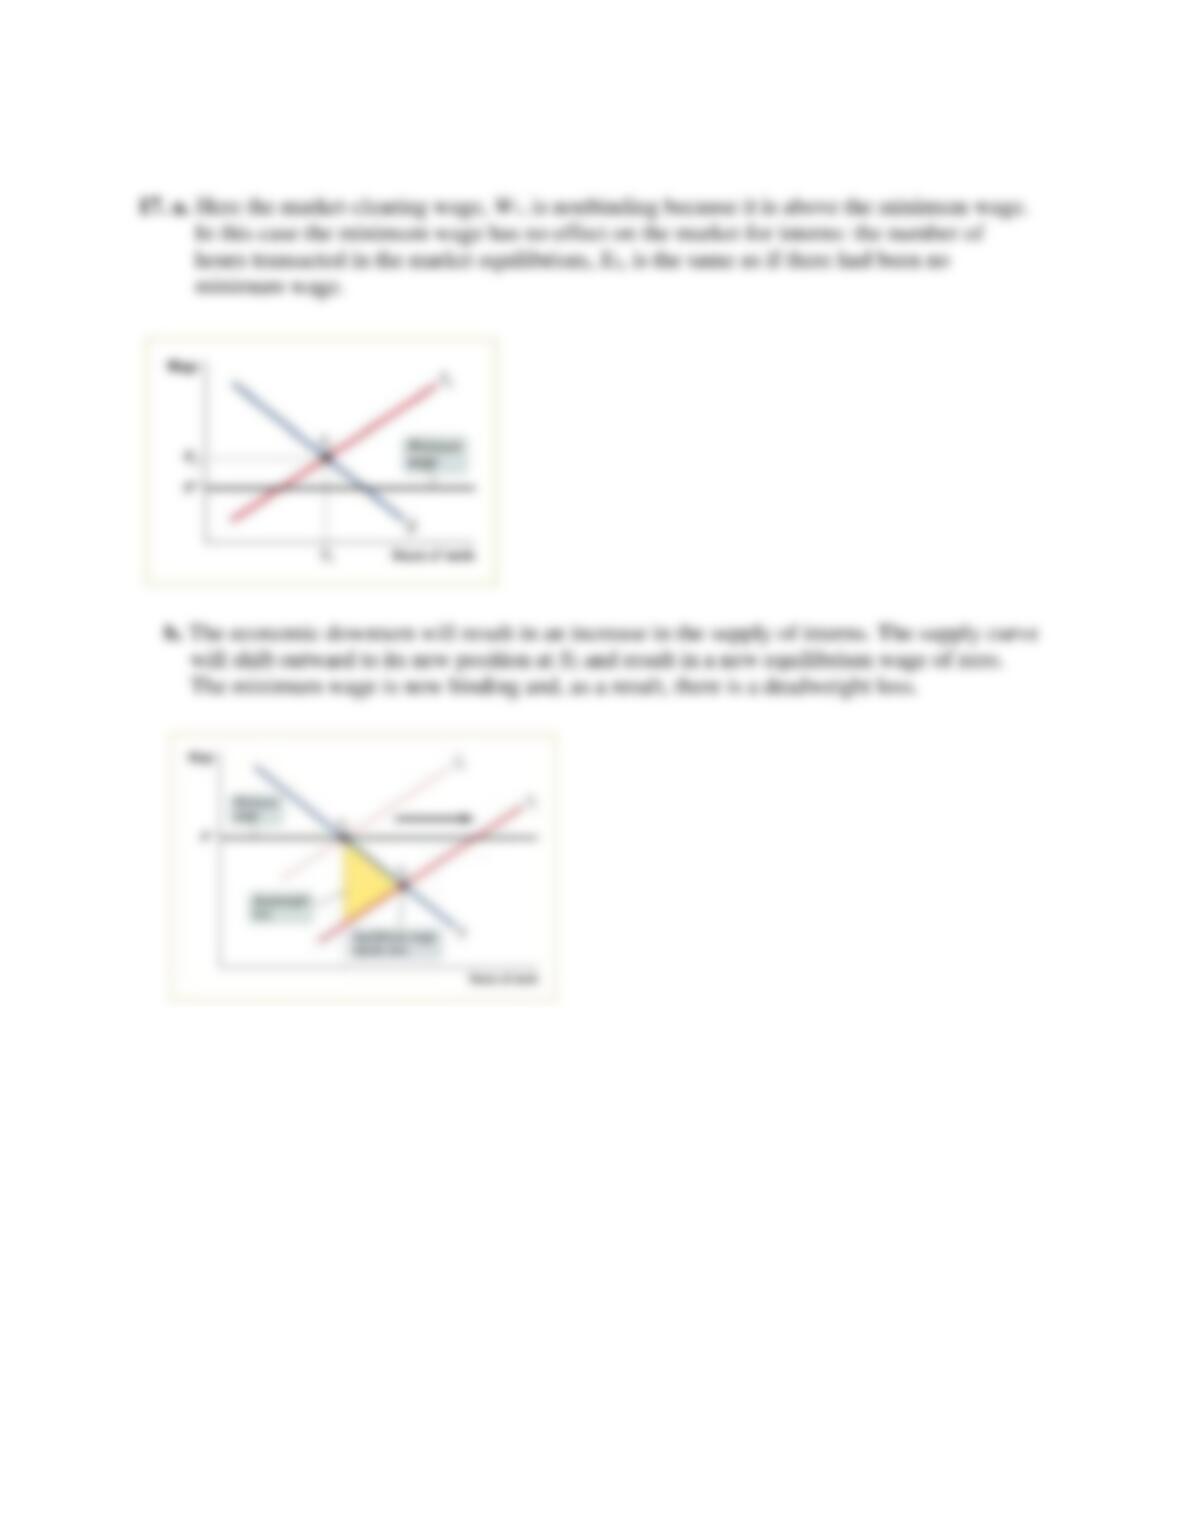
a. With wage measured on the vertical axis and number of hours of work on the horizontal
axis, draw a supply and demand diagram for the market for interns in which the minimum
wage is nonbinding at the market equilibrium.
b. Assume that a market downturn reduces the demand for interns by employers. However,
many students are willing and eager to work in unpaid internships. As a result, the new
market equilibrium wage is equal to zero. Draw another supply and demand diagram to
illustrate this new market equilibrium. As in Figure 5-7, include a shaded triangle that
represents the deadweight loss from the minimum wage. Using the diagram, explain your
findings.
Solution 17
Question 18
WORK IT OUT Interactive step-by-step help with solving this problem can be found
online.
18. The accompanying diagram shows the demand and supply curves for taxi rides in New York
City.
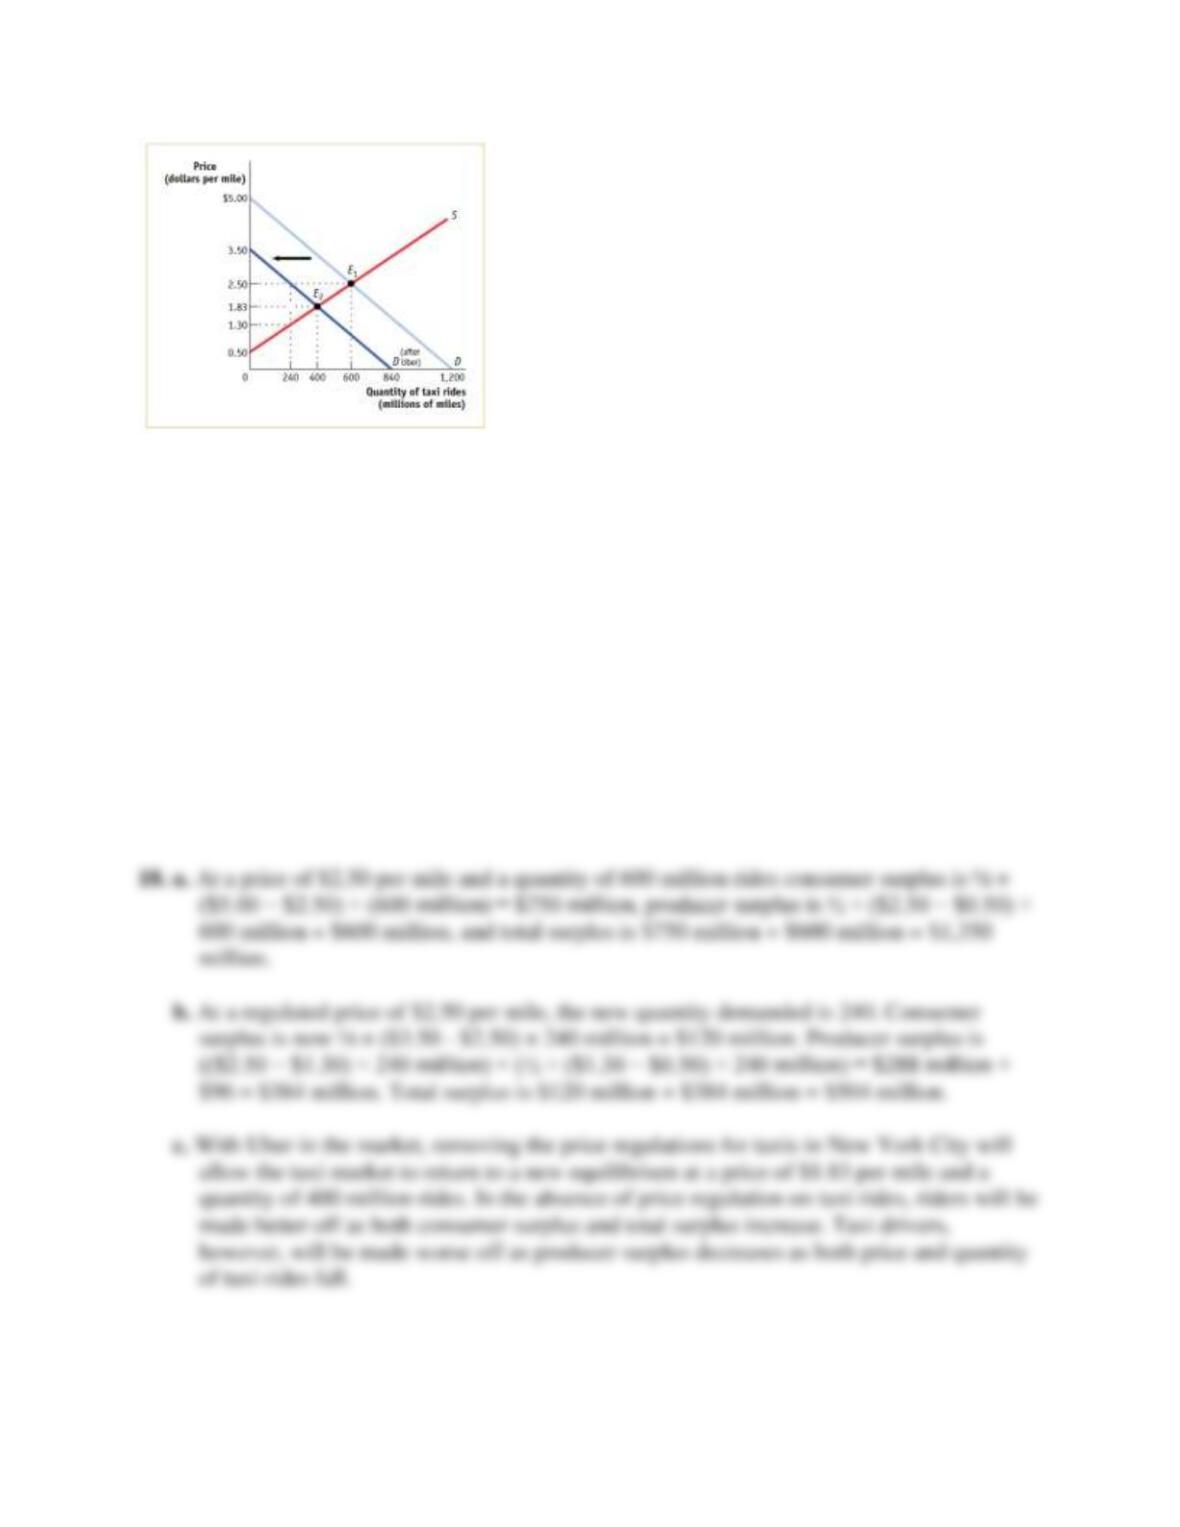
a. At E1 the market is at equilibrium with 600 million miles of rides transacted at an
equilibrium price of $2.50. Calculate consumer surplus, producer surplus, and total surplus
at E1.
b. Uber’s entry into the market reduces the quantity of rides demanded from taxis by 30% at
every price, shifting the demand curve leftward. Assume that New York City politicians
respond by imposing a regulated price of $2.50 per mile. Calculate consumer surplus,
producer surplus, and total surplus for the taxi market after Uber has entered the market.
c. After complaints from riders, New York removes the regulated price of $2.50 per mile.
What happens to the equilibrium price and quantity? How will taxi drivers and riders be
affected?
Solution 18
Question 19
19. Suppose it is decided that rent control in New York City will be abolished and that market
rents will now prevail. Assume that all rental units are identical and so are offered at the
same rent. To address the plight of residents who may be unable to pay the market rent, an
income supplement will be paid to all low-income households equal to the difference
between the old controlled rent and the new market rent.
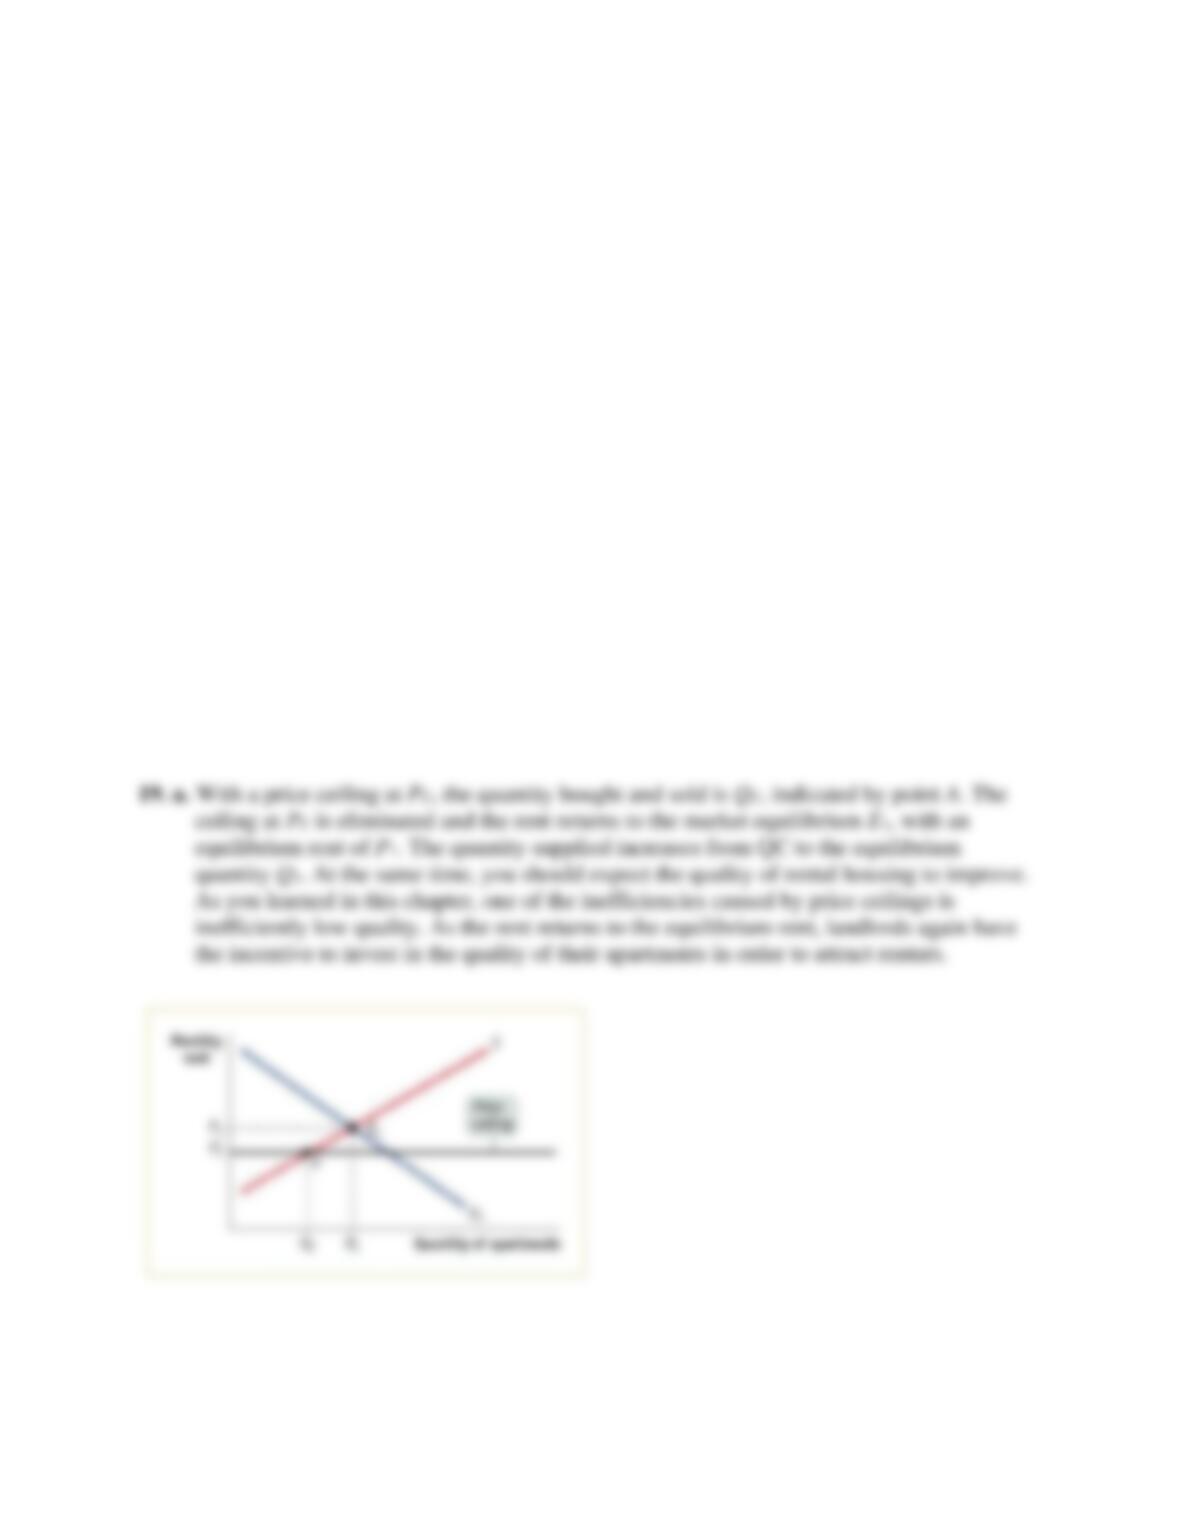
a. Use a diagram to show the effect on the rental market of the elimination of rent control.
What will happen to the quality and quantity of rental housing supplied?
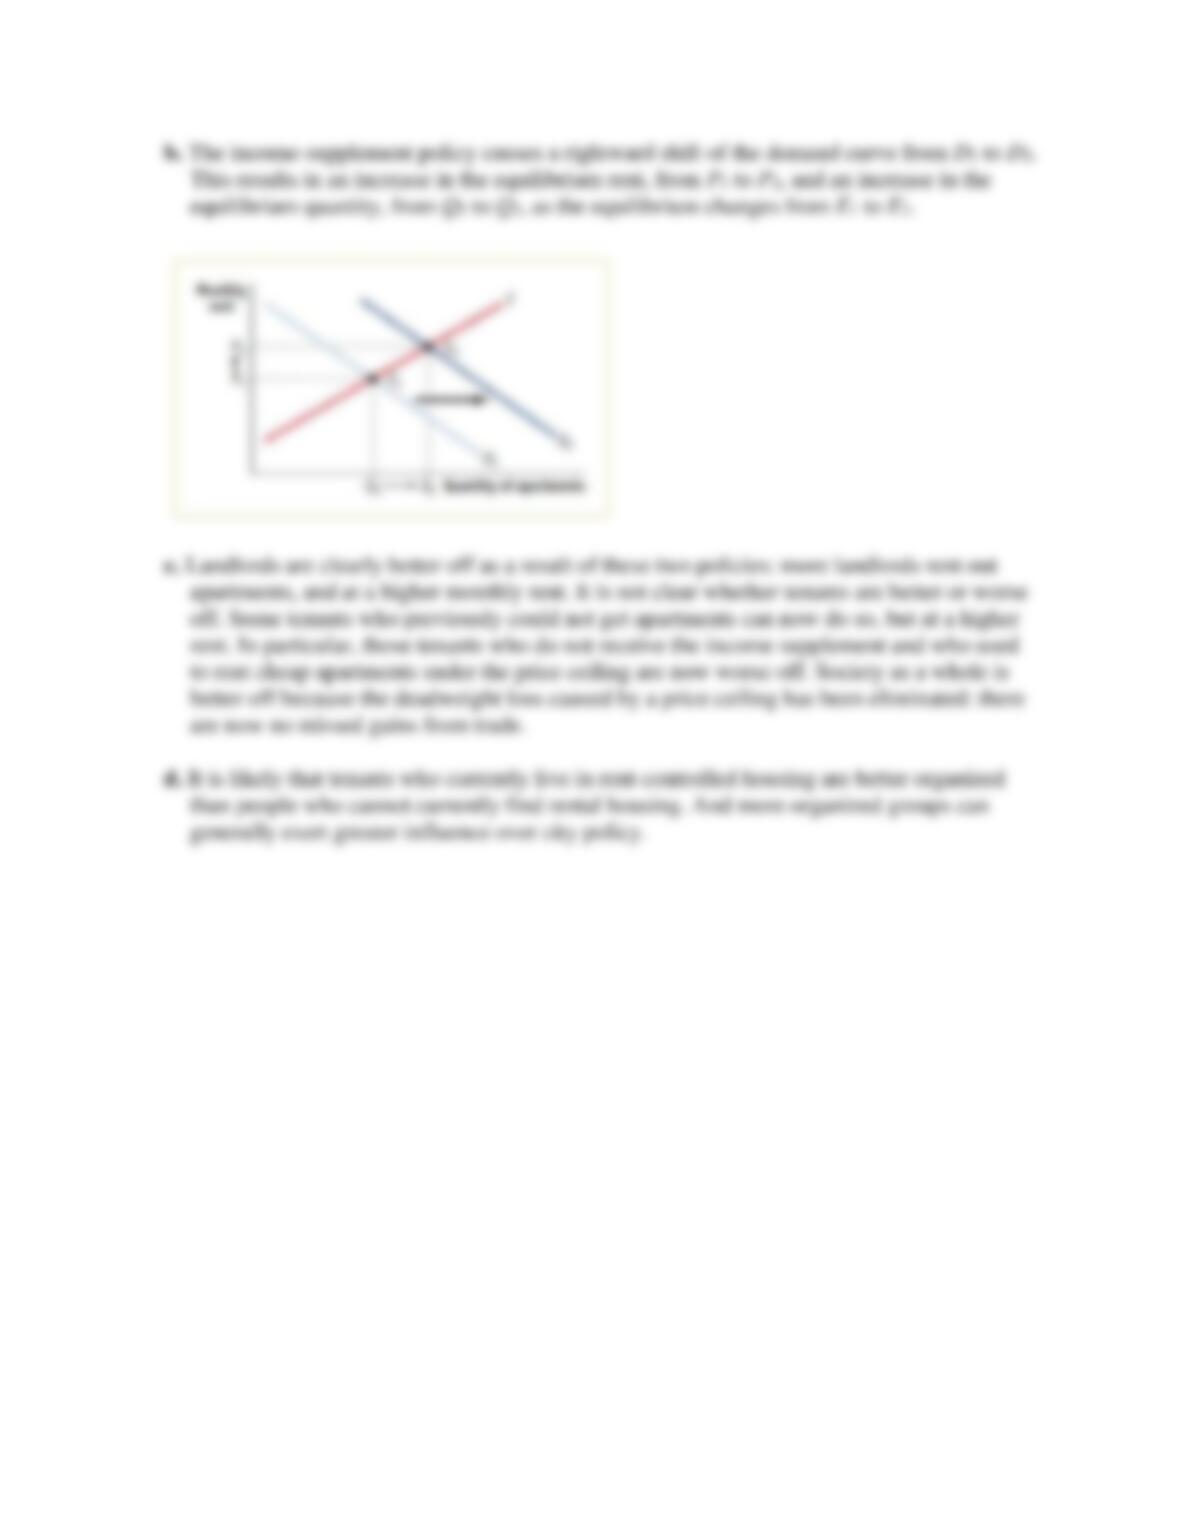
b. Use a second diagram to show the additional effect of the income-supplement policy on the
market. What effect does it have on the market rent and quantity of rental housing supplied
in comparison to your answers to part a?
c. Are tenants better or worse off as a result of these policies? Are landlords better or worse
off? Is society as a whole better or worse off?
d. From a political standpoint, why do you think cities have been more likely to resort to rent
control rather than a policy of income supplements to help low-income people pay for
housing?
Solution 19