Section 2: Demand, Supply, and Equilibrium
Question 1
1. A study conducted by Yahoo! revealed that chocolate is the most popular flavor of ice cream
in America. For each of the following, indicate the possible effects on demand, supply, or both
as well as equilibrium price and quantity of chocolate ice cream.
a. A severe drought in the Midwest causes dairy farmers to reduce the number of milk-
producing cattle in their herds by a third. These dairy farmers supply cream that is used to
manufacture chocolate ice cream.
b. A new report by the American Medical Association reveals that chocolate does, in fact,
have significant health benefits.
c. The discovery of cheaper synthetic vanilla flavoring lowers the price of vanilla ice cream.
d. New technology for mixing and freezing ice cream lowers manufacturers’ costs of
producing chocolate ice cream.
Solution 1
1. a. By reducing their herds, dairy farmers reduce the supply of cream, a leftward shift of the
Question 2
2. In a supply and demand diagram, draw the shift of the demand curve for hamburgers in your
hometown due to the following events. In each case, show the effect on equilibrium price and
quantity.
a. The price of tacos increases.
b. All hamburger sellers raise the price of their french fries.
c. Income falls in town. Assume that hamburgers are a normal good for most people.
d. Income falls in town. Assume that hamburgers are an inferior good for most people.
e. Hot dog stands cut the price of hot dogs.
Solution 2
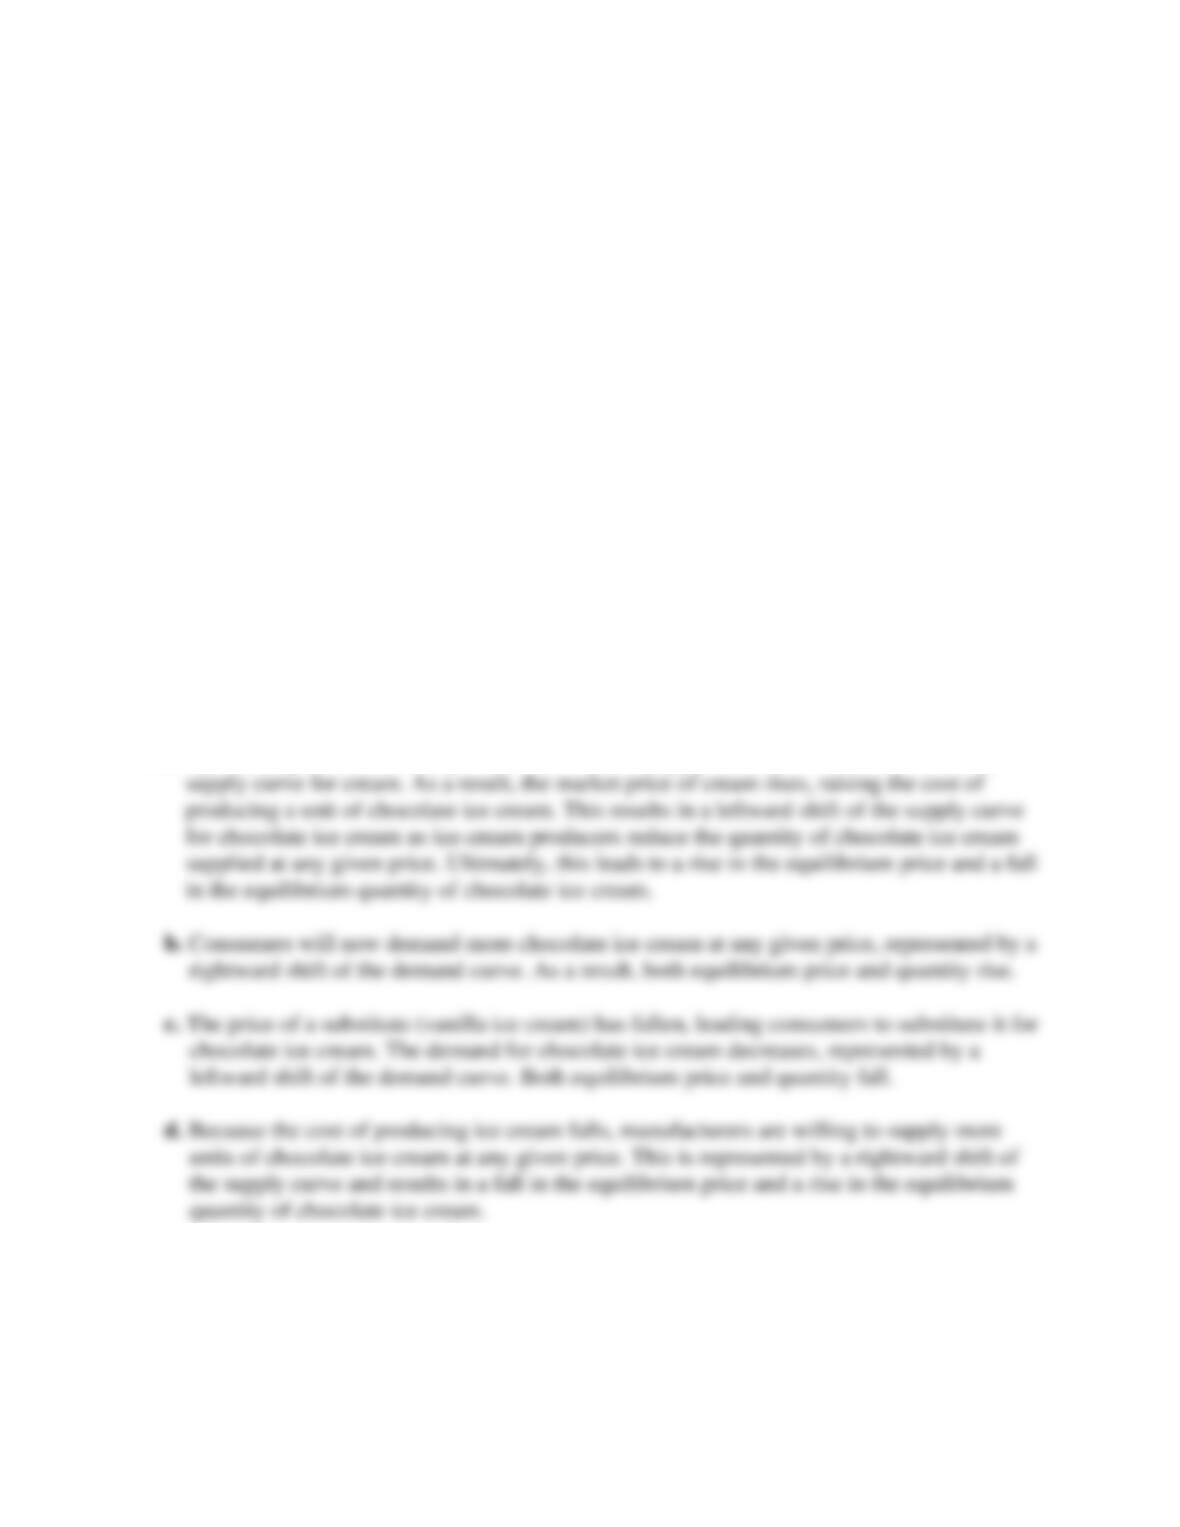
2. a. A rise in the price of a substitute (tacos) causes the demand for hamburgers to increase. This
represents a rightward shift of the demand curve from D1 to D2 and results in a rise in the
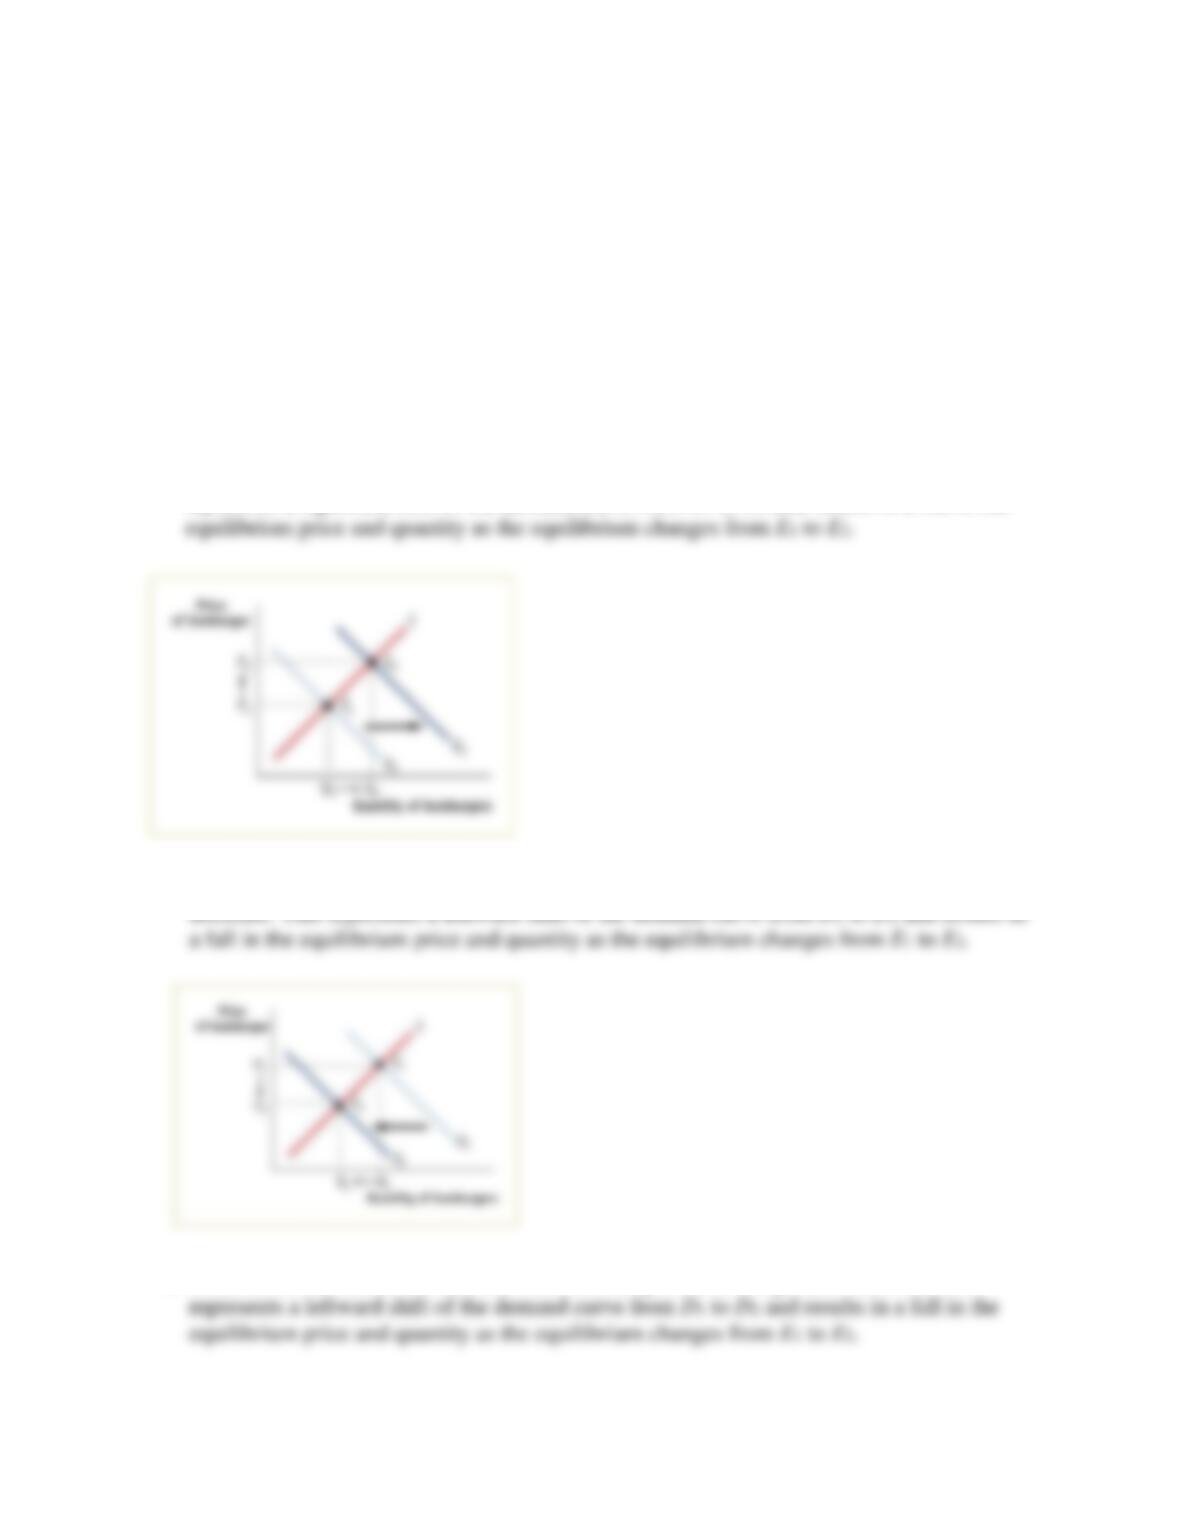
b. A rise in the price of a complement (french fries) causes the demand for hamburgers to
c. A fall in income causes the demand for a normal good (hamburgers) to decrease. This
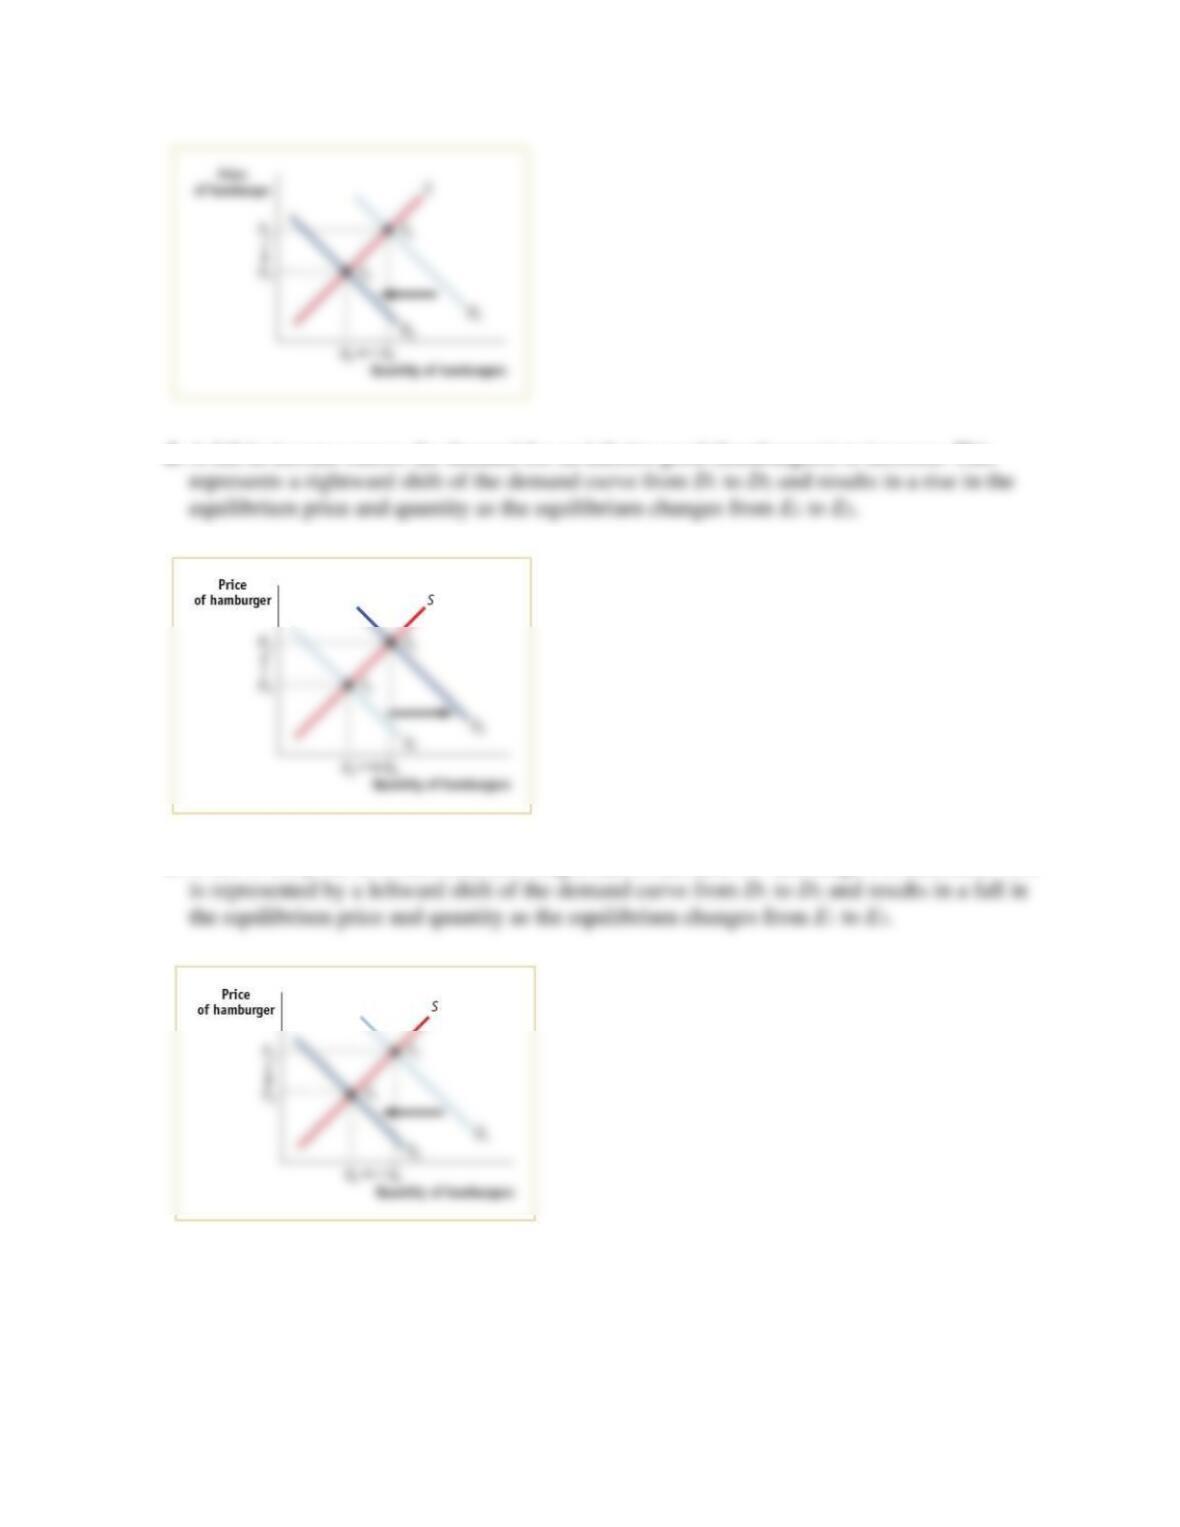
d. A fall in income causes the demand for an inferior good (hamburgers) to increase. This
e. A fall in the price of a substitute (hot dogs) causes demand for hamburgers to decrease. This
Question 3
3. The market for many goods changes in predictable ways according to the time of year, in
response to events such as holidays, vacation times, seasonal changes in production, and so
on. Using supply and demand, explain the change in price in each of the following cases. Note
that supply and demand may shift simultaneously.
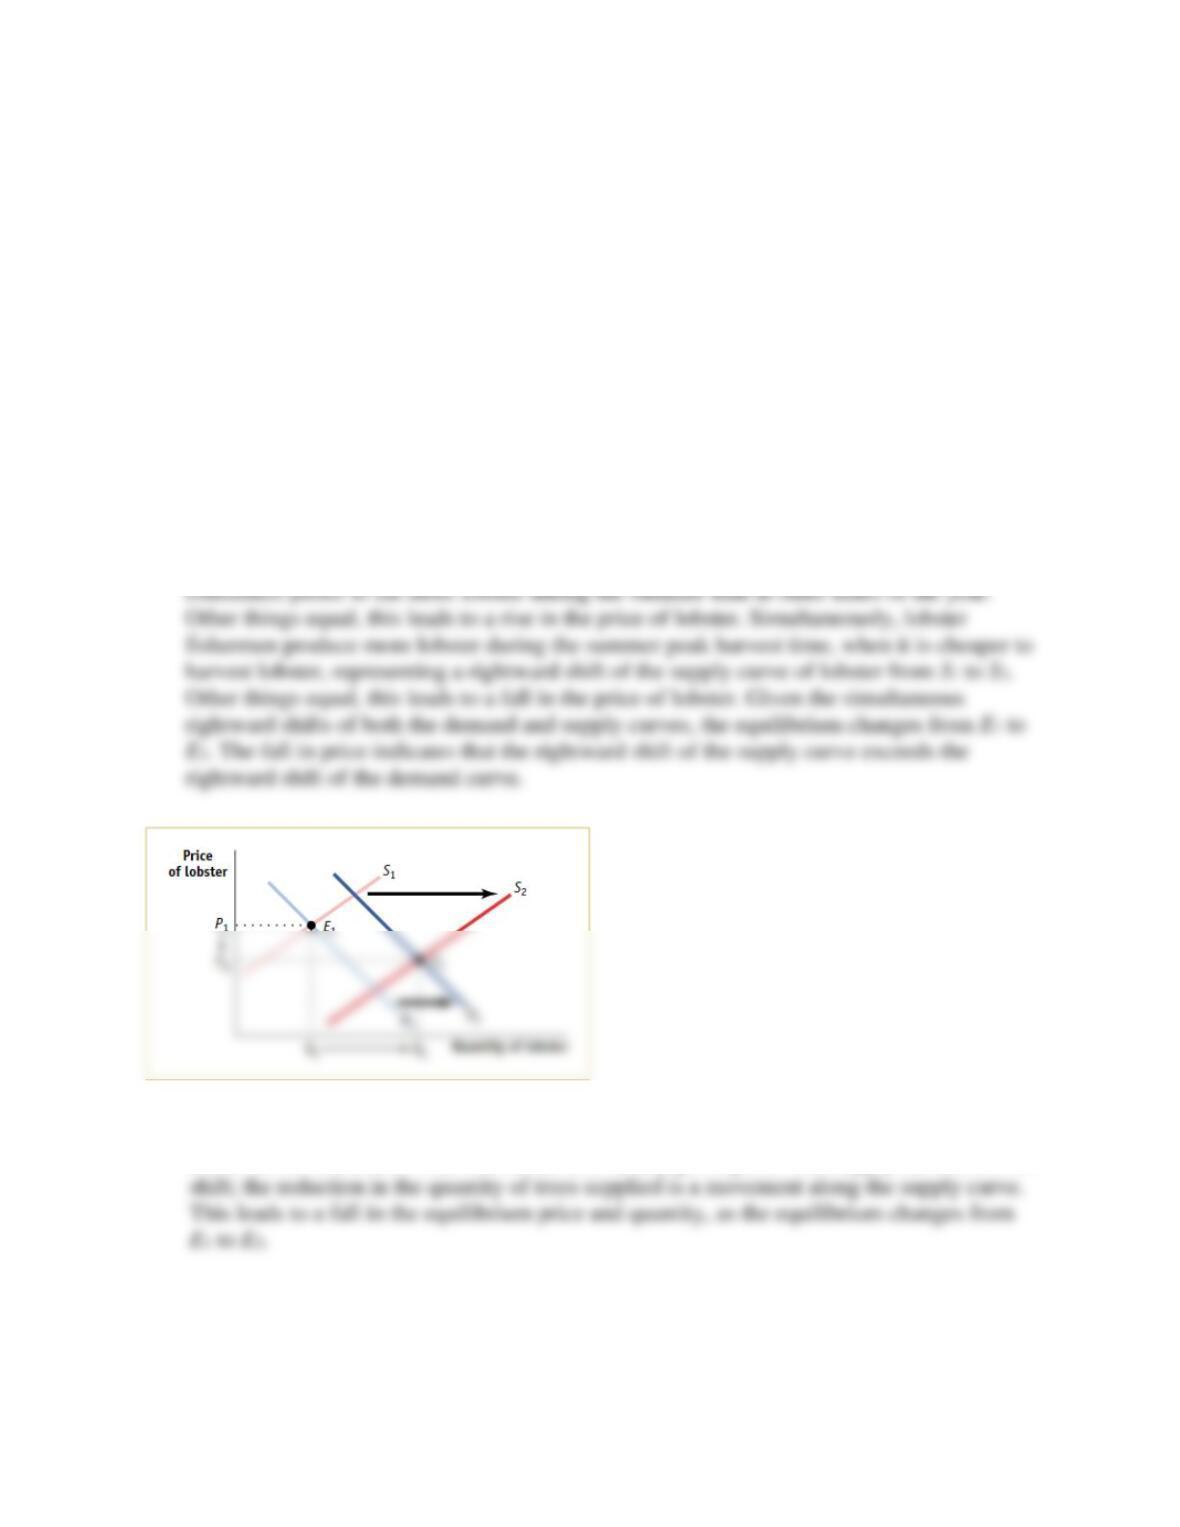
a. Lobster prices usually fall during the summer peak lobster harvest season, despite the fact
that people like to eat lobster during the summer more than at any other time of year.
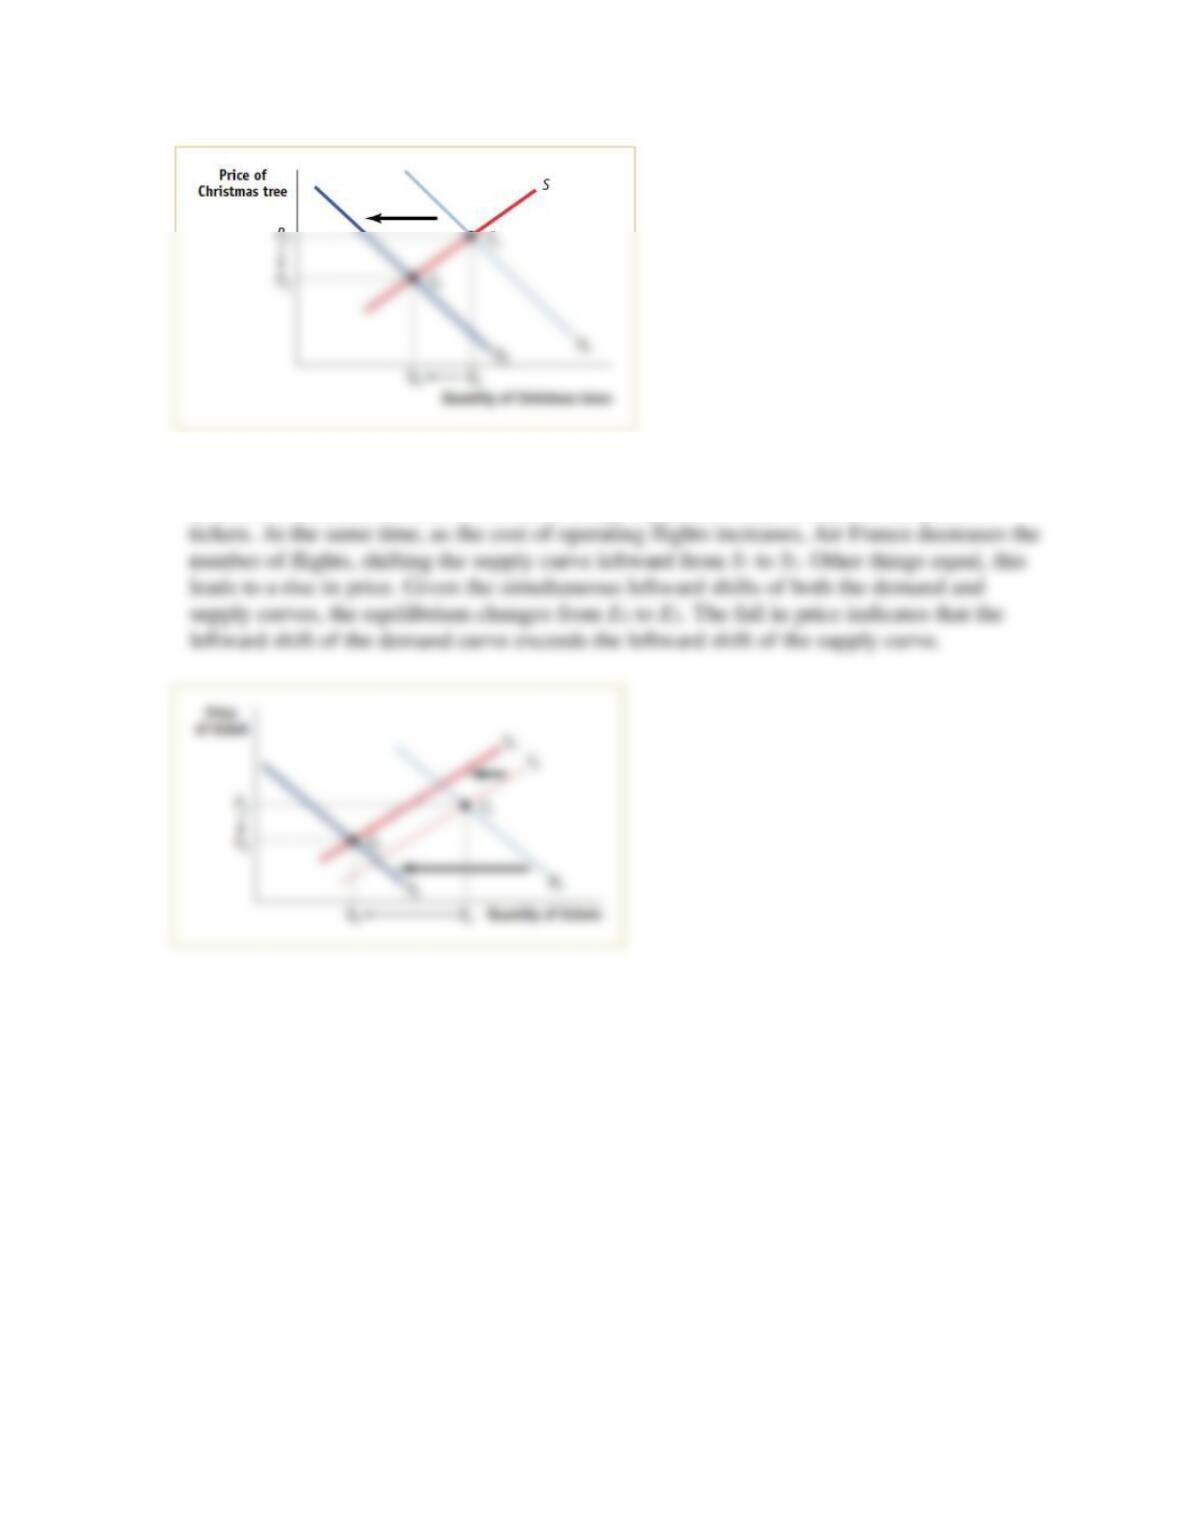
b. The price of a Christmas tree is lower after Christmas than before but fewer trees are sold.
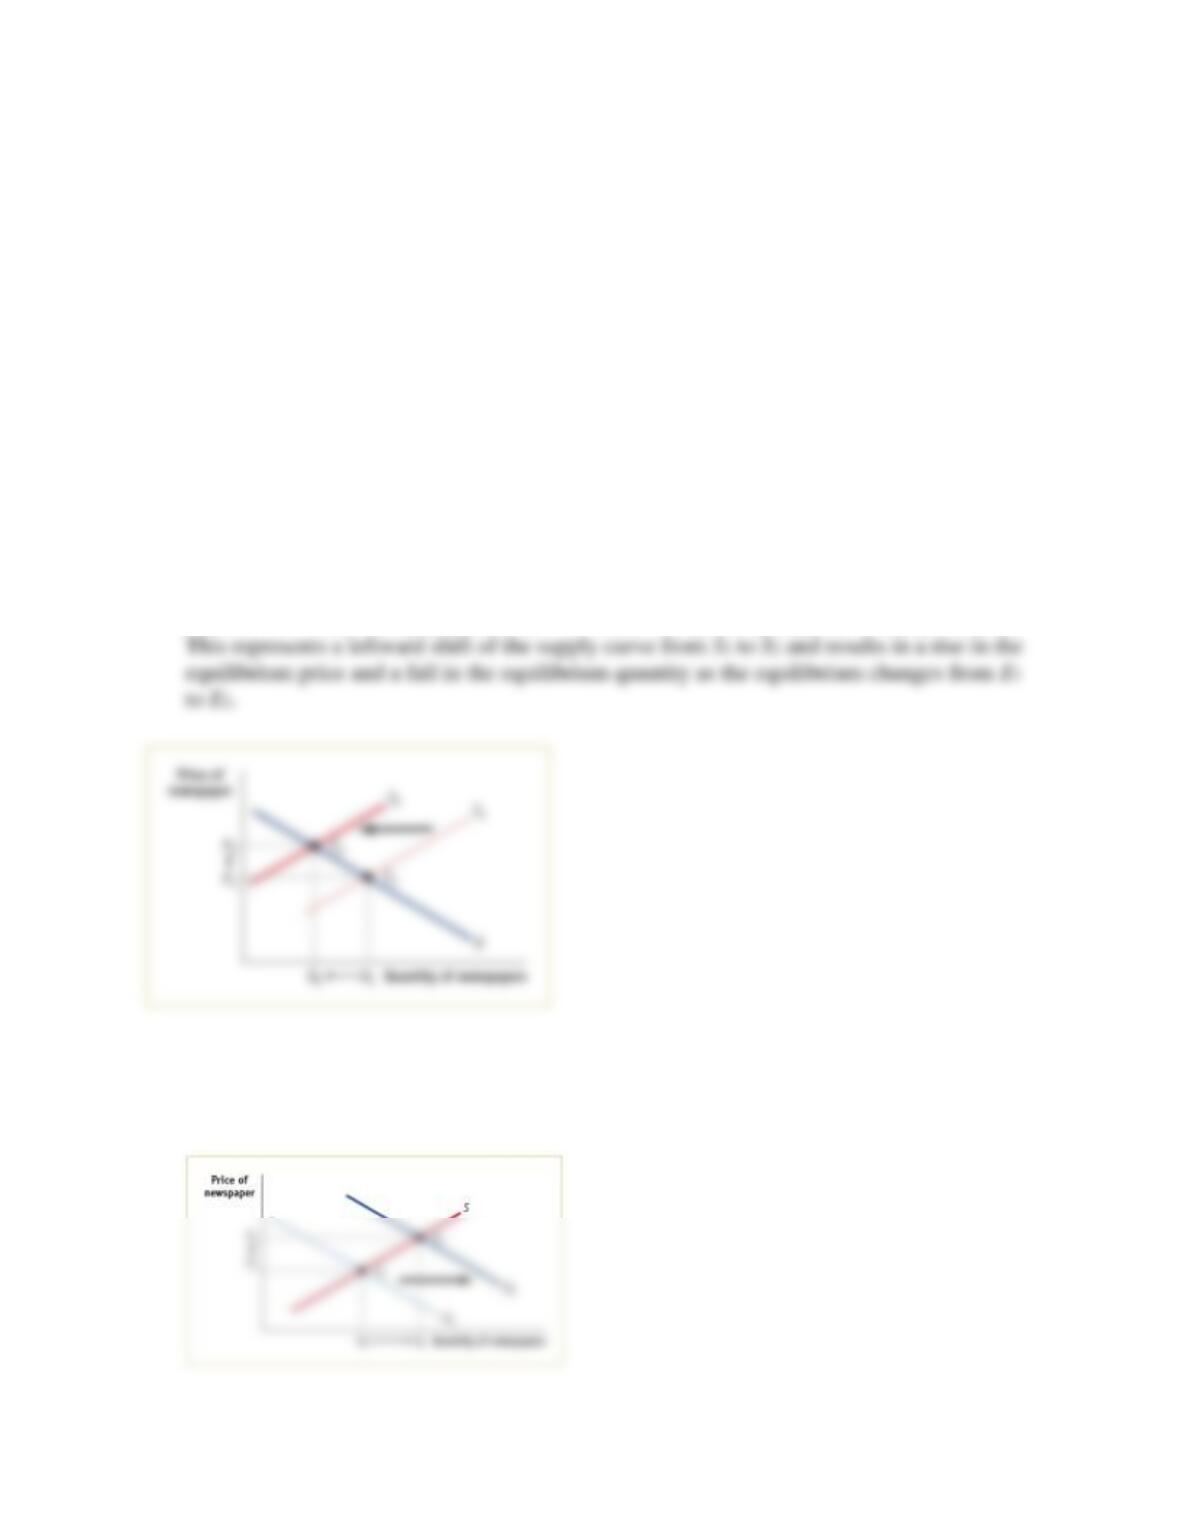
c. The price of a round-trip ticket to Paris on Air France falls by more than $200 after the end
of school vacation in September. This happens despite the fact that generally worsening
weather increases the cost of operating flights to Paris, and Air France therefore reduces the
number of flights to Paris at any given price.
Solution 3
3. a. There is a rightward shift of the demand curve from D1 to D2 during the summer because
b. There is a leftward shift of the demand curve for Christmas trees after Christmas from D1 to
D2, as fewer consumers want Christmas trees at any given price. The supply curve does not
c. There is a leftward shift of the demand curve for tickets to Paris in September, after the end
of school vacation, from D1 to D2. Other things equal, this leads to a fall in the price of
Question 4
4. Show in a diagram the effect on the demand curve, the supply curve, the equilibrium price,
and the equilibrium quantity of each of the following events.
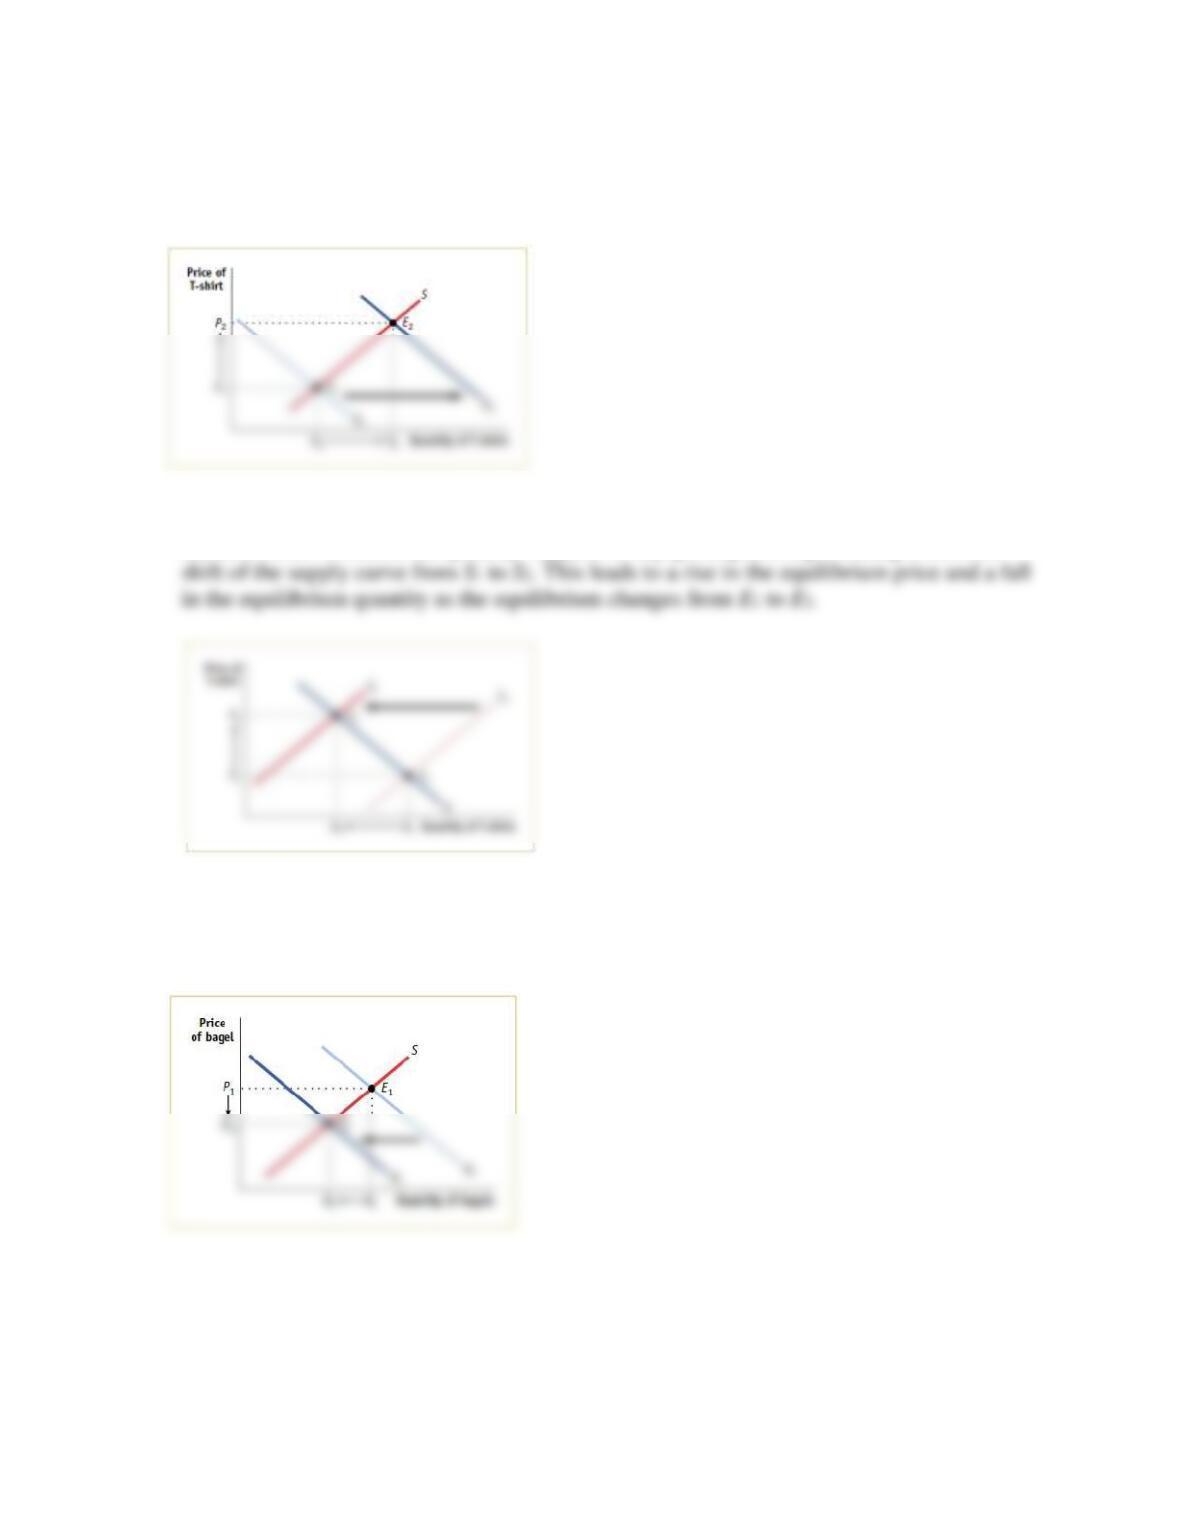
a. The market for newspapers in your town
Case 1: The salaries of journalists go up.
Case 2: There is a big news event in your town, which is reported in the newspapers.
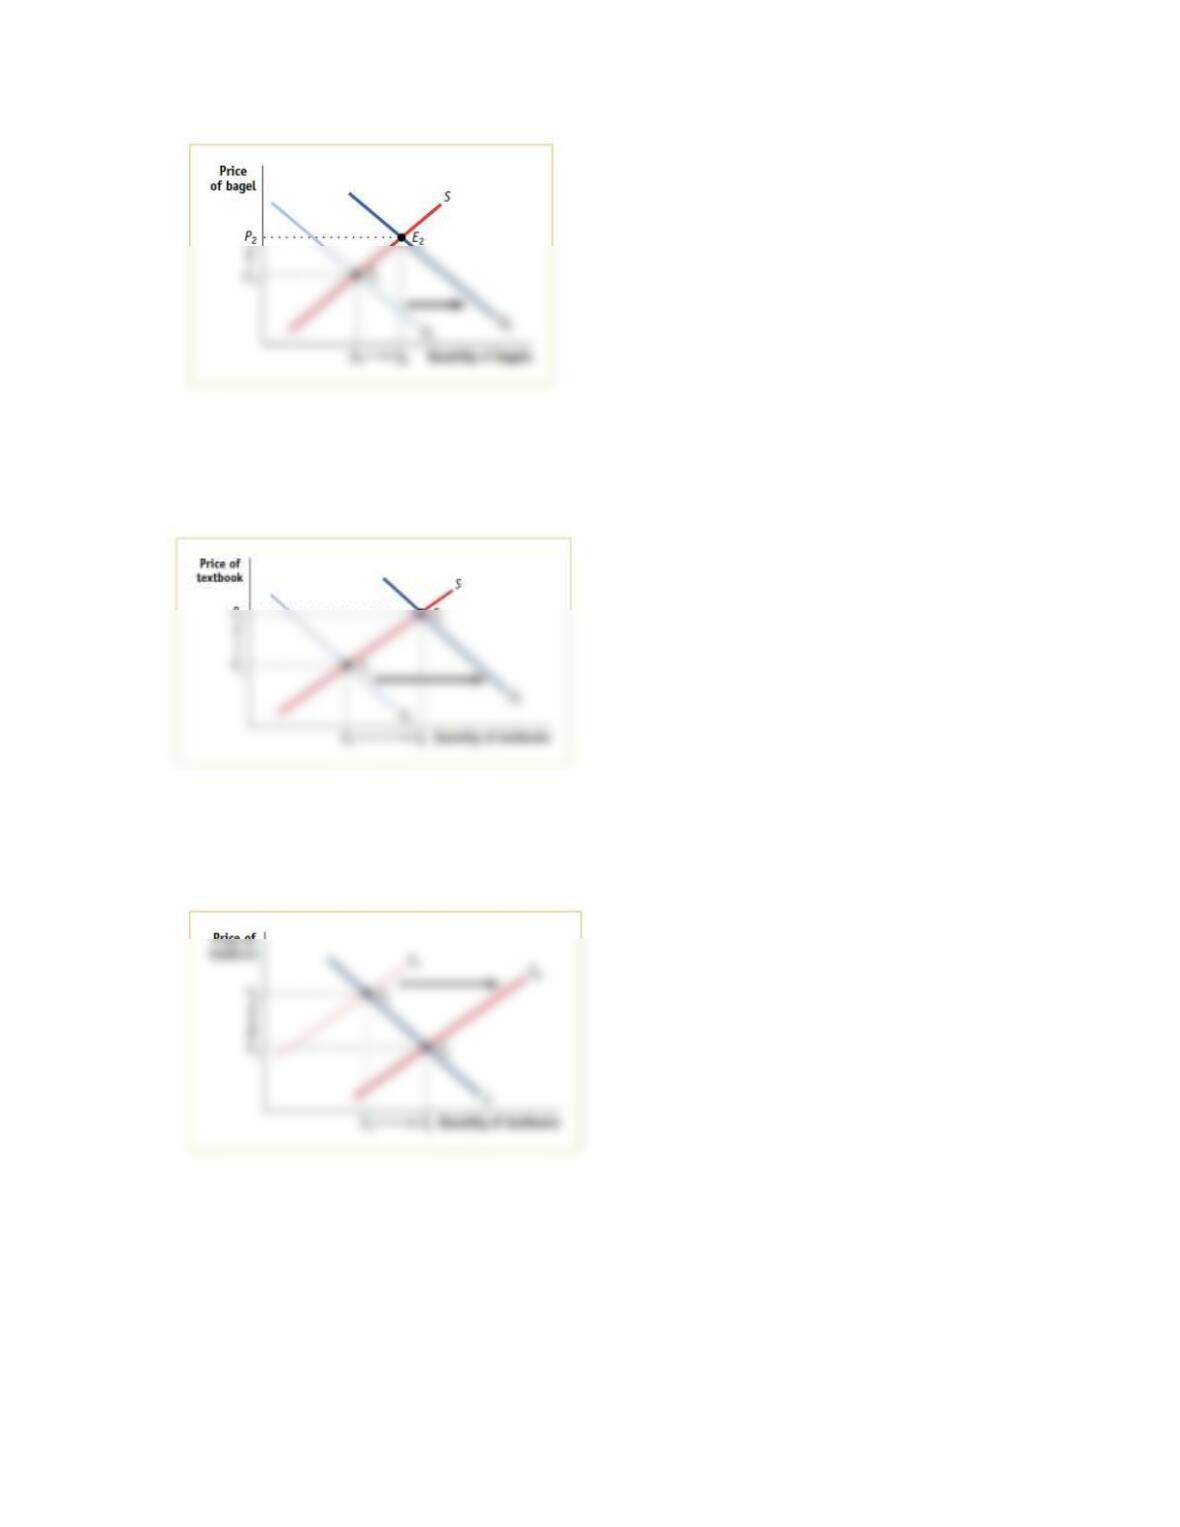
b. The market for Seattle Seahawks cotton T-shirts
Case 1: The Seahawks win the Super Bowl.
Case 2: The price of cotton increases.
c. The market for bagels
Case 1: People realize how fattening bagels are.
Case 2: People have less time to make themselves a cooked breakfast.
d. The market for the Krugman and Wells economics textbook
Case 1: Your professor makes it required reading for all of his or her students.
Case 2: Printing costs for textbooks are lowered by the use of synthetic paper.
Solution 4
4. a. Case 1: Journalists are an input in the production of newspapers; an increase in their
salaries will cause newspaper publishers to reduce the quantity supplied at any given price.
Case 2: Townspeople will wish to purchase more newspapers at any given price. This
represents a rightward shift of the demand curve from D1 to D2 and leads to a rise in both
the equilibrium price and quantity as the equilibrium changes from E1 to E2.
b. Case 1: Fans will demand more Seattle Seahawks memorabilia at any given price. This
represents a rightward shift of the demand curve from D1 to D2 and leads to a rise in both
the equilibrium price and quantity as the equilibrium changes from E1 to E2.
Case 2: Cotton is an input into T-shirts; an increase in its price will cause T-shirt
manufacturers to reduce the quantity supplied at any given price, representing a leftward
c. Case 1: Consumers will demand fewer bagels at any given price. This represents a leftward
shift of the demand curve from D1 to D2 and leads to a fall in both the equilibrium price and
quantity as the equilibrium changes from E1 to E2.
Case 2: Consumers will demand more bagels (a substitute for cooked breakfasts) at any
given price. This represents a rightward shift of the demand curve from D1 to D2 and leads
to a rise in both the equilibrium price and quantity as the equilibrium changes from E1 to E2.
d. Case 1: A greater quantity of textbooks will be demanded at any given price, representing a
rightward shift of the demand curve from D1 to D2. Equilibrium price and quantity will rise
as the equilibrium changes from E1 to E2.
Case 2: The textbook publisher will offer more textbooks for sale at any given price,
representing a rightward shift of the supply curve from S1 to S2. Equilibrium price will fall
and equilibrium quantity will rise as the equilibrium changes from E1 to E2.
Question 5
5. Let’s assume that each person in the United States consumes an average of 37 gallons of soft
drinks (nondiet) at an average price of $2 per gallon and that the U.S. population is 294
million. At a price of $1.50 per gallon, each individual consumer would demand 50 gallons of
soft drinks. From this information about the individual demand schedule, calculate the market
demand schedule for soft drinks for the prices of $1.50 and $2 per gallon.

Solution 5
5. The quantity demanded by an individual consumer at a price of $2 was 37 gallons, and there
Question 6
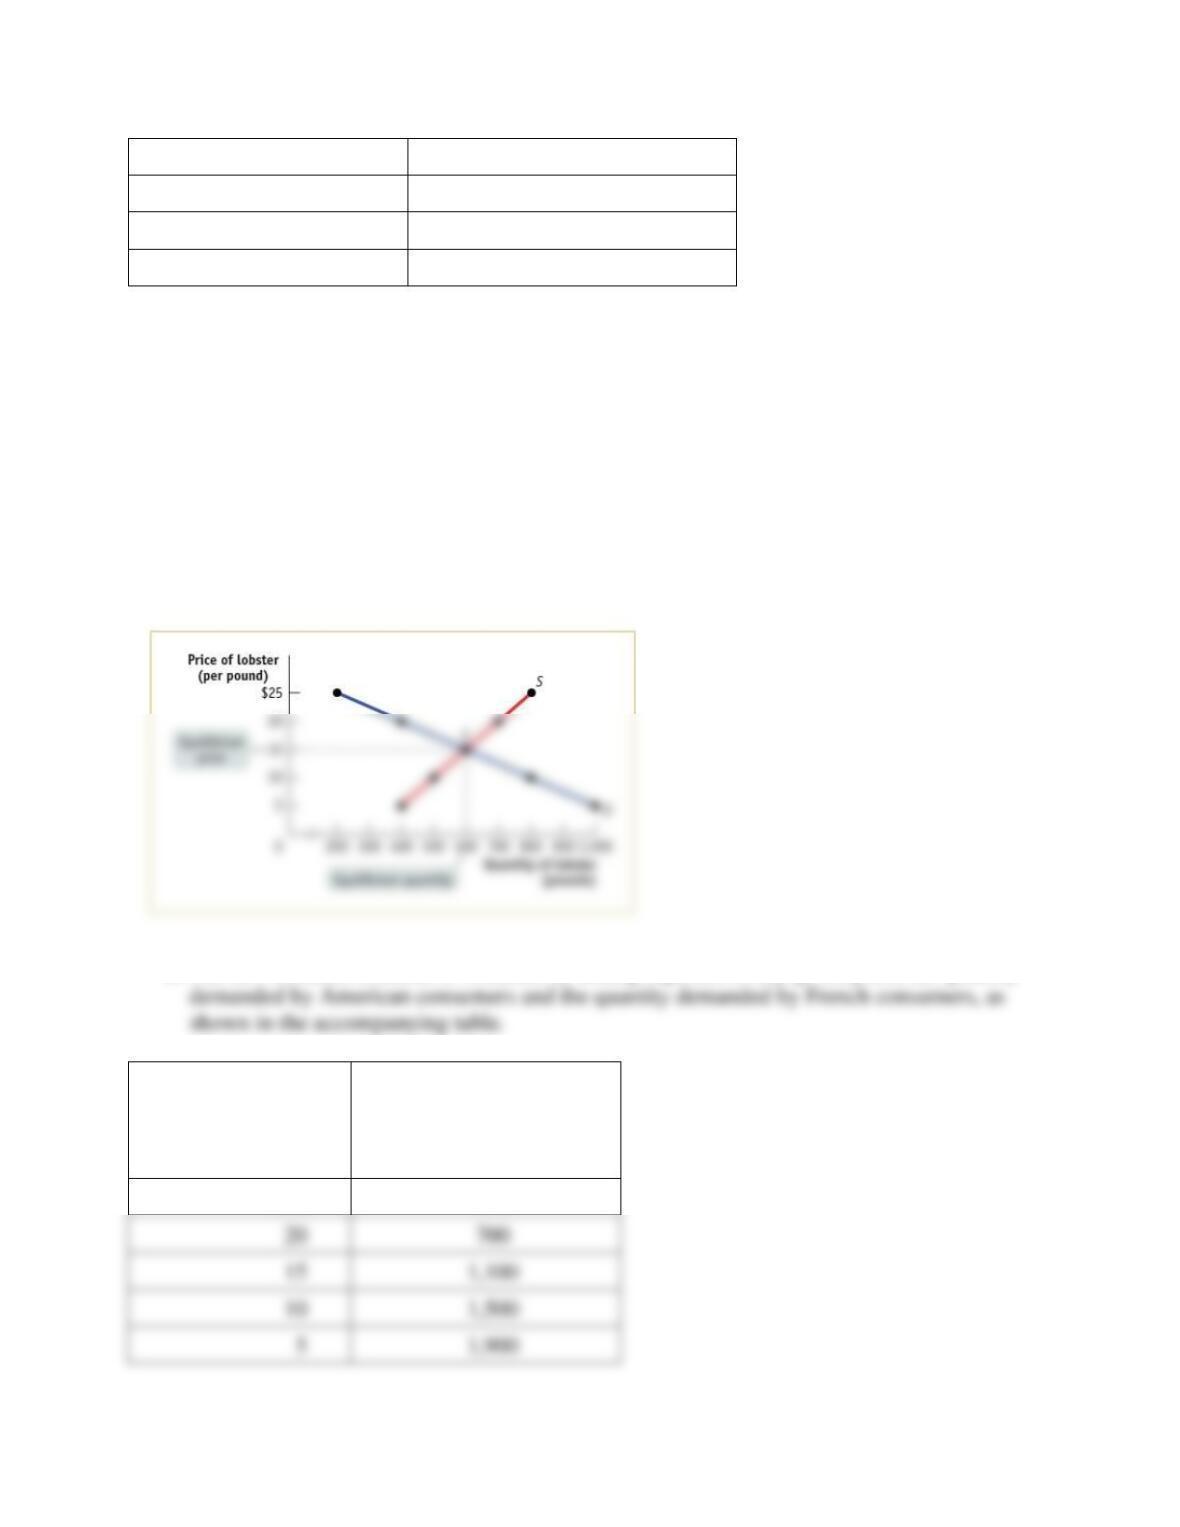
6. Suppose that the supply schedule of Maine lobsters is as follows:
Price of lobster (per
pound)
Quantity of lobster supplied
(pounds)
$25
800
20
700
15
600
10
500
5
400
Suppose that Maine lobsters can be sold only in the United States. The U.S. demand schedule
for Maine lobsters is as follows:
Price of lobster (per
pound)
Quantity of lobster
demanded (pounds)
$25
200
20
400
15
600
10
800
5
1,000
a. Draw the demand curve and the supply curve for Maine lobsters. What are the equilibrium
price and quantity of lobsters?
Now suppose that Maine lobsters can be sold in France. The French demand schedule for
Maine lobsters is as follows:
Price of lobster (per
pound)
Quantity of lobster
demanded (pounds)
$25
100
20
300
15
500
10
700
5
900
b. What is the demand schedule for Maine lobsters now that French consumers can also buy
them? Draw a supply and demand diagram that illustrates the new equilibrium price and
quantity of lobsters. What will happen to the price at which fishermen can sell lobster?
What will happen to the price paid by U.S. consumers? What will happen to the quantity
consumed by U.S. consumers?
Solution 6
6. a. The equilibrium price of lobster is $15 per pound and the equilibrium quantity is 600
pounds, point E in the accompanying diagram.
b. The new demand schedule is obtained by adding together, at any given price, the quantity
Price of lobster
(per pound)
Quantity of lobster
demanded (U.S.
pounds plus French
pounds)
$25
300
700
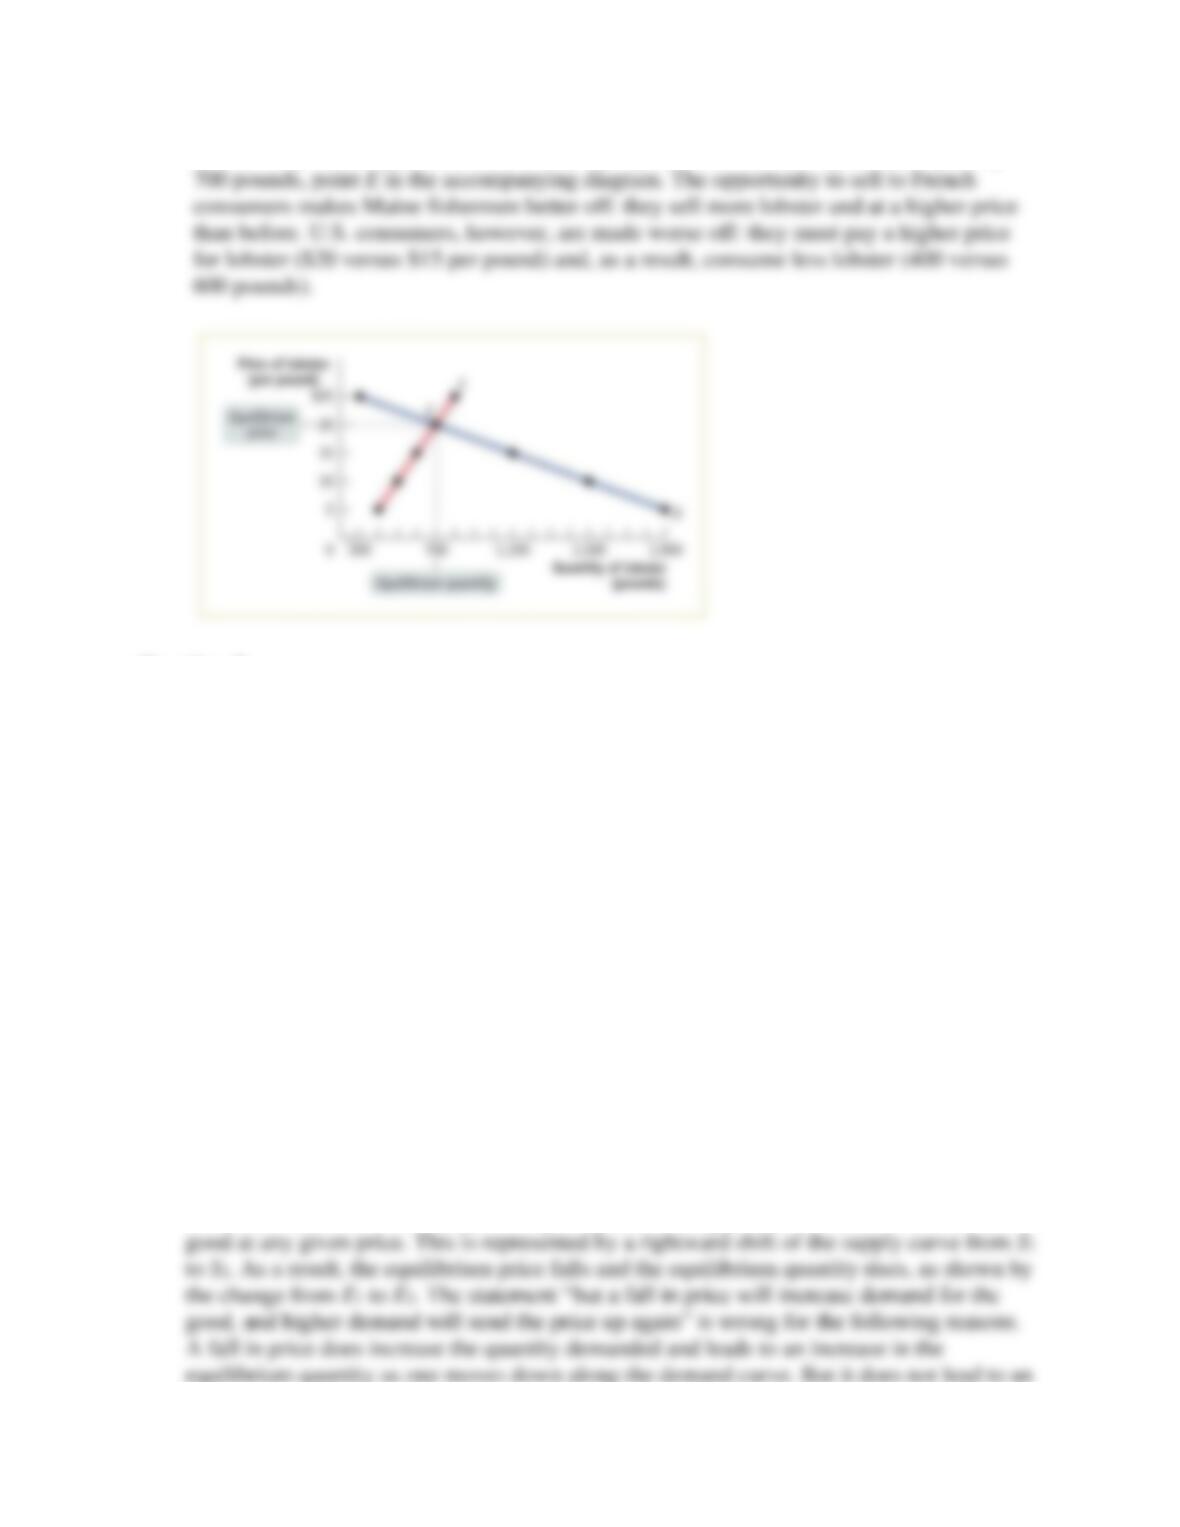
The new equilibrium price of lobster is $20 per pound and the new equilibrium quantity is
Question 7
7. Find the flaws in reasoning in the following statements, paying particular attention to the
distinction between shifts of and movements along the supply and demand curves. Draw a
diagram to illustrate what actually happens in each situation.
a. “A technological innovation that lowers the cost of producing a good might seem at first to
result in a reduction in the price of the good to consumers. But a fall in price will increase
demand for the good, and higher demand will send the price up again. It is not certain,
therefore, that an innovation will really reduce price in the end.”
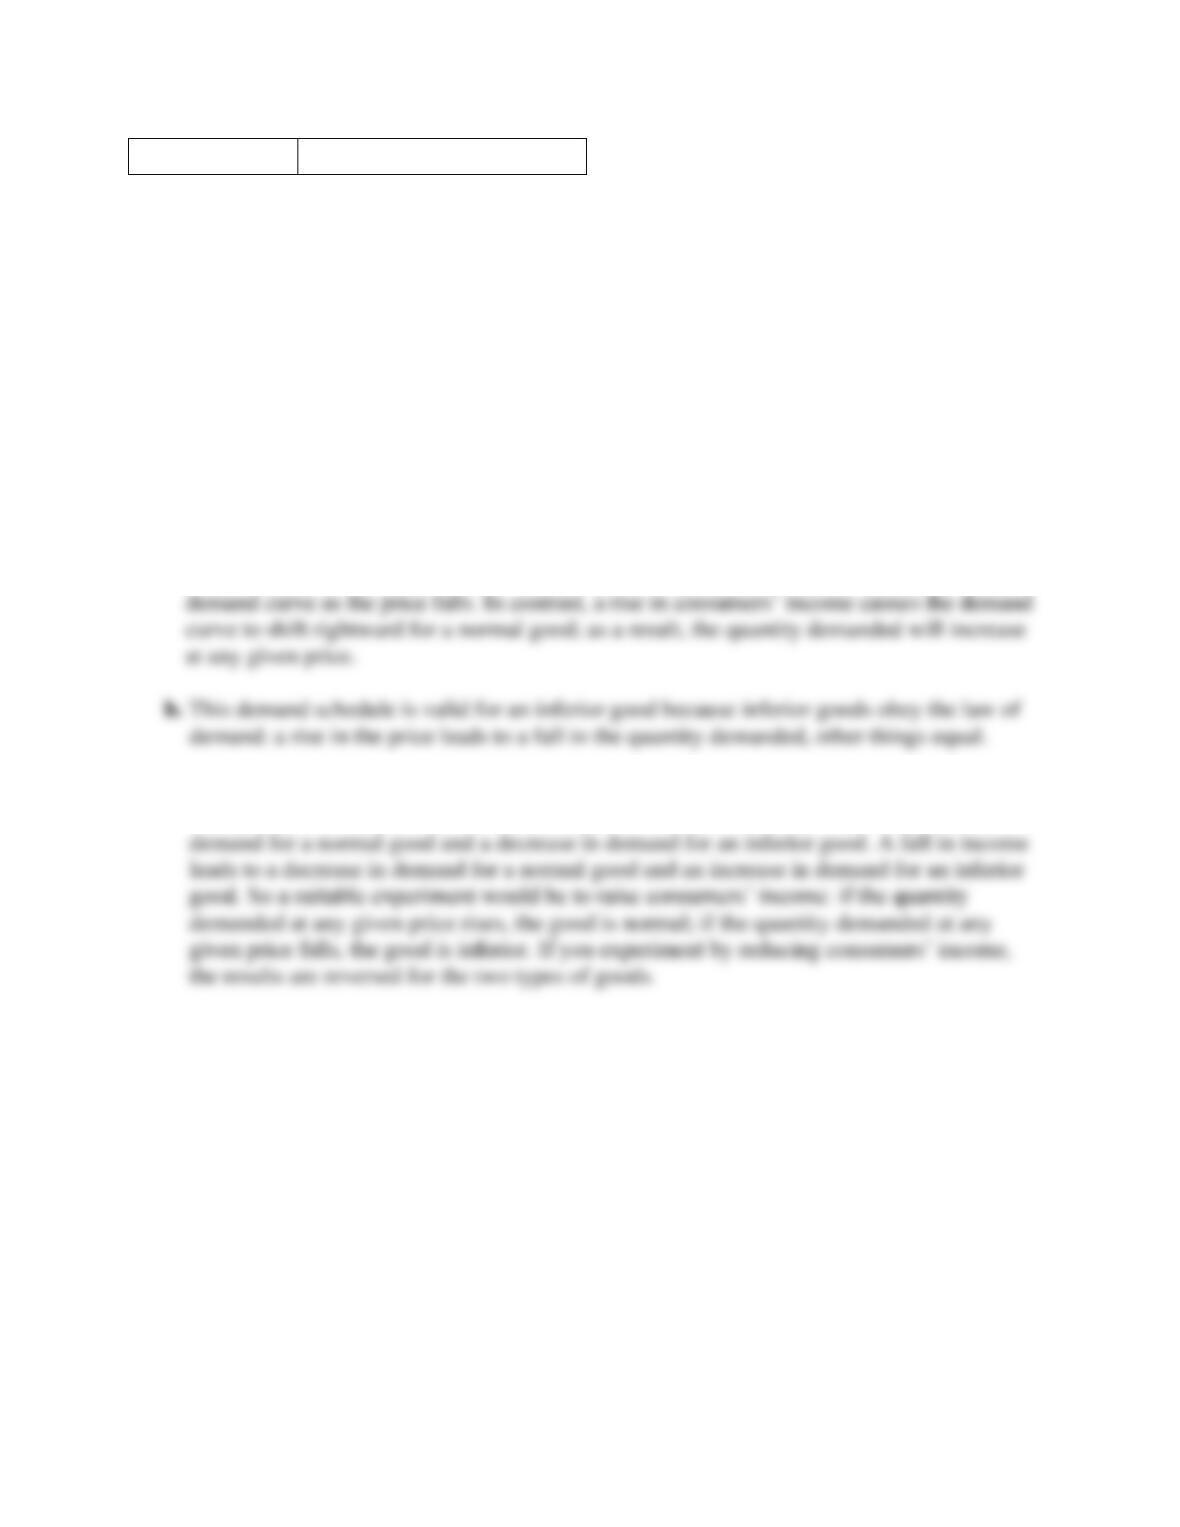
b. “A study shows that eating a clove of garlic a day can help prevent heart disease, causing
many consumers to demand more garlic. This increase in demand results in a rise in the
price of garlic. Consumers, seeing that the price of garlic has gone up, reduce their demand
for garlic. This causes the demand for garlic to decrease and the price of garlic to fall.
Therefore, the ultimate effect of the study on the price of garlic is uncertain.”
Solution 7
7. a. This statement confuses a shift of a curve with a movement along a curve. A technological
innovation lowers the cost of producing the good, leading producers to offer more of the
equilibrium quantity as one moves down along the demand curve. But it does not lead to an
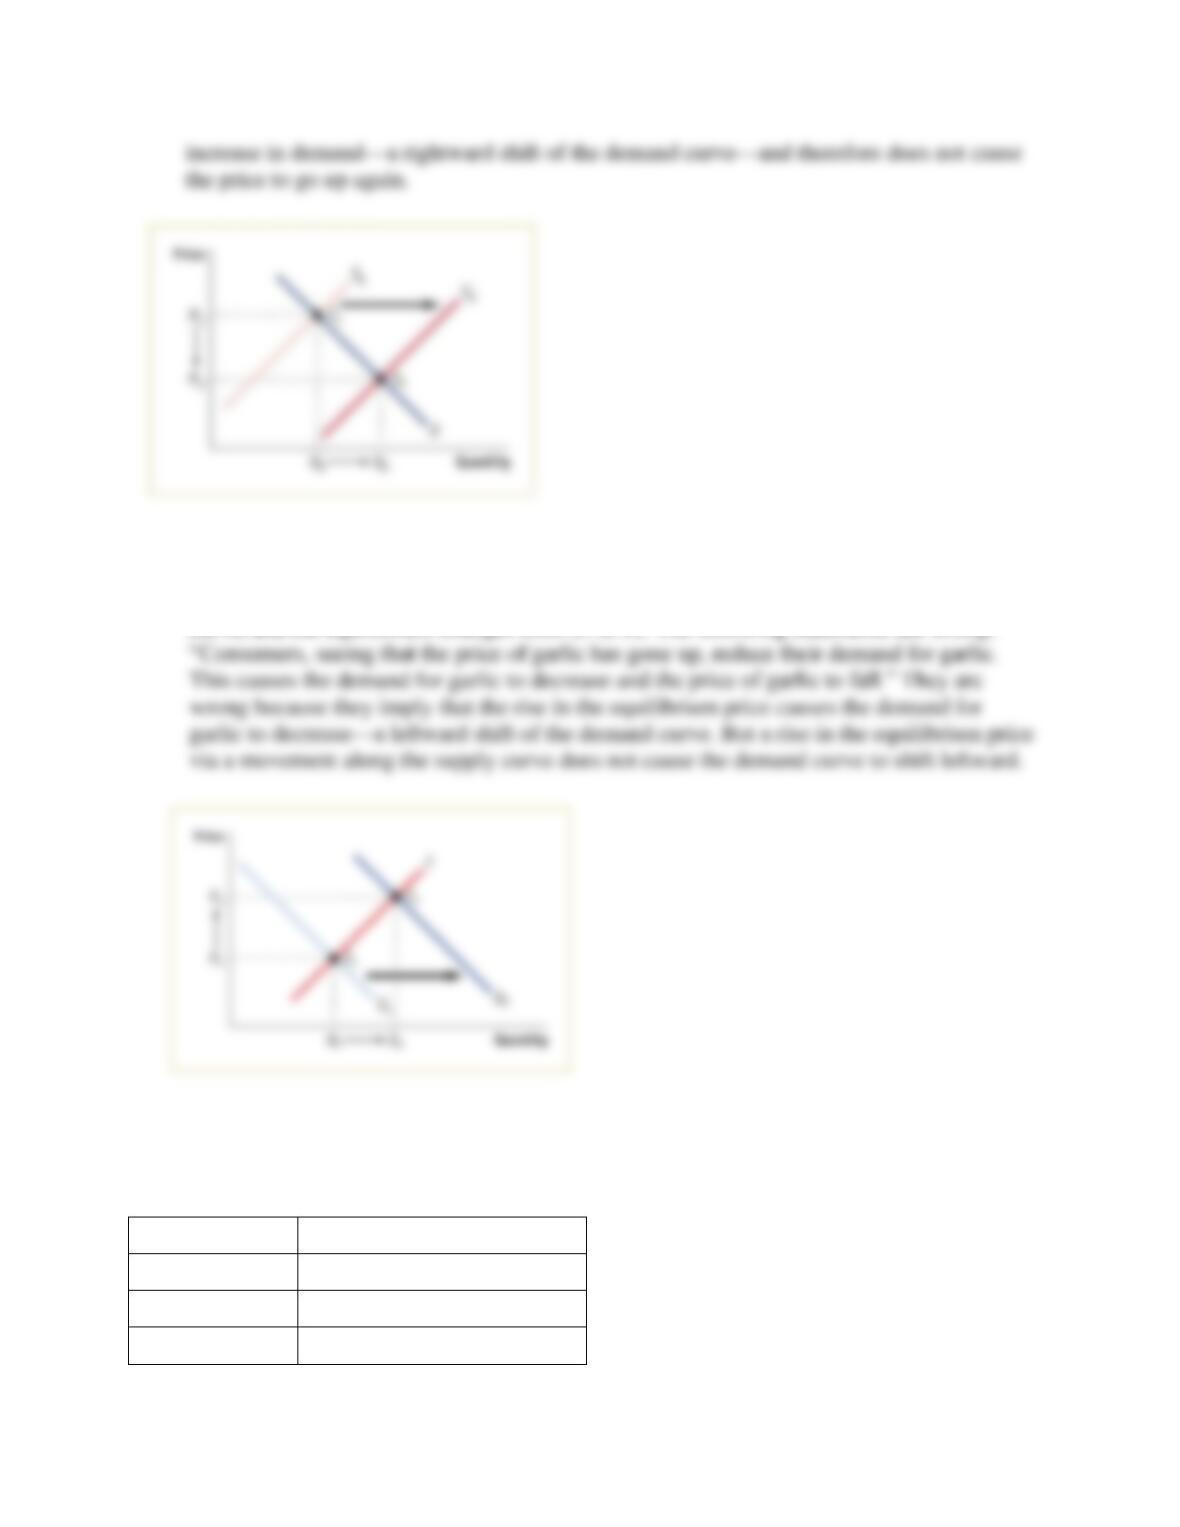
b. This statement also confuses a shift of a curve with a movement along a curve. The health
report generates an increase in demand—a rightward shift of the demand curve from D1 to
D2. This leads to a higher equilibrium price and quantity as we move up along the supply
curve, and the equilibrium changes from E1 to E2. The following statements are wrong:
Question 8
8. The following table shows a demand schedule for a normal good.
Price
Quantity demanded
$23
70
21
90
19
110
17
130
a. Do you think that the increase in quantity demanded (say, from 90 to 110 in the table) when
price decreases (from $21 to $19) is due to a rise in consumers’ income? Explain clearly
(and briefly) why or why not.
b. Now suppose that the good is an inferior good. Would the demand schedule still be valid
for an inferior good?
c. Lastly, assume you do not know whether the good is normal or inferior. Devise an
experiment that would allow you to determine which one it was. Explain.
Solution 8
8. a. The increase in quantity demanded from 90 to 110 when the price declines from $21 to $19
is not due to a rise in consumers’ income. Rather, it represents a movement along the
c. You can determine whether a good is normal or inferior only by examining what happens to
the demand after consumers’ income changes. A rise in income leads to an increase in
Question 9
9. In recent years, the number of car producers in China has increased rapidly. In fact, China now
has more car brands than the United States. In addition, car sales have climbed every year and
automakers have increased their output at even faster rates, causing fierce competition and a
decline in prices. At the same time, Chinese consumers’ incomes have risen. Assume that cars
are a normal good. Draw a diagram of the supply and demand curves for cars in China to
explain what has happened in the Chinese car market.
Solution 9
9. As more automakers enter the Chinese market, the supply curve shifts to the right, from S1 to
S2. And as Chinese consumers’ incomes rise, the demand curve for cars shifts to the right,
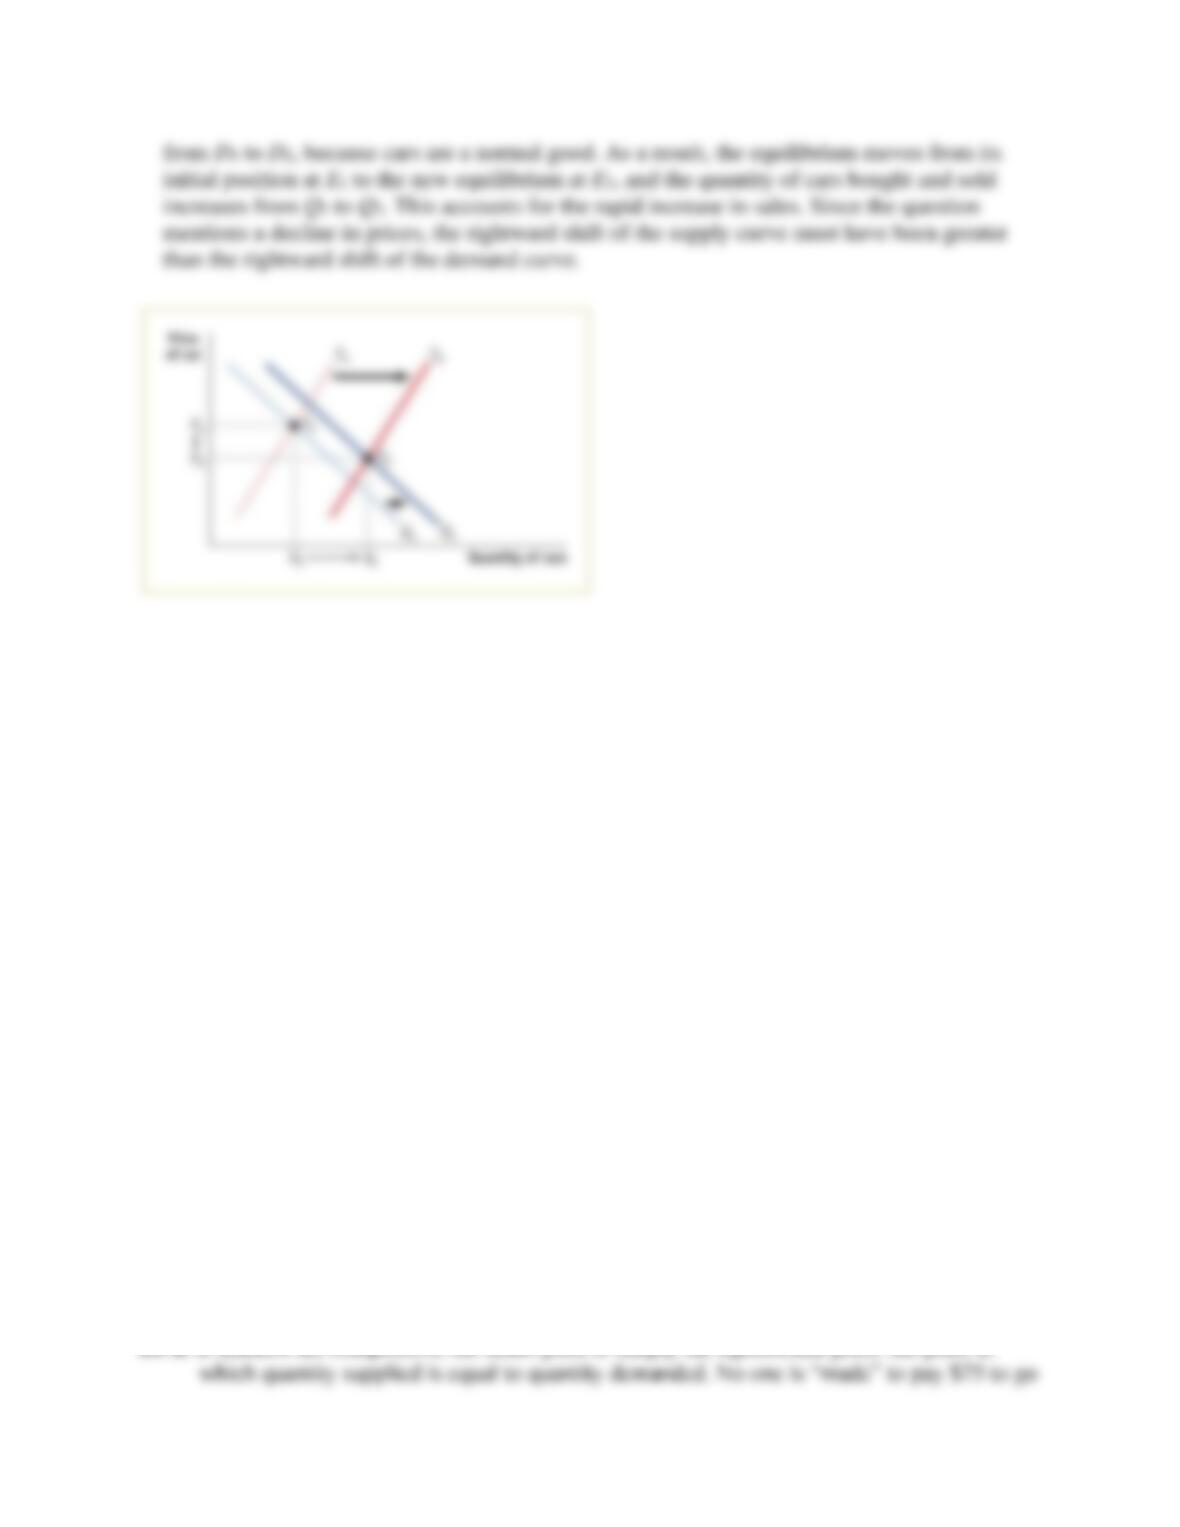
Question 10
10. Music fans often bemoan the high price of concert tickets. One rock superstar has argued that
it isn’t worth hundreds, even thousands, of dollars to hear him and his band play. Let’s
assume this star sold out arenas around the country at an average ticket price of $75.
a. How would you evaluate the argument that ticket prices are too high?
b. Suppose that due to this star’s protests, ticket prices were lowered to $50. In what sense is
this price too low? Draw a diagram using supply and demand curves to support your
argument.
c. Suppose the superstar really wanted to bring down ticket prices. Since he and his band
control the supply of their services, what do you recommend they do? Explain using a
supply and demand diagram.
d. Suppose the band’s next album was a total dud. Do you think they would still have to
worry about ticket prices being too high? Why or why not? Draw a supply and demand
diagram to support your argument.
e. Suppose the group announced their next tour was going to be their last. What effect would
this likely have on the demand for and price of tickets? Illustrate with a supply and
demand diagram.
Solution 10
10. a. If markets are competitive, the ticket price is simply the equilibrium price: the price at
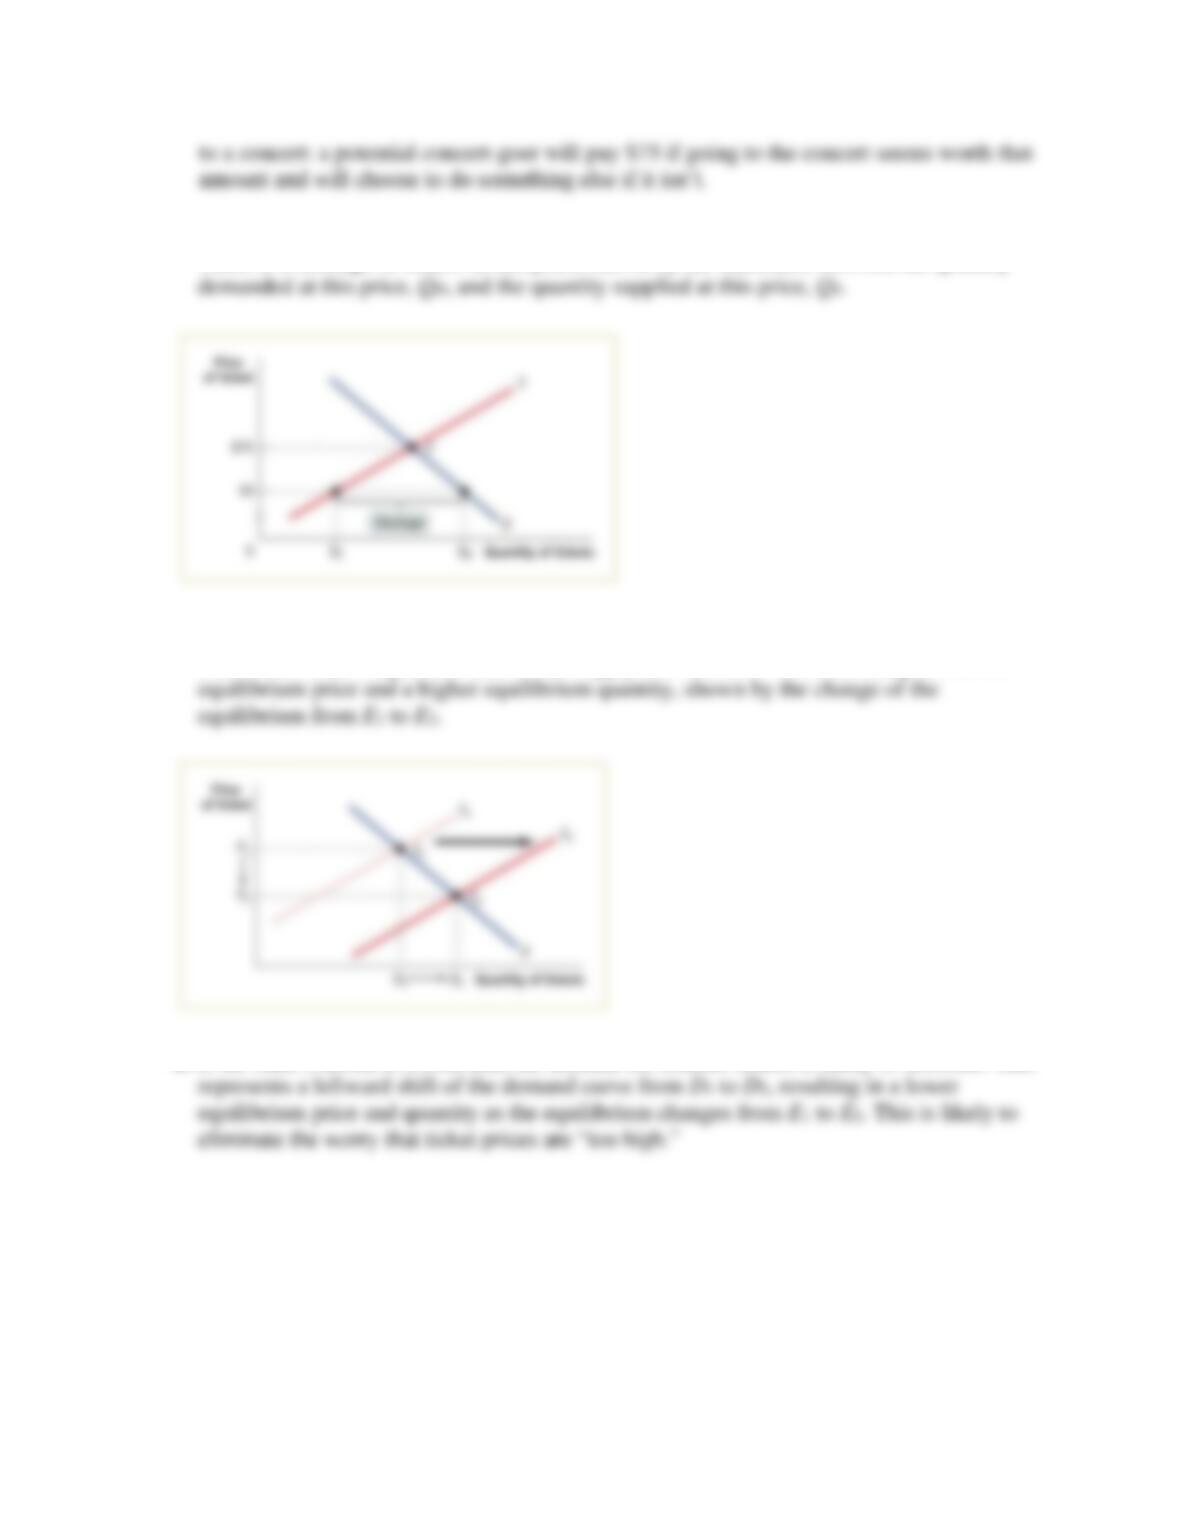
b. At $50 each, the quantity of tickets demanded exceeds the quantity of tickets supplied.
There is a shortage of tickets at this price, shown by the difference between the quantity
c. The band can lower the average price of a ticket by increasing supply: give more concerts.
This is shown as a rightward shift of the supply curve from S1 to S2, resulting in a lower
d. If the band’s album is a total dud, the demand for concert tickets is likely to decrease. This