CHAPTER 9. ASPHALT AND ASPHALT MIXTURE
9.1. See introduction of Chapter 9.
9.3. See Section 9.1.
9.4.
9.5. See Section 9.3.
9.6.
9.8. a. Meeting specification requirements (quality control and quality assurance) to ensure
safety at the refinery and at the HMA plant.
c. Pumpability at the refinery.
d. Meeting specification requirements (quality control and quality assurance) to ensure
Asphalt Concrete Surface Layer
Aggregate Base
Subgrade
Chip Seal
Prime Cost
106
9.9. See Section 9.6.2.
9.11. See Section 9.7.1.
9.12. High temperature grade !55 + (2 x 2.5) = 60 oC
9.13. High temperature grade !48 + (2 x 2.5) = 53 oC
9.14.
Case
Seven-Day Maximum
Pavement Temperature, ºC
Minimum Pavement
Temperature, ºC
Recommended PG Grade
Mean
, ºC
Std. Dev.
, ºC
Mean
, ºC
Std. Dev.
, ºC
50%
Reliability
98%
Reliability
1
43
1.5
-29
2.5
PG 46-34
PG 46-34
2
51
3
-18
4
PG 52-22
PG 58-28
3
62
2.5
10
2
PG 64-10
PG 70-10
9.15.
Case
Seven-Day Maximum
Pavement Temperature, ºC
Minimum Pavement
Temperature, ºC
Recommended PG Grade
Mean
, ºC
Std. Dev.
, ºC
Mean
, ºC
Std. Dev.
, ºC
50%
Reliability
98%
Reliability
1
39
1
-32
3.5
PG 46-34
PG 46-40
2
54
1.5
-17
2
PG 58-22
PG 58-22
3
69
2
5
2.5
PG 70-10
PG 76-10
9.16.CRS-2 is cationic, sets faster, and is more viscous than SS-1.
9.18. See Section 9.8.
9.20. See Section 9.9.
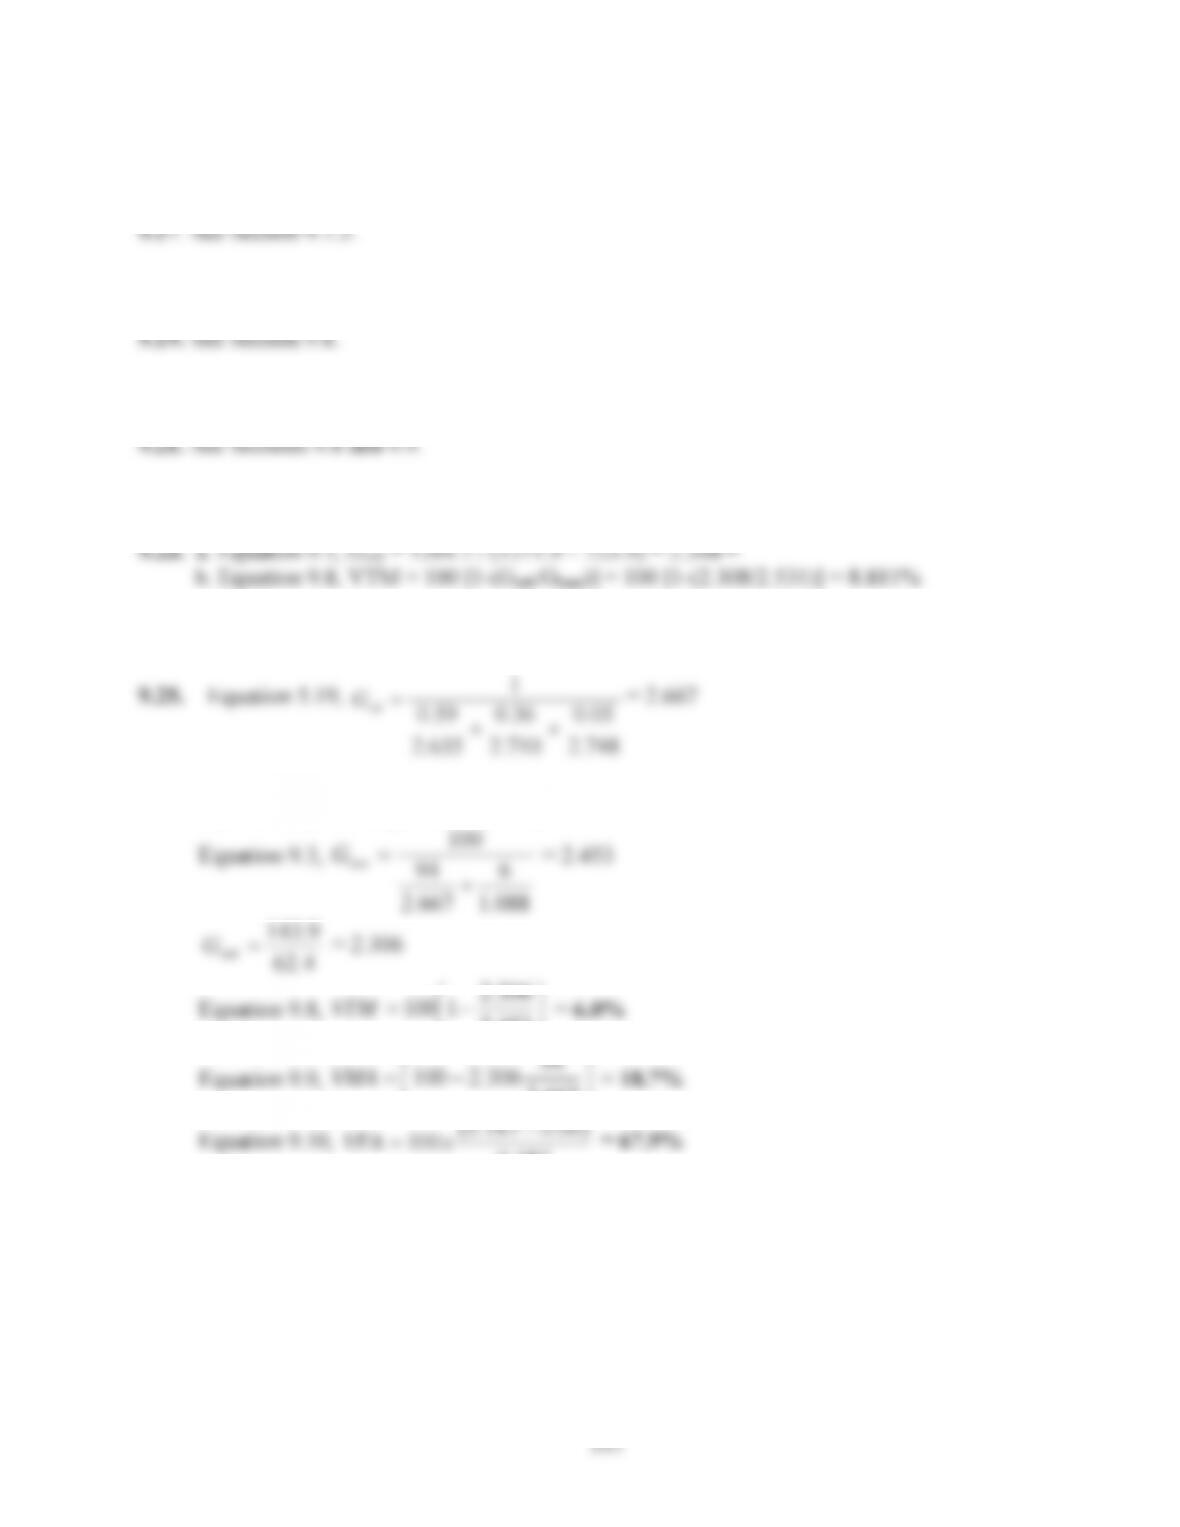
9.22. Equation 9.1, Gmb = 1327.8/ (1342.2-792.4) = 2.415
9.24. See Section 9.9.2.
748.2
05.0
710.2
36.0
635.2
59.0
1
sb
Since absorption is ignored, Gse = Gsb
100
9.26.
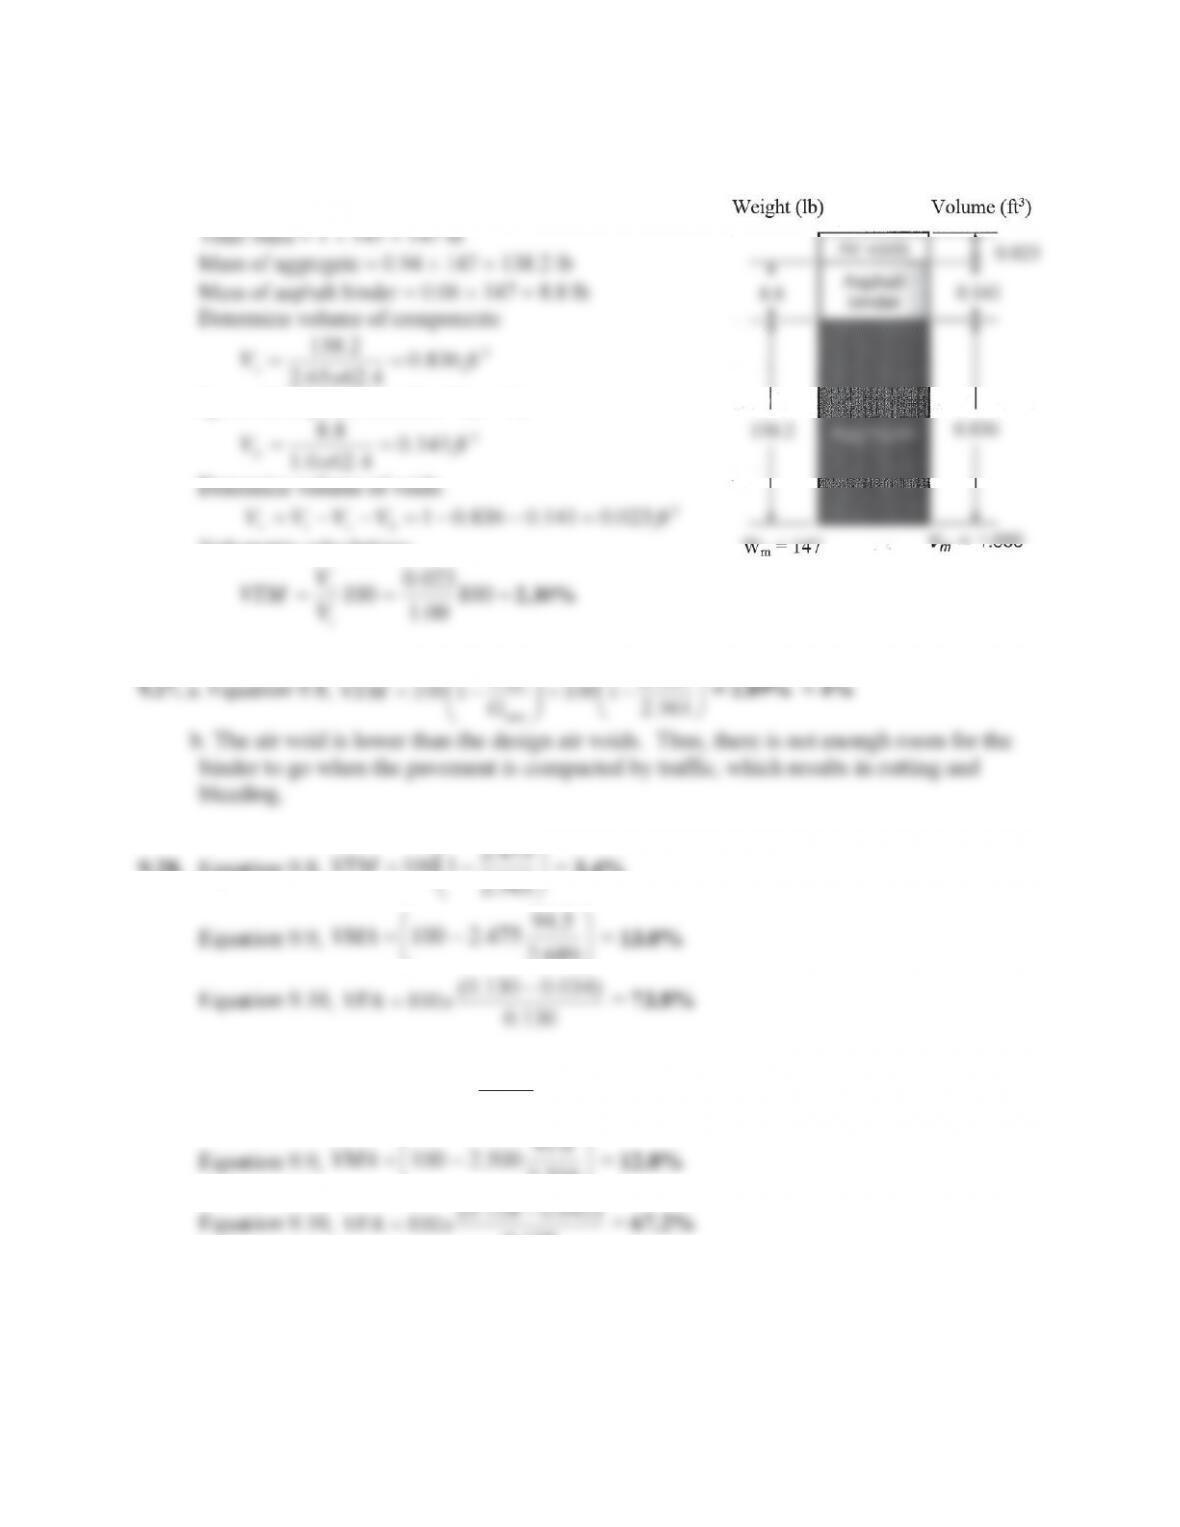
Assume V
t
1 ft
3
Determine mass of mix and components:
4.6265.2
x
s
Ignore absorption, therefore V
be
= V
b
bstv
Volumetric calculations:
023.0
v
V
109
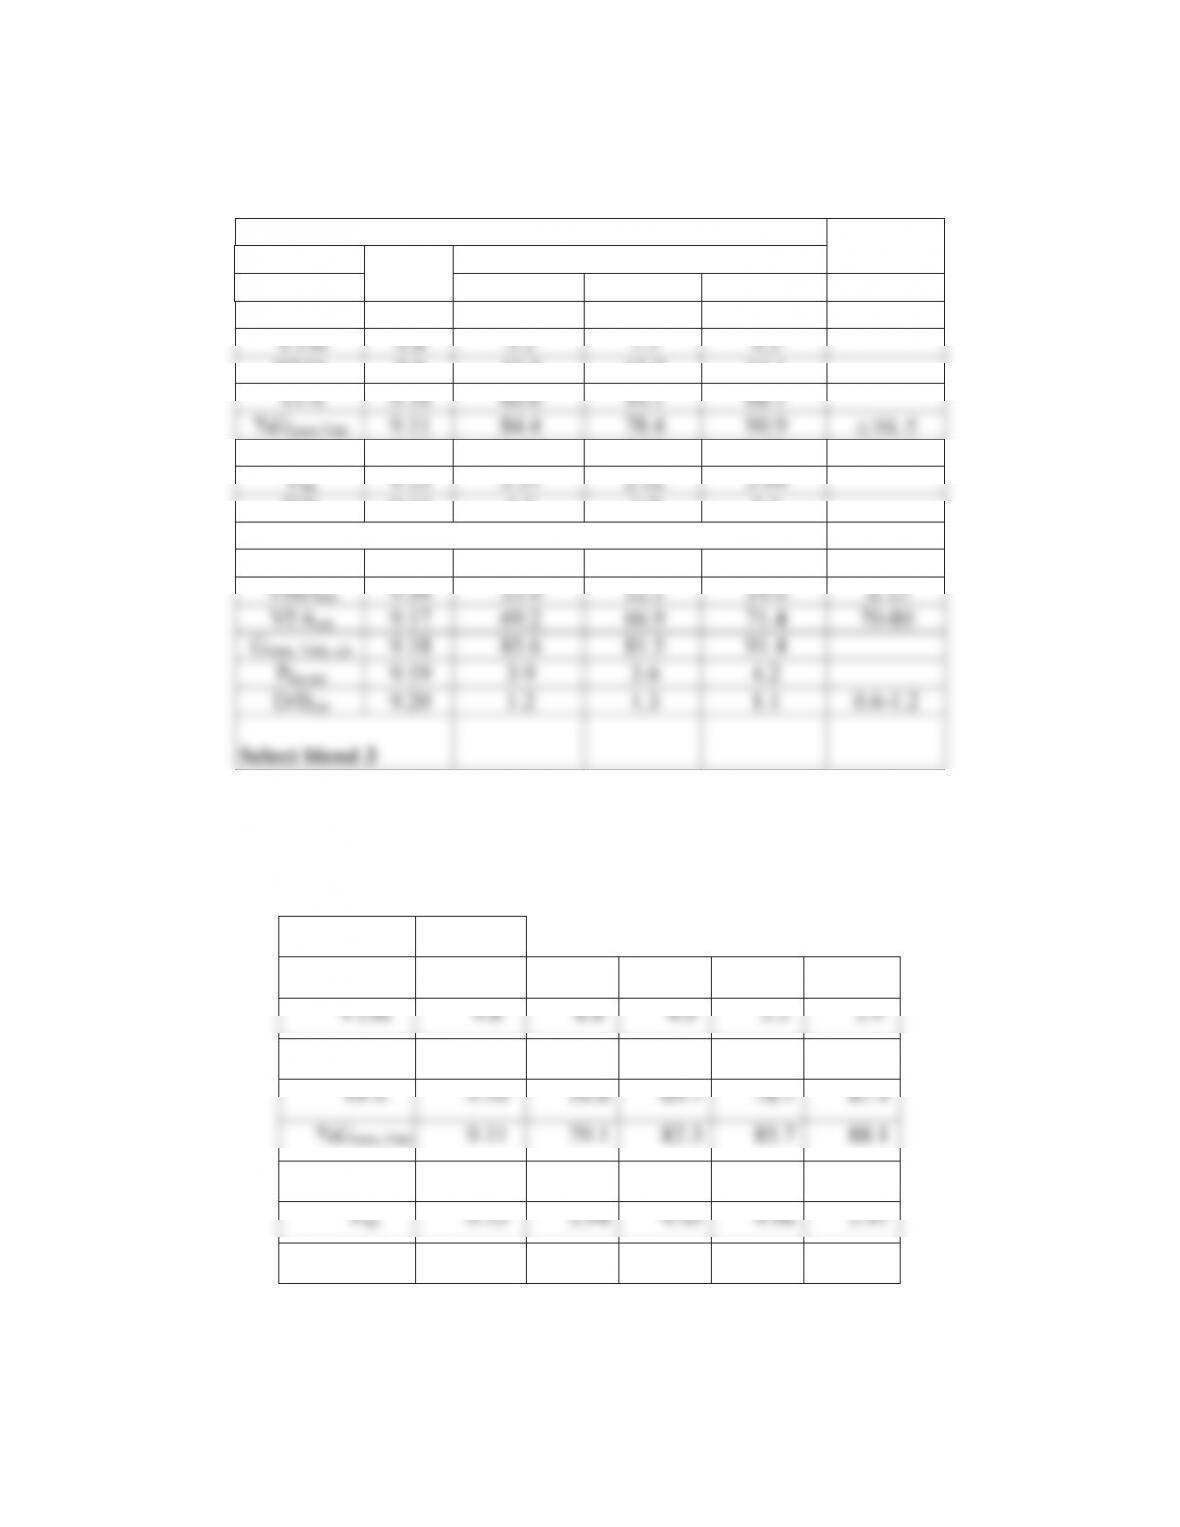
9.31. An Excel sheet can be used.
Volumetric Analysis
Criteria
Computed
Equation
Blend
1
2
3
Gse
9.4
2.855
2.922
2.849
VTM
9.8
5.2
7.1
4.5
VMA
9.9
13.2
12.7
14.1
VFA
9.10
60.6
44.1
68.1
9.11
84.4
78.4
90.9
Pba
9.12
2.69
3.37
1.92
Pbe
9.13
3.37
2.32
3.99
D/b
9.14
1.3
1.9
1.1
Adjusted Values
Pb,est
9.15
6.4
6.7
6.0
VMAest
9.16
13.0
12.1
14.0
t
13
VFAest
9.17
69.2
66.9
71.4
70-80
Gmm, Nini, est
9.18
85.6
81.5
91.4
Pbe,est
9.19
3.9
3.6
4.2
D/Best
9.20
1.2
1.3
1.1
0.6-1.2
Select blend 3
9.32. An Excel sheet can be used.
Volumetric Analysis
Computed
Equation
G
se
9.4
2.828
2.828
2.828
2.828
VTM
9.8
8.8
4.6
3.3
1.9
VMA
9.9
17.9
15.2
15.1
15.1
VFA
9.10
50.8
69.7
78.1
87.4
%G
mm
,Nini
9.11
79.1
82.3
85.7
88.1
P
ba
9.12
1.65
1.65
1.65
1.65
P
be
9.13
3.94
4.45
4.96
5.47
D/B
9.14
1.1
1.0
0.9
0.8
110
Pb
6.1%
VMA
14.7
VFA
77
%Gmm @ Nini
84.0
D/B
1.0
970 3HUFHQW
3HUFHQW%LQGHU
90$3HUFHQW
3HUFHQW %LQGHU
9)$3HUFHQW
3HUFHQW %LQGHU
3HUFHQW *PP#1LQL
3HUFHQW %LQGHU
‘%
3HUFHQW %LQGHU
111
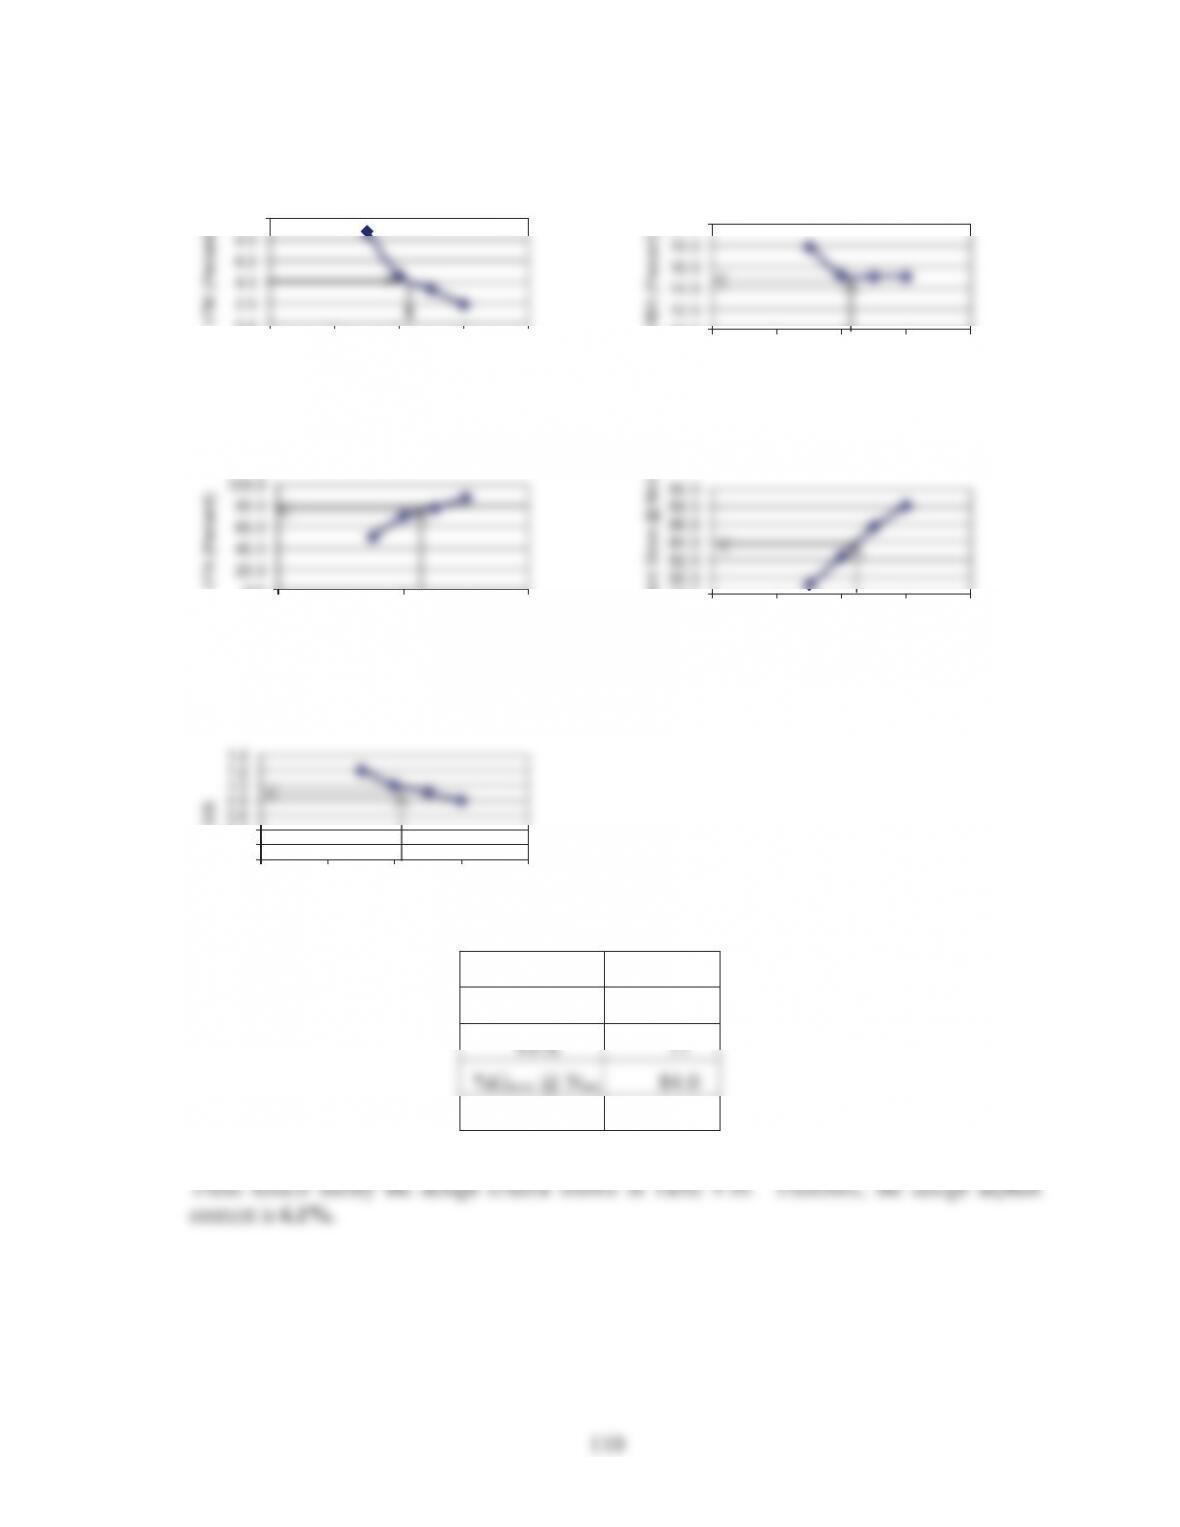
9.33. An Excel sheet can be used.
Blend
Data
1
2
3
Gmb
2.457
2.441
2.477
Gmm
2.598
2.558
2.664
Gb
1.025
1.025
1.025
Pb
5.9
5.7
6.2
Ps
94.1
94.3
93.8
Pd
4.5
4.5
4.5
Gsb
2.692
2.688
2.665
hini
125
131
125
Hdes
115
118
115
Volumetric Analysis
Computed
Equation
Criteria
Gse
9.4
2.875
2.812
2.979
VTM
9.8
5.4
4.6
7.0
VMA
9.9
14.1
14.4
12.8
VFA
9.10
61.7
68.1
45.3
%Gmm,Nini
9.11
87.0
86.0
85.5
0.89d
Pba
9.12
2.42
1.68
4.05
Pbe
9.13
3.62
4.12
2.4
D/b
9.14
1.2
1.1
1.9
Adjusted Values
Pb,est
9.15
6.5
5.9
7.4
VMAest
9.16
13.8
14.3
12.2
t
13
VFAest
9.17
71.0
72.0
67.2
65-75
Gmm, Nini, est
9.18
88.4
86.6
88.5
Pbe,est
9.19
4.2
4.3
3.6
D/Best
9.20
1.1
1.0
1.3
0.6-1.2
Select aggregate blend 2.
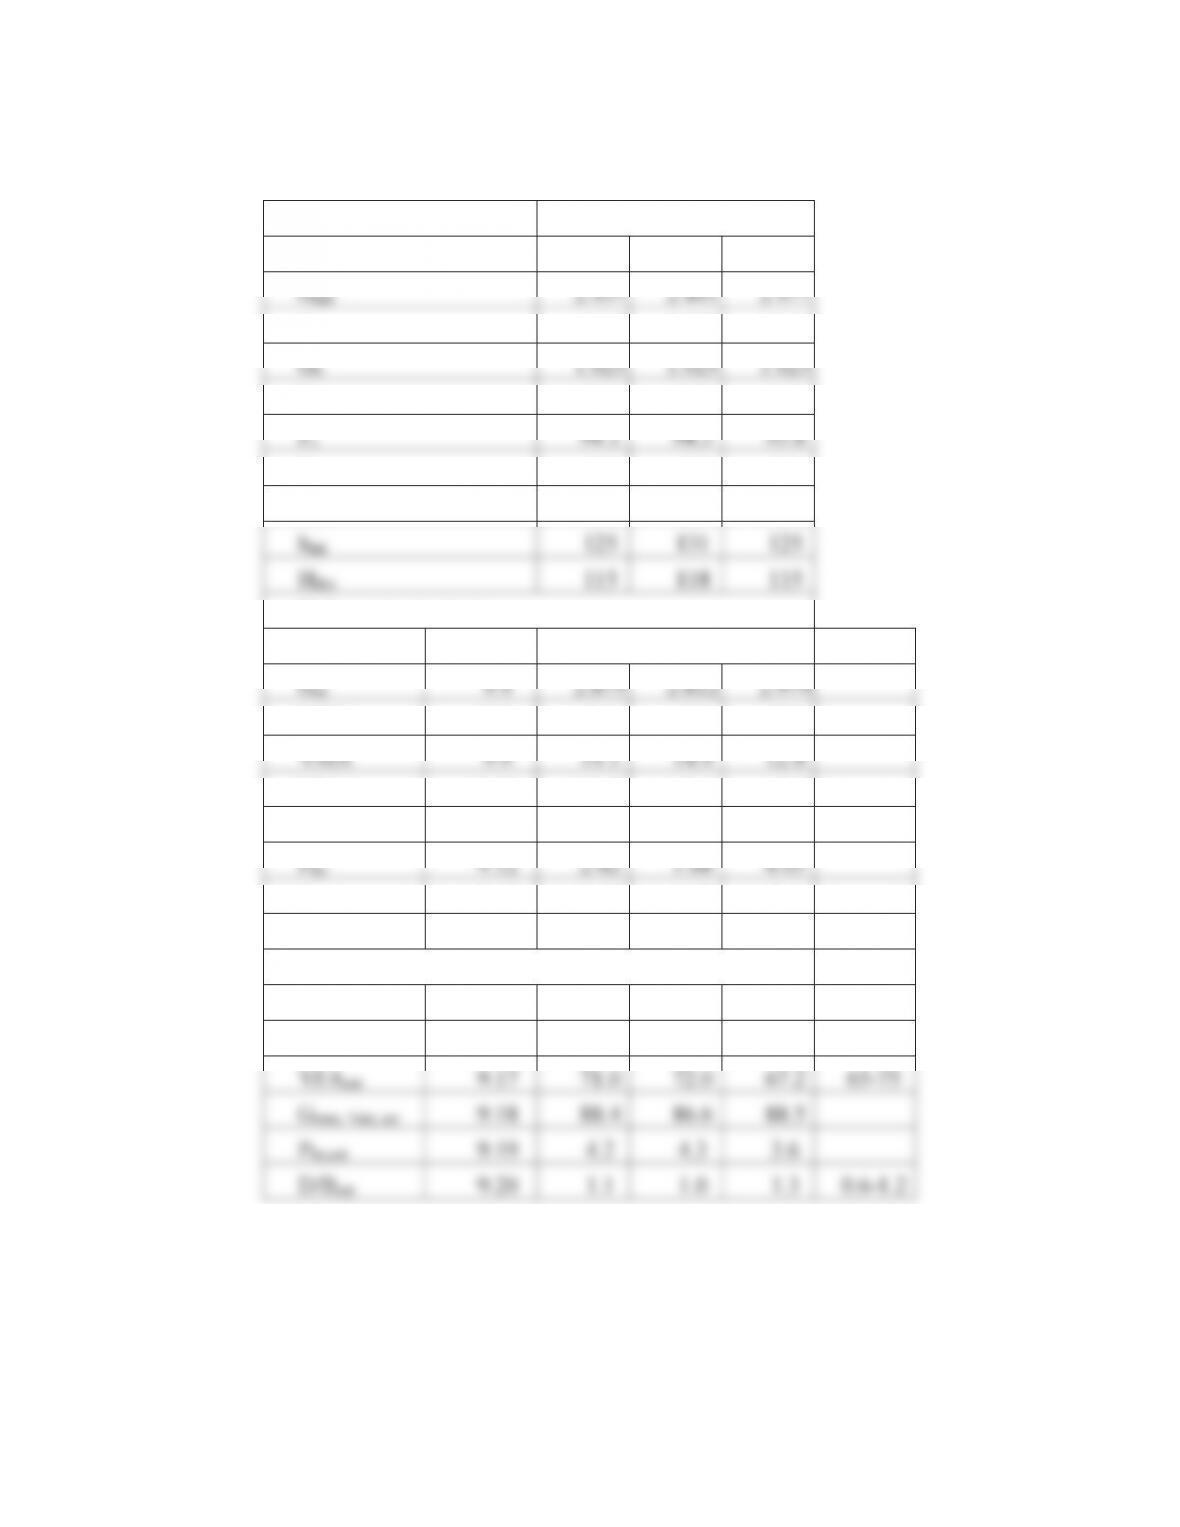
112
Design Binder Content
Data
Binder content
5.4
5.9
6.4
6.9
Gmb
2.351
2.441
2.455
2.469
Gmm
2.570
2.558
2.530
2.510
Gb
1.025
1.025
1.025
1.025
Ps
94.6
94.1
93.6
93.1
Pd
4.5
4.5
4.5
4.5
Gsb
2.688
2.688
2.688
2.688
hini
125
131
126
130
hdes
115
118
114
112
Volumetric Analysis
Computed
Equation
Gse
9.4
2.812
2.812
2.812
2.812
VTM
9.8
8.5
4.6
3.0
1.6
VMA
9.9
17.3
14.5
14.5
14.5
VFA
9.10
50.9
68.3
79.3
89.0
%Gmm,Nini
9.11
84.2
86.0
87.8
84.7
Pba
9.12
1.68
1.68
1.68
1.68
Pbe
9.13
3.81
4.32
4.83
5.34
D/B
9.14
1.2
1.0
0.9
0.8
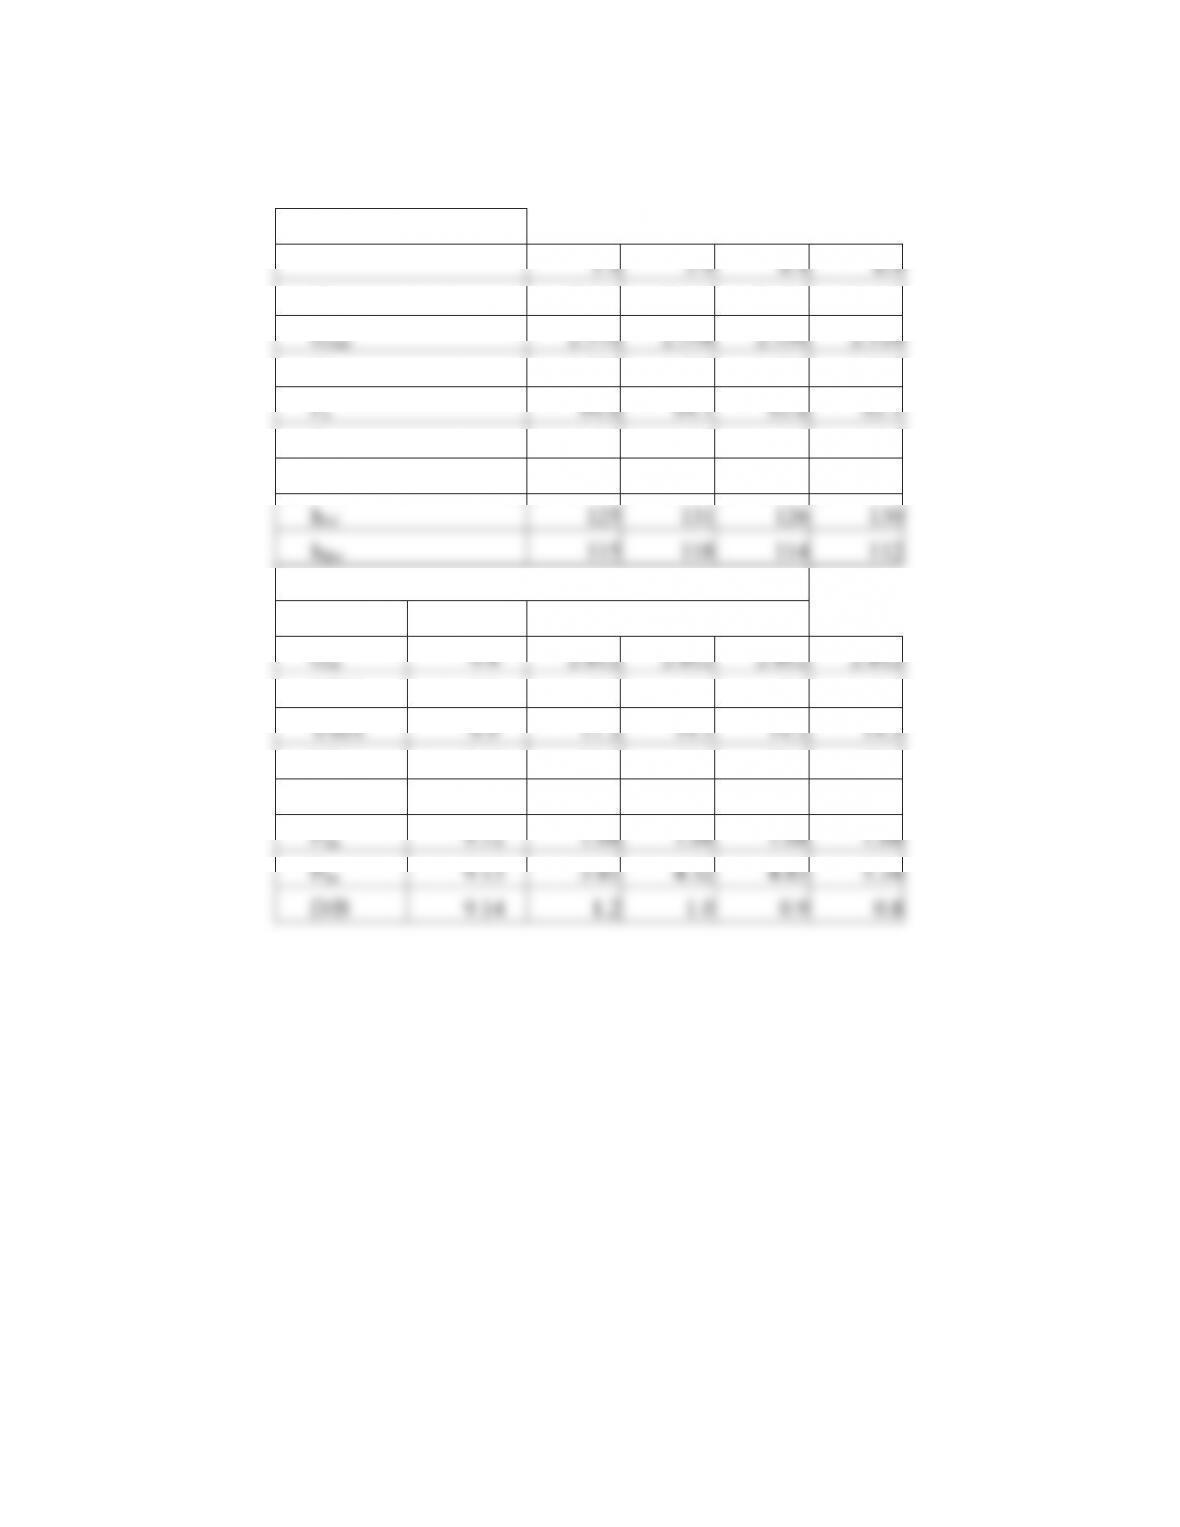
113
Pb
6.0%
VMA
14.2
VFA
70
%Gmm,Nini
86.4
D/B
0.9
These results satisfy the design criteria shown in Table 9.10. Therefore, the design asphalt
content is
6.0%.
970 3HUFHQW
3HUFHQW %LQGHU
90$3HUFHQW
3HUFHQW %LQGHU
3HUFHQW%LQGHU
3HUFHQW *PP#1LQL
3HUFHQW %LQGHU
3HUFHQW%LQGHU
114
9.34. See Section 9.9.5.
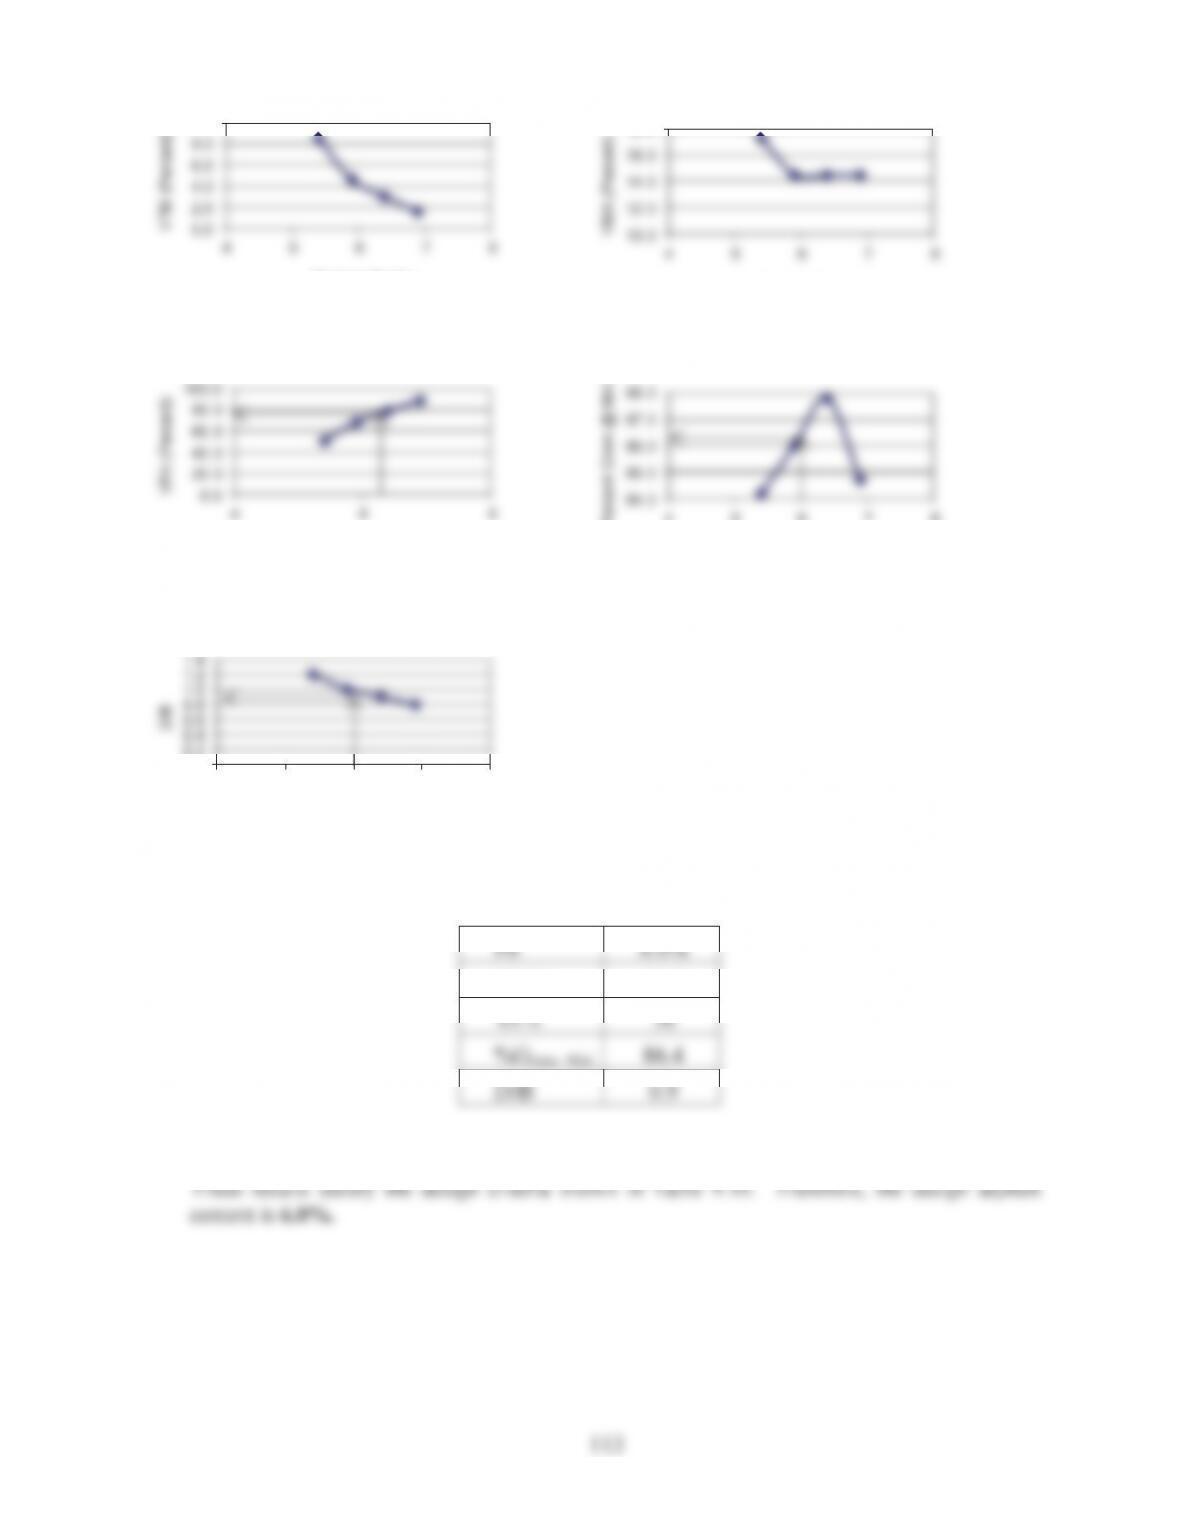
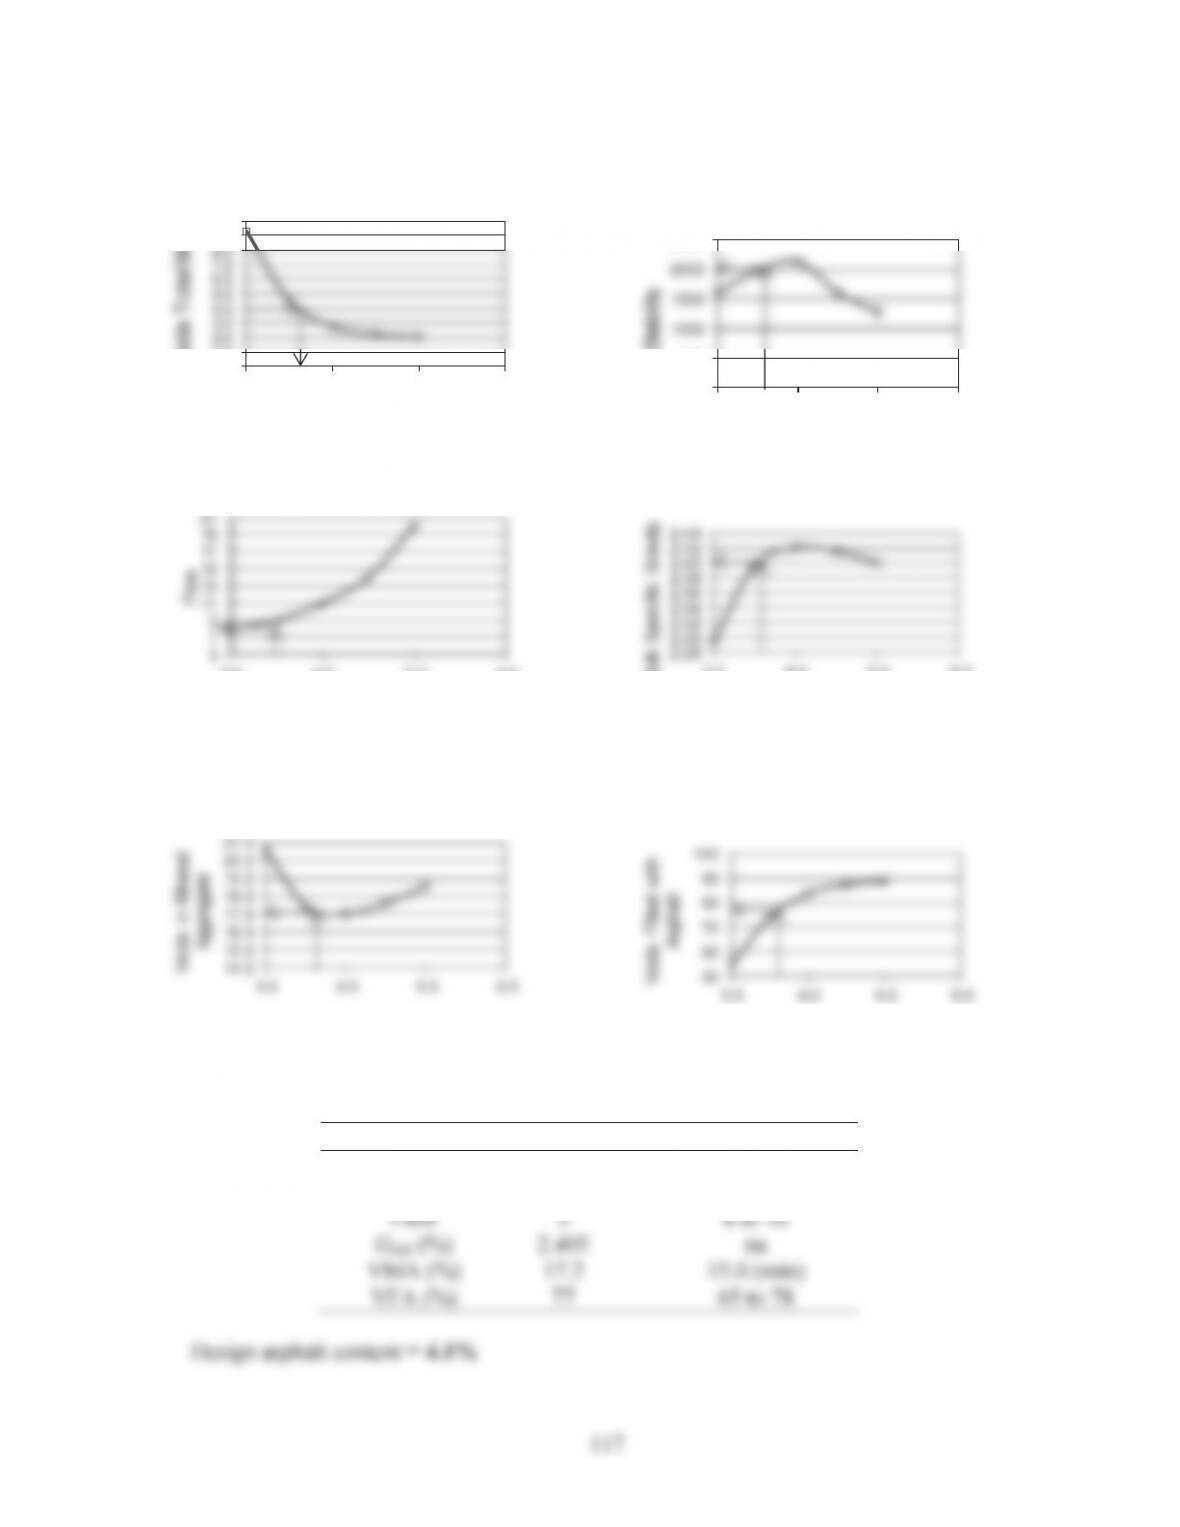
9.35.
P
b
(%)
G
mb
(%)
Stability, N
Flow, 0.25 mm
Gmm (%)
Gse (%)
VTM (%)
VMA (%)
VFA (%)
4.0
2.303
7076
9
2.509
8.2
18.0
54.4
4.5
2.386
8411
10
2.489
4.1
15.5
73.2
5.0
2.412
7565
12
2.470
2.67
7
2.3
15.0
84.4
5.5
2.419
5963
15
2.451
1.3
15.2
91.4
6.0
2.421
4183
22
2.432
0.5
15.6
97.0
115
Determine the asphalt content that corresponds to 4% air voids and check with Marshall
design criteria shown in Tables 9.14 and 9.15.
From data
Criteria
Pb@ 4%
4.5
Stability (kN)
8.4
5.34 (min)
Flow, (0.25 mm)
9
8 to 16
Gmb (%)
2.39
na
VMA (%)
15.6
13.0 (min)
VFA (%)
73
65 to 78
Design asphalt content = 4.5%
%XON 6SHFLILF *UDYLW\
3HUFHQW $VSKDOW
3HUFHQW$VSKDOW
)ORZ PP
3HUFHQW $VSKDOW
9RLGVLQ7RWDO0L[
3HUFHQW$VSKDOW
9RLGV LQ0LQHUDO
$JJUHJDWH
3HUFHQW $VSKDOW
9RLGV )LOOHG ZLWK
$VSKDOW
3HUFHQW $VSKDOW
116
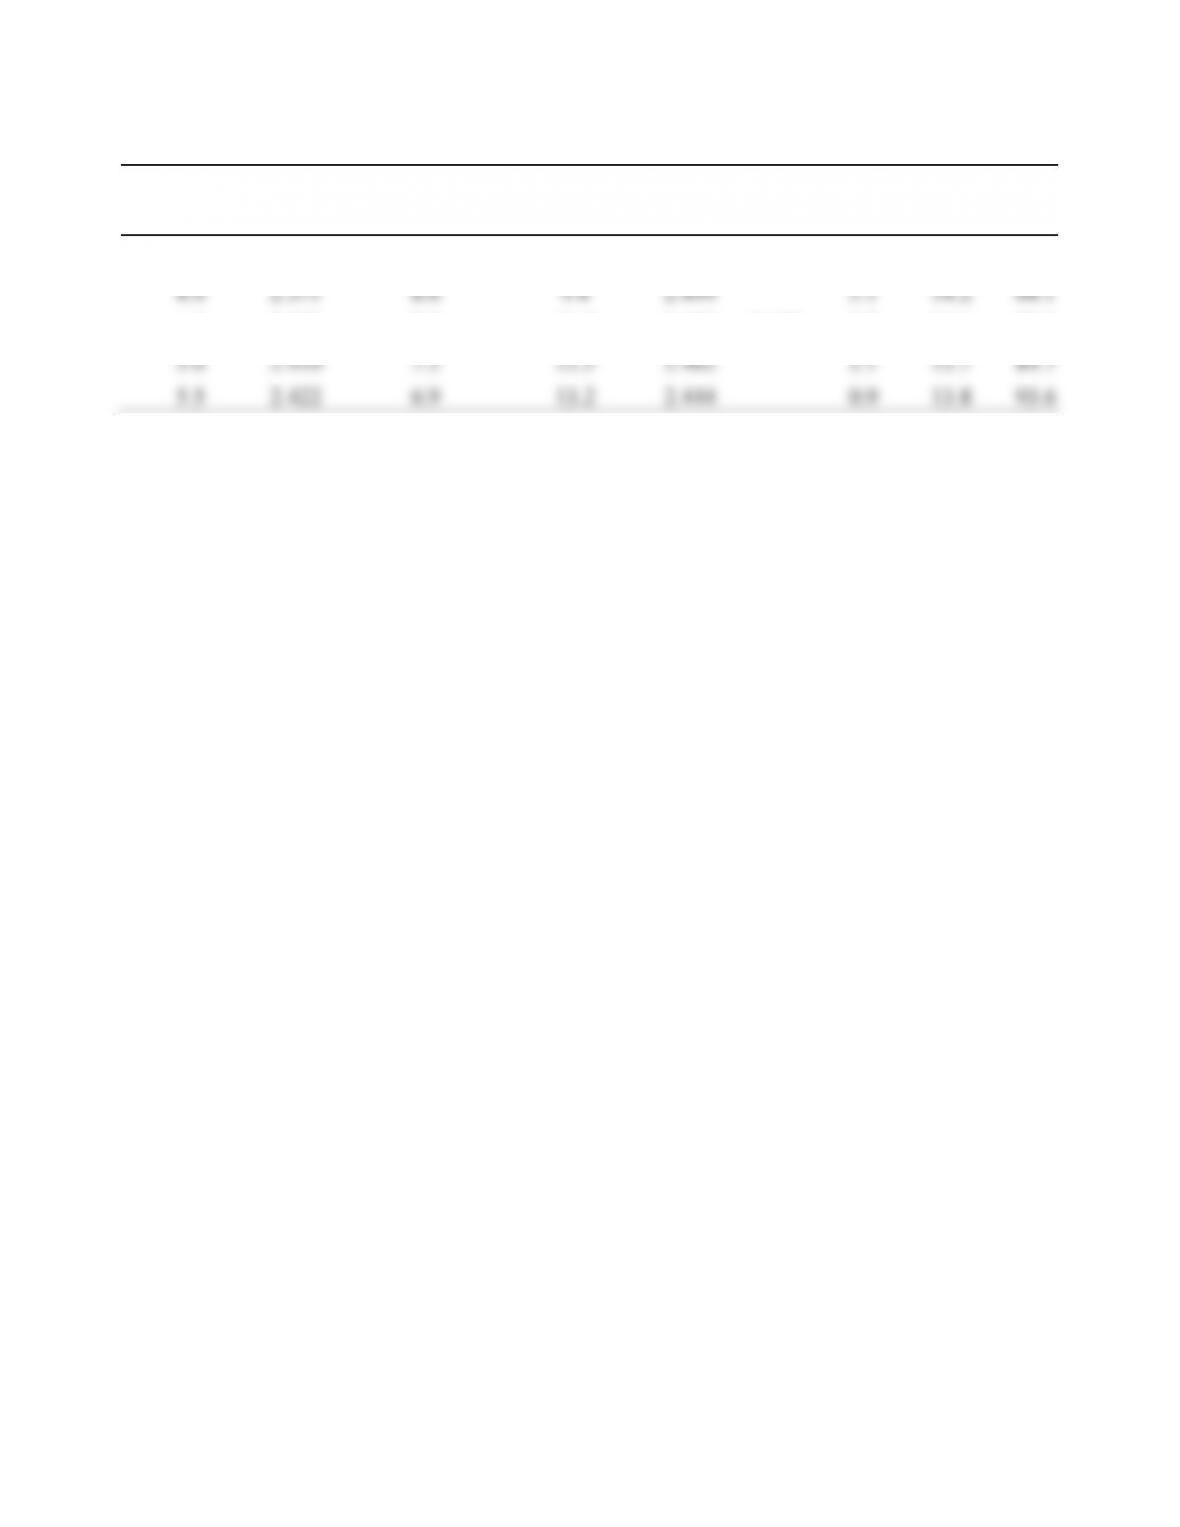
9.36.
P
b
(%)
Gmb
(%)
Stability
(lb)
Flow
G
mm
(%)
G
se
(%)
VTM
(%)
VMA
(%)
VFA
(%)
3.5
2.294
1600
8
2.529
9.3
20.5
54.7
4.0
2.396
1980
9
2.510
4.5
17.4
74.0
4.5
2.421
2130
11
2.490
2.678
2.8
17.0
83.7
5.0
2.416
1600
14
2.471
2.2
17.6
87.4
5.5
2.401
1280
20
2.452
2.1
18.6
88.8
117
Determine the asphalt content that corresponds to 4% air voids and check with Marshall
design criteria shown in Tables 9.14 and 9.15.
From data
Criteria
Pb@ 4%
4.1
Stability (lb)
2100
1200 (min)
Flow
9
8 to 16
Gmb (%)
2.405
na
VMA (%)
17.2
15.0 (min)
VFA (%)
77
65 to 78
Design asphalt content = 4.1%
%XON 6SHFLILF *UDYLW\
3HUFHQW $VSKDOW
6WDELOLW\
Percent Asphalt
3HUFHQW $VSKDOW
9RLGV7RWDO0L[
3HUFHQW$VSKDOW
9RLGV LQ0LQHUDO
$JJUHJDWH
3HUFHQW $VSKDOW
9RLGV )LOOHG ZLWK
$VSKDOW
3HUFHQW $VSKDOW
118
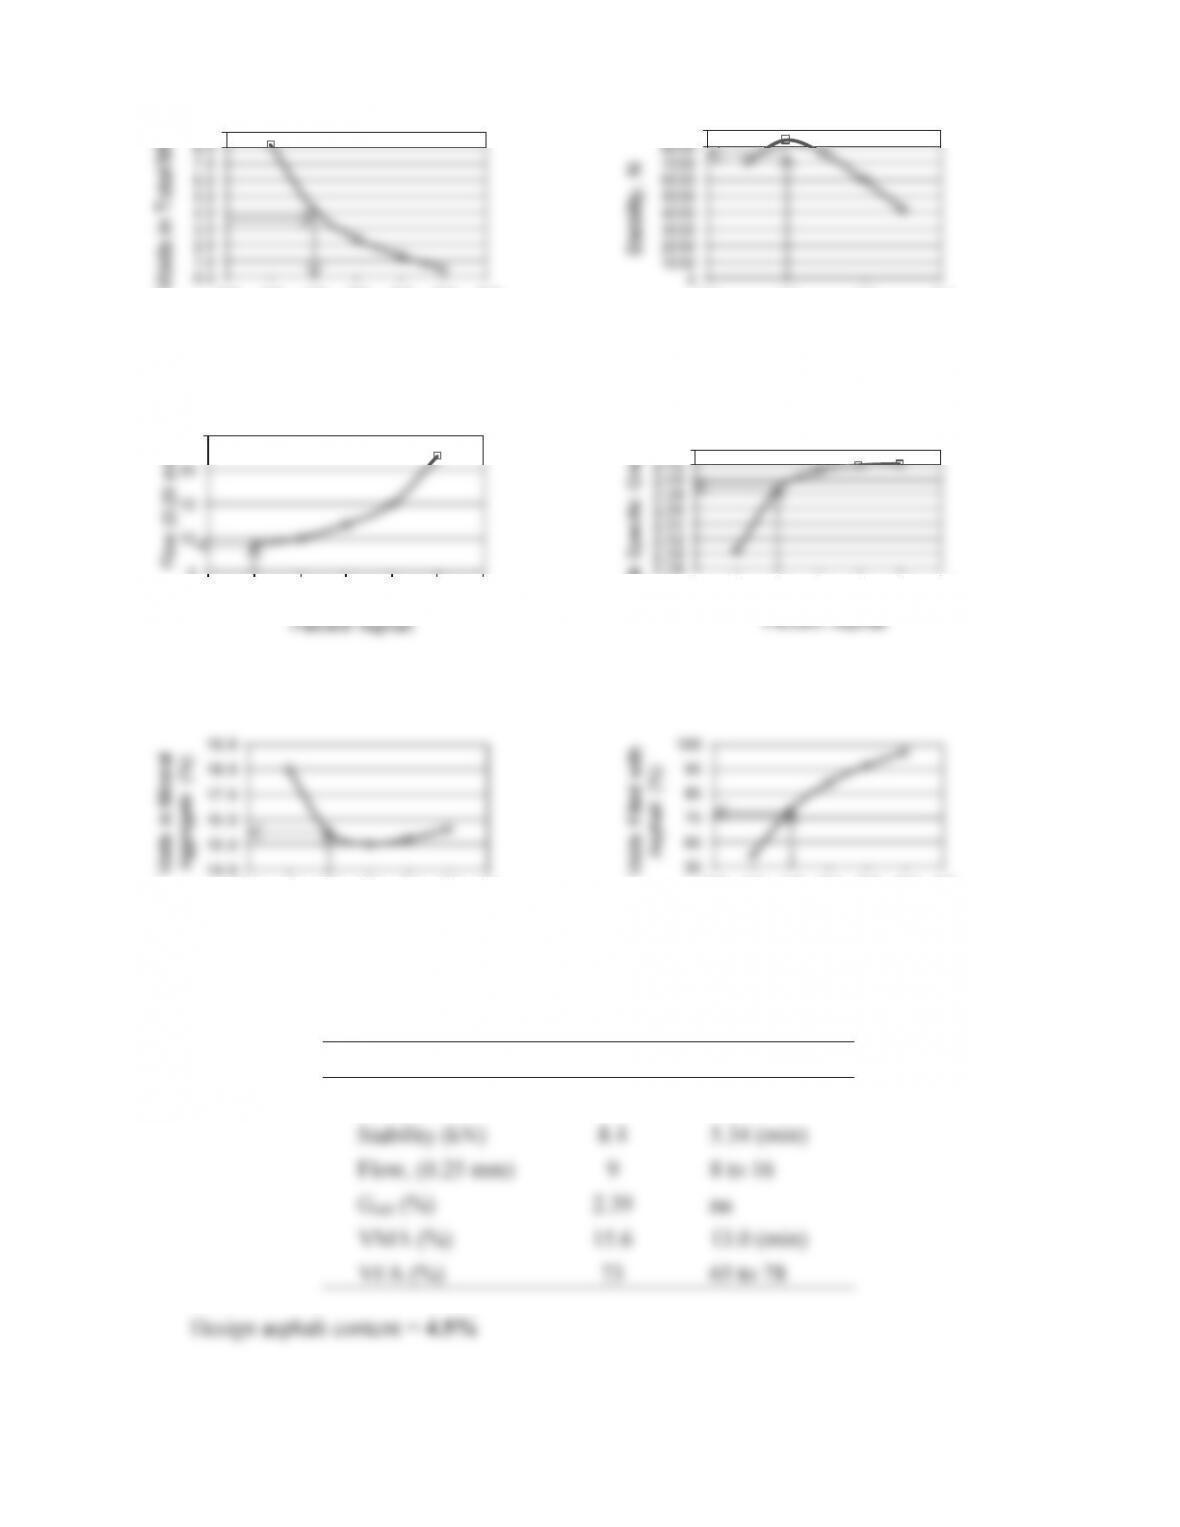
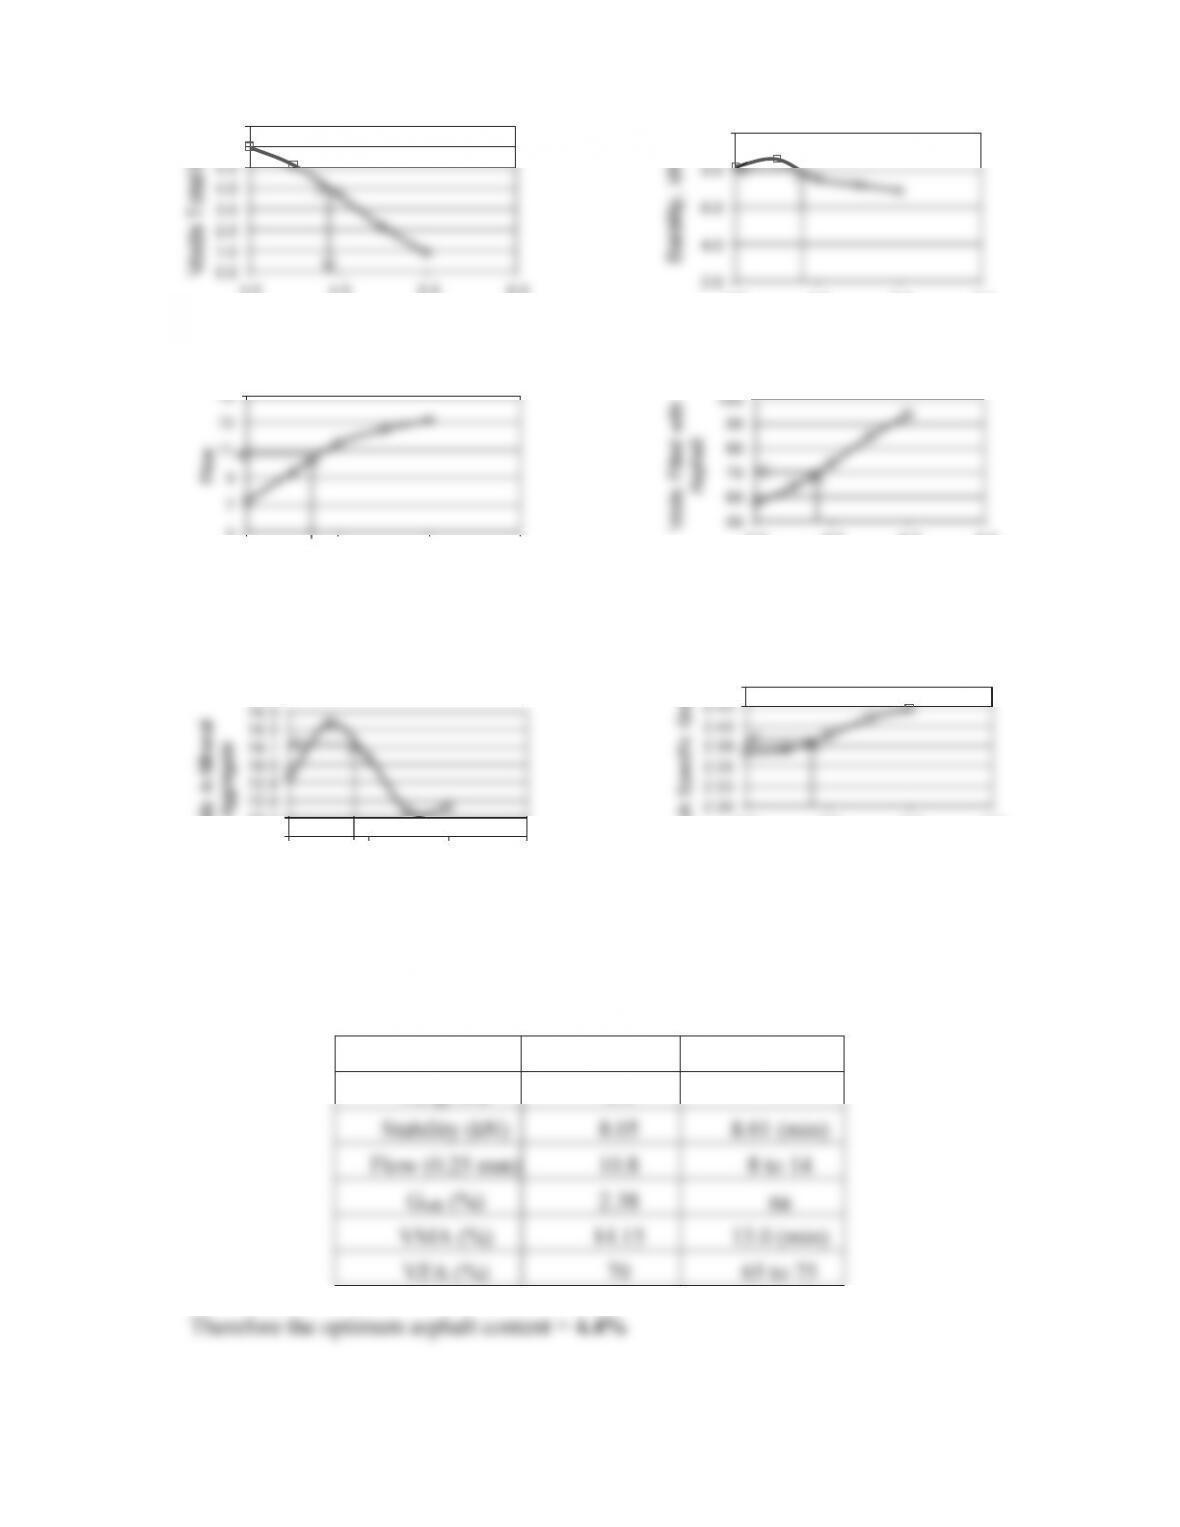
9.37.
Pb
(%)
Gmb
Stability
(kN)
Flow
(0.25 mm)
Gmm
(%)
Gse
(%)
VTM
(%)
VMA
(%)
VFA
(%)
3.5
2.367
8.2
7.3
2.517
6.0
13.9
57.1
4.0
2.371
8.6
9.4
2.499
5.1
14.2
64.1
4.5
2.389
7.5
11.5
2.480
2.658
3.7
14.0
73.9
5.0
2.410
7.2
12.5
2.462
2.1
13.7
84.7
5.5
2.422
6.9
13.2
2.444
0.9
13.8
93.6
119
Determine the asphalt content that corresponds to 4% air voids and check with Marshall
design criteria shown in Tables 9.14 and 9.15.
From data
Criteria
Pb@ 4%
4.4
Stability (kN)
8.05
8.01 (min)
Flow (0.25 mm)
10.8
8 to 14
Gmb (%)
2.38
na
VMA (%)
14.15
13.0 (min)
VFA (%)
70
65 to 75
Therefore the optimum asphalt content = 4.4%
%XON 6SHFLILF *UDYLW\
3HUFHQW $VSKDOW
3HUFHQW$VSKDOW
3HUFHQW $VSKDOW
9RLGV7RWDO0L[
3HUFHQW$VSKDOW
9RLGV LQ0LQHUDO
$JJUHJDWH
3HUFHQW $VSKDOW
9RLGV )LOOHG ZLWK
$VSKDOW
3HUFHQW $VSKDOW
120
9.38. See Section 9.9.6.
Thickness, mm
64
63
63
63
64
62
Force, N
11500
10500
10800
9000
9500
9200
Tensile strength, MPa
0.76
0.71
0.73
0.61
0.63
0.63
Average tensile strength,
MPa
0.73
0.62
TSR = 0.62/0.73 = 85%. Therefore, the mix passes.
9.41 See Section 9.12.
9.43. See Section 9.13.
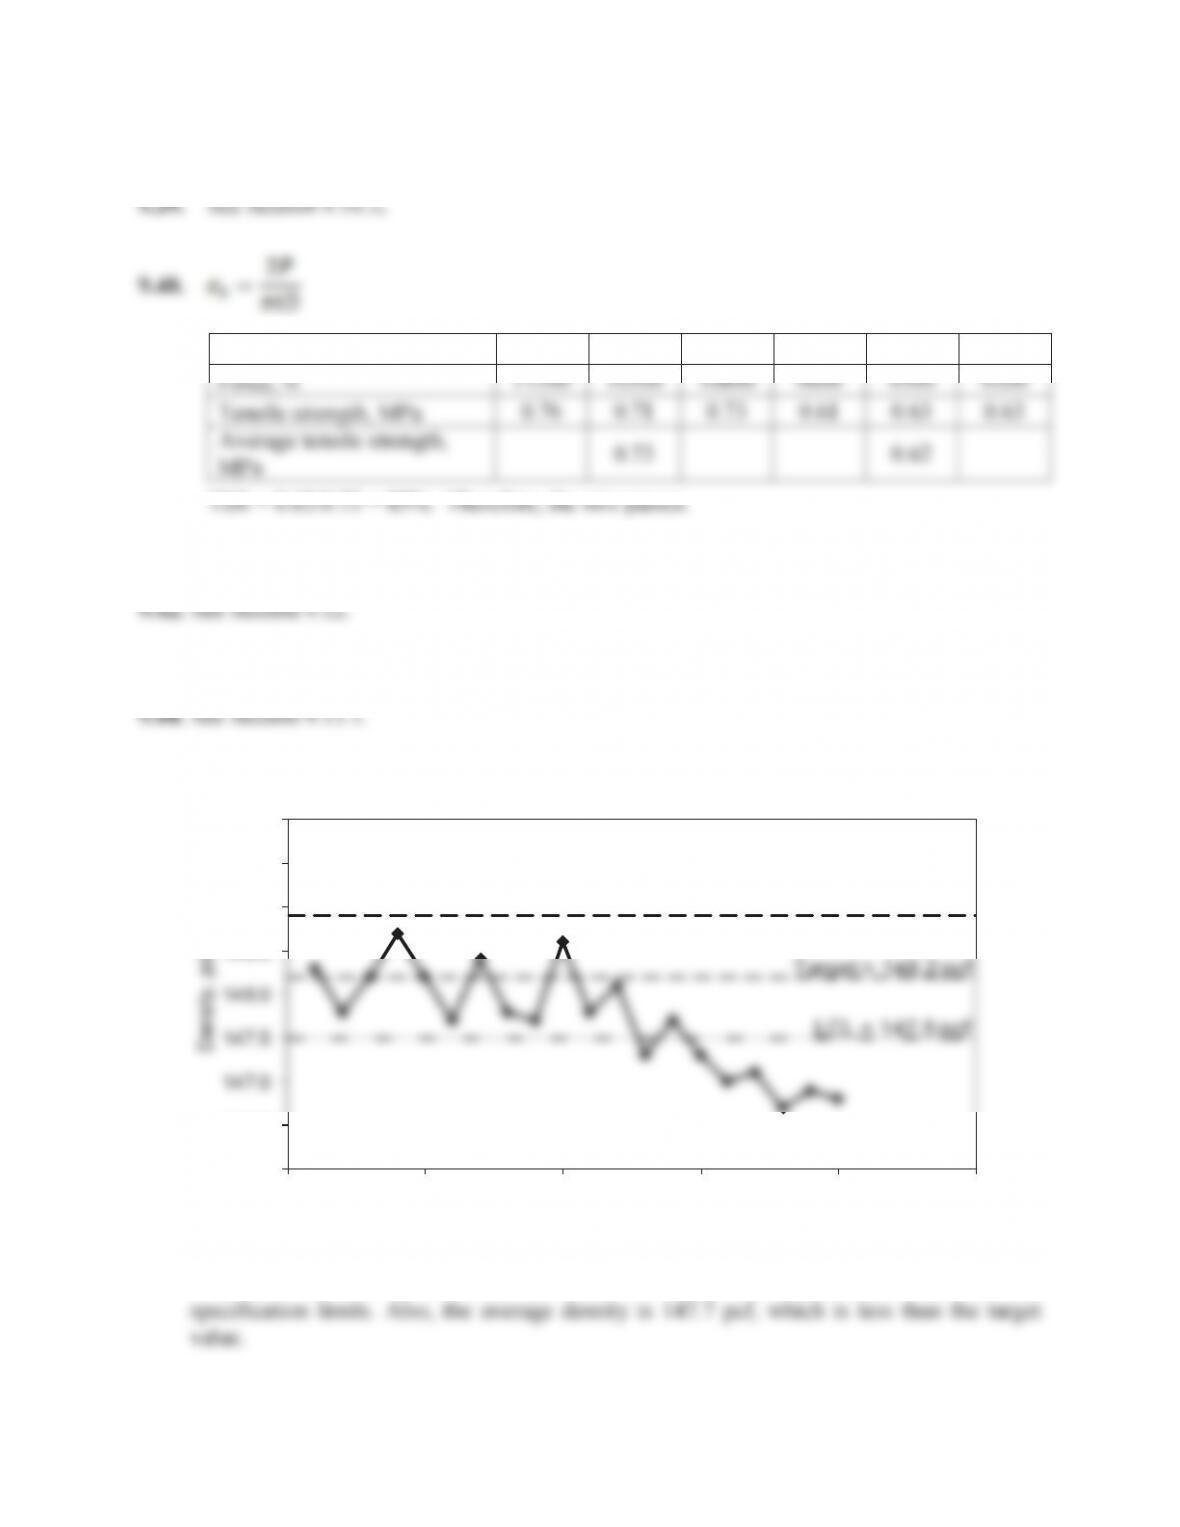
9.45.a. The control chart is shown below.
&RUH1R
/&/ SFI
7DUJHW SFI
8&/ SFI
It is clear from the control chart that some of the cores have densities lower than the

121
b. The control chart shows that there is a decrease in density values for the cores and this
could be due to several factors such as problems with the paver, problems with the
rollers, etc.
9.47. See Section 9.13.3.