9-1
CHAPTER 9. HYPOTHESIS TESTING
CHAPTER 9. HYPOTHESIS TESTING ……………………………………………………………………………….1
9.1. Introduction ………………………………………………………………………………………………………………1
9.2. General Procedure ……………………………………………………………………………………………………..1
9.3. Hypothesis Tests of Means ………………………………………………………………………………………….3
The following table provides a summary of the problems with their appropriate sections:
Section Problems
9.1
9.1. Introduction
None
9.2. General Procedure
Problem 9-1.
H
o: (1) expressed in terms of the population, not sample
Problem 9-2.
A correlation coefficient between two variables of 0 indicates that there is no linear association
between the two variables. Thus it would be of interest to make a two-sided test of the hypotheses:
U
Problem 9-3.
Factors which influence the selection of level of significance are Type I error and Type II error.
Type I error is defined by rejecting Ho when in fact Ho is true. Type II error is defined as non-
rejecting Ho when in fact Ho is false. The probabilities of these two types of error have to be
Problem 9-4.
Problem 9-5.
Implications of a type I error: The model predicts that the levees would not contain the 800 cfs
flows even though the levees in reality would.
Problem 9-6.
Implications of a type I error: We reject the null hypothesis, when in fact it was true. So the steel
was not used in a project and an economic loss was incurred.
Problem 9-7.
(a) values of the test statistic that are unlikely to occur if the null hypothesis is true
Problem 9-8.
1. level of significance
9-3
9.3. Hypothesis Tests of Means
Problem 9-9.
The largest mean is 1.412, which has a S = 0.649. Assuming it is known that V = 1, the test
Problem 9-10.
793.0 x, 493.1 S, 5 n, 0
P
, 1
V
, 05.0
D
Problem 9-11.
Sample mean on row 2 column 7 of Table 8-3b = -0.027
Test whether or not significantly lower than 1.
Problem 9-12.
Since V = 1 is known, use z test.
n
V
9-4
Problem 9-13.
Therefore, reject Ho; the pollution level exceeds the allowable.
Problem 9-14.
The rejection probability is about 0.001235; therefore, the sample is unlikely to have been drawn
from a population with a mean of 50.
Problem 9-15.
They have the same purpose: a test of a mean from a single sample. The Z test only requires
Problem 9-16.
9-5
Problem 9-17.
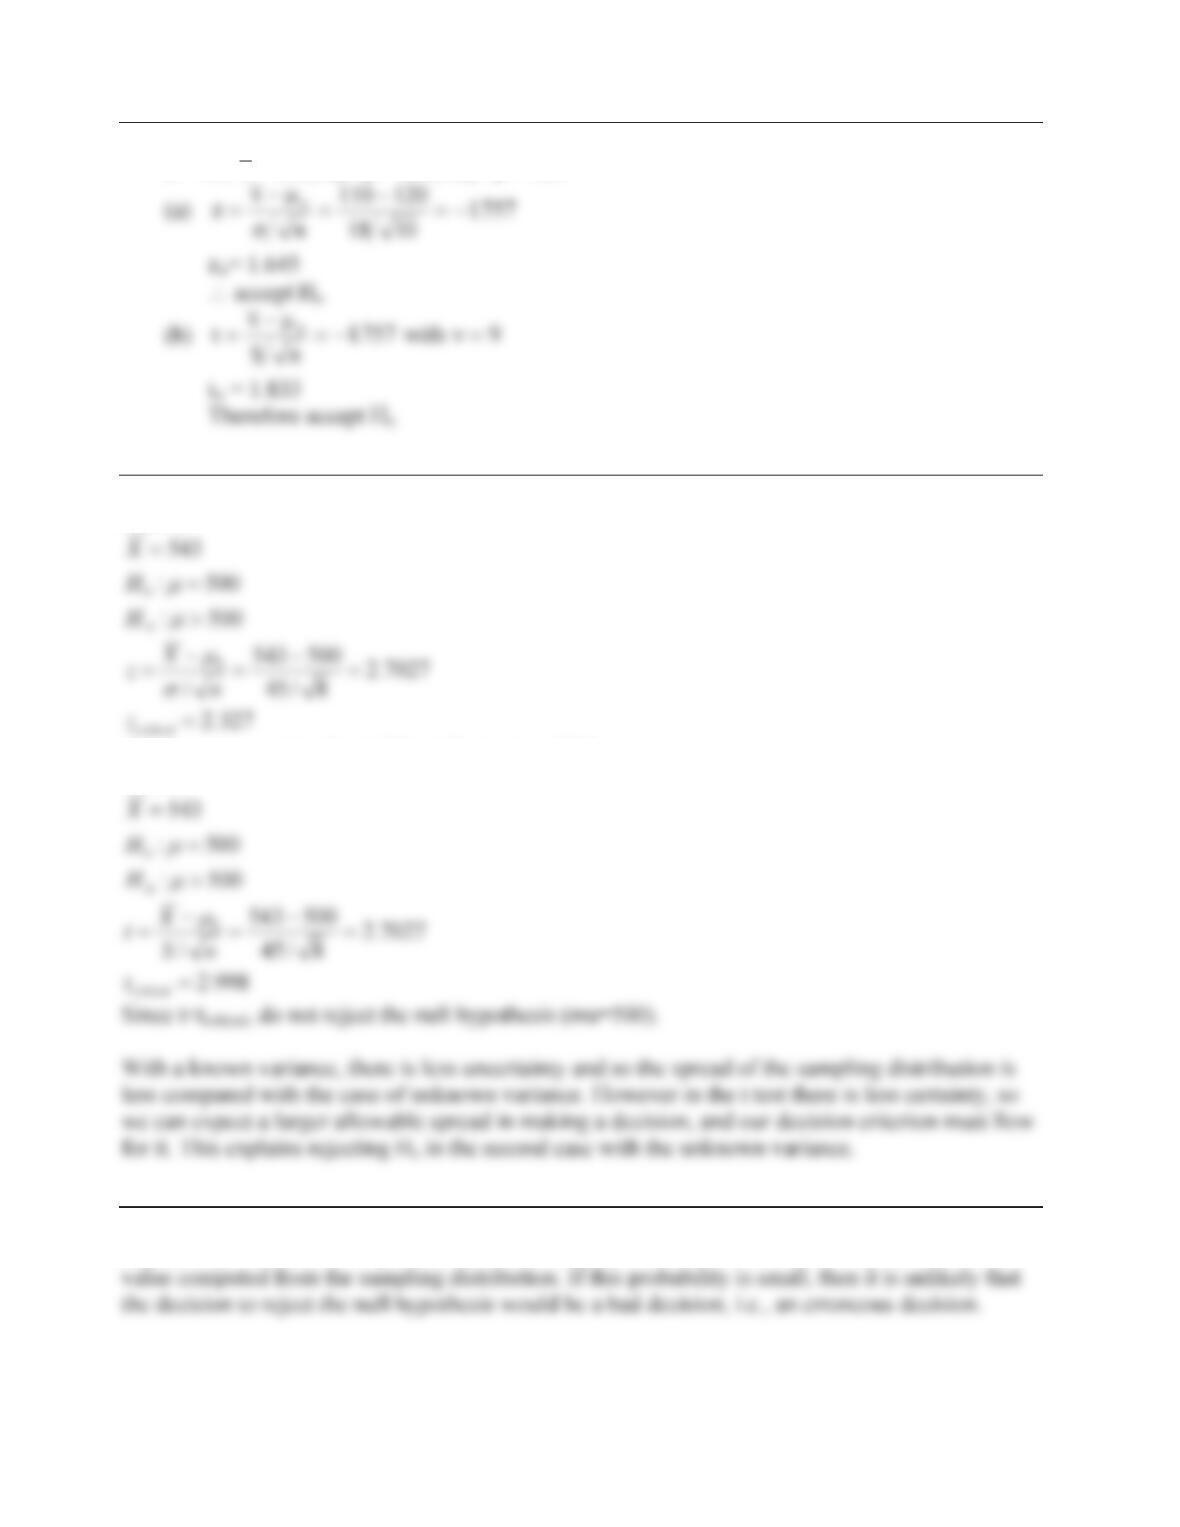
n = 10; x= 110; Ho: P = 120; HA: P > 120
Problem 9-18.
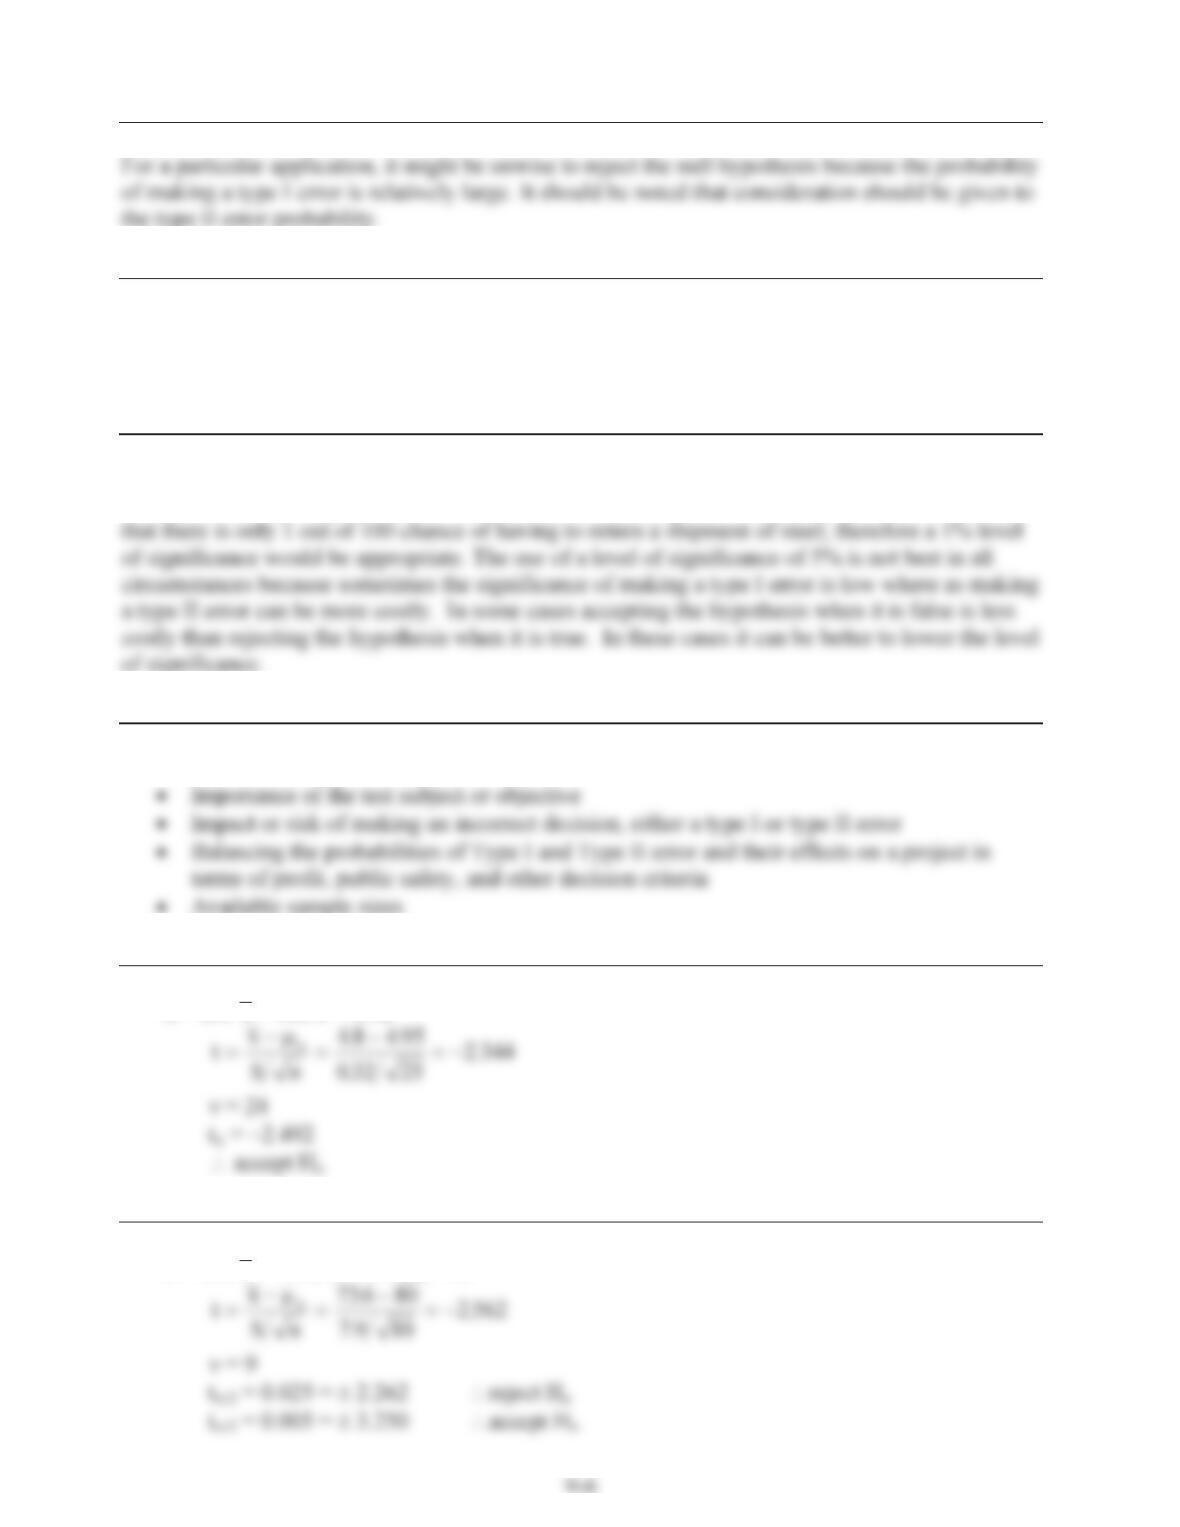
Part A:
Since z>zcritical, reject the null hypothesis (mu=500).
Part B:
Problem 9-19.
Rejection probability is the probability that a computed test statistic would be beyond the critical
Problem 9-20.
Problem 9-21.
For a small rejection probability, or p value, it seems safe to reject the null hypothesis as the
likelihood of making a type I error is small. It should be noted that consideration should be given
to the type II error probability.
Problem 9-22.
A 5% level of significance is not appropriate for all situations because in particular situations the
chance of making a type I error must be lowered. For example, a company might want to ensure
Problem 9-23.
The factors are:
Problem 9-24.
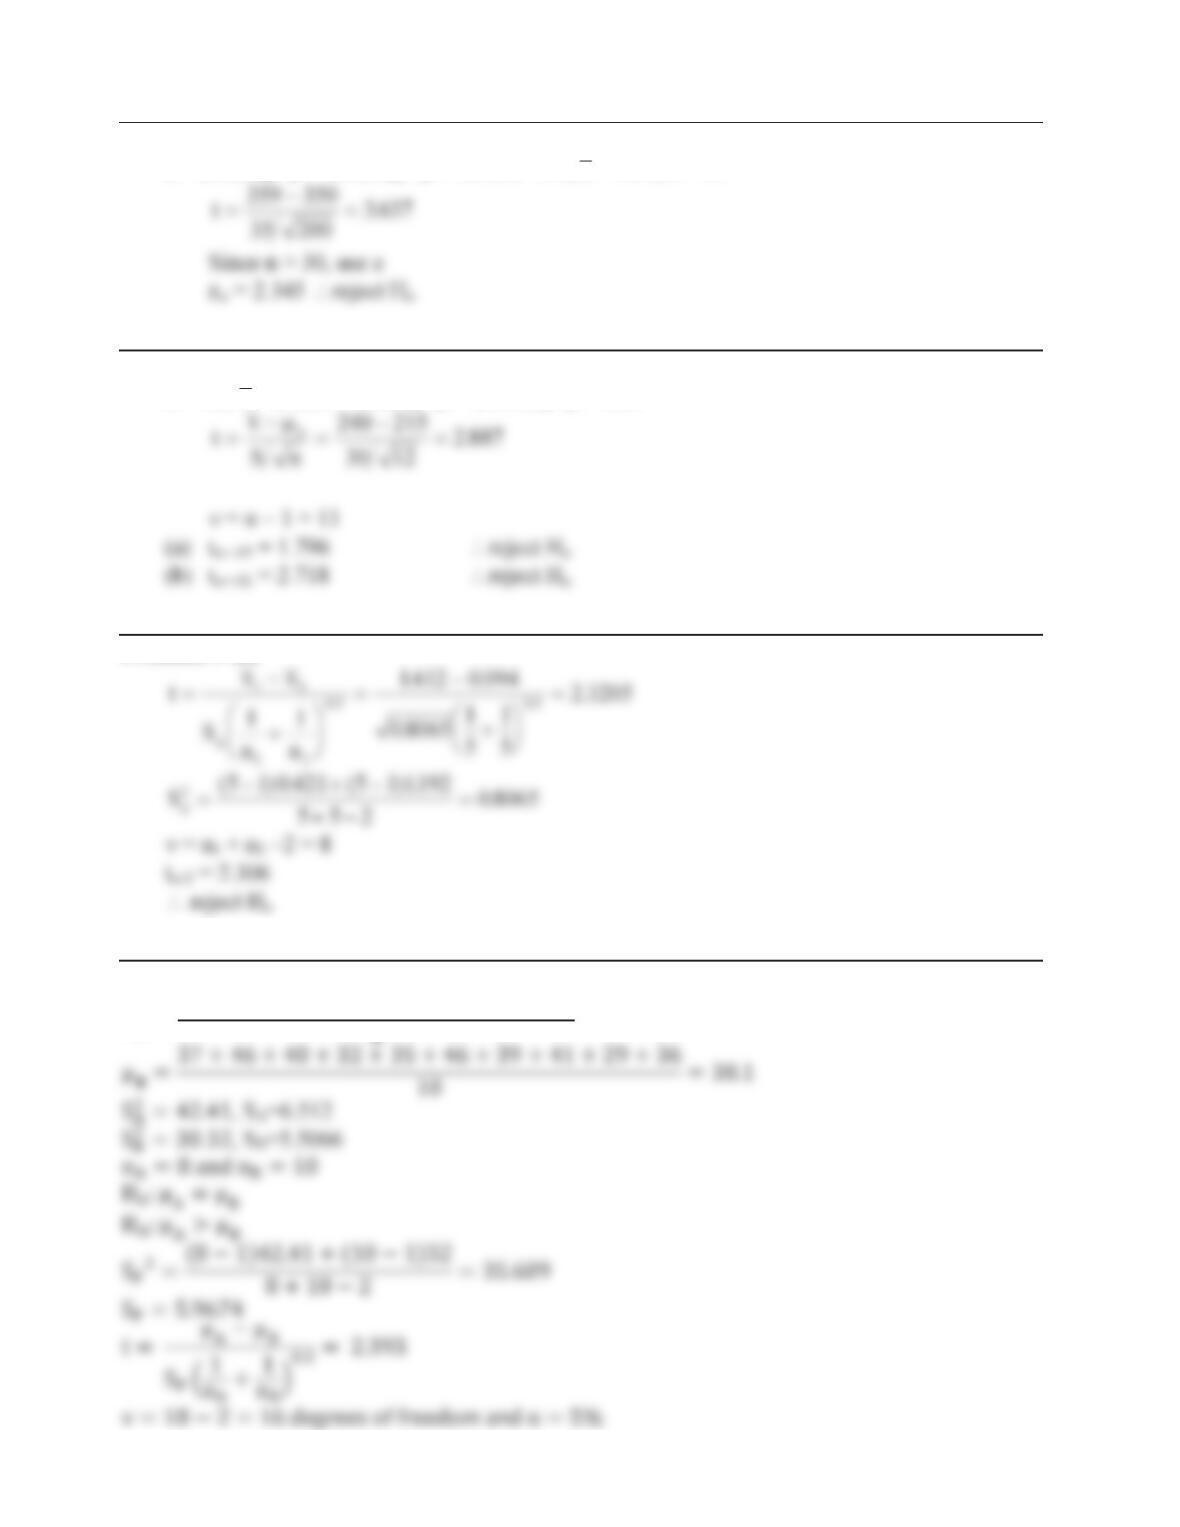
n = 25; x= 4.8; S = 0.32
Problem 9-25.
n = 10; x= 73.6; S = 7.9; Po = 80
9-7
Problem 9-26.
n = 200; Ho: P = 350; HA: P > 350; D= 1%; x = 359; S = 35
Problem 9-27.
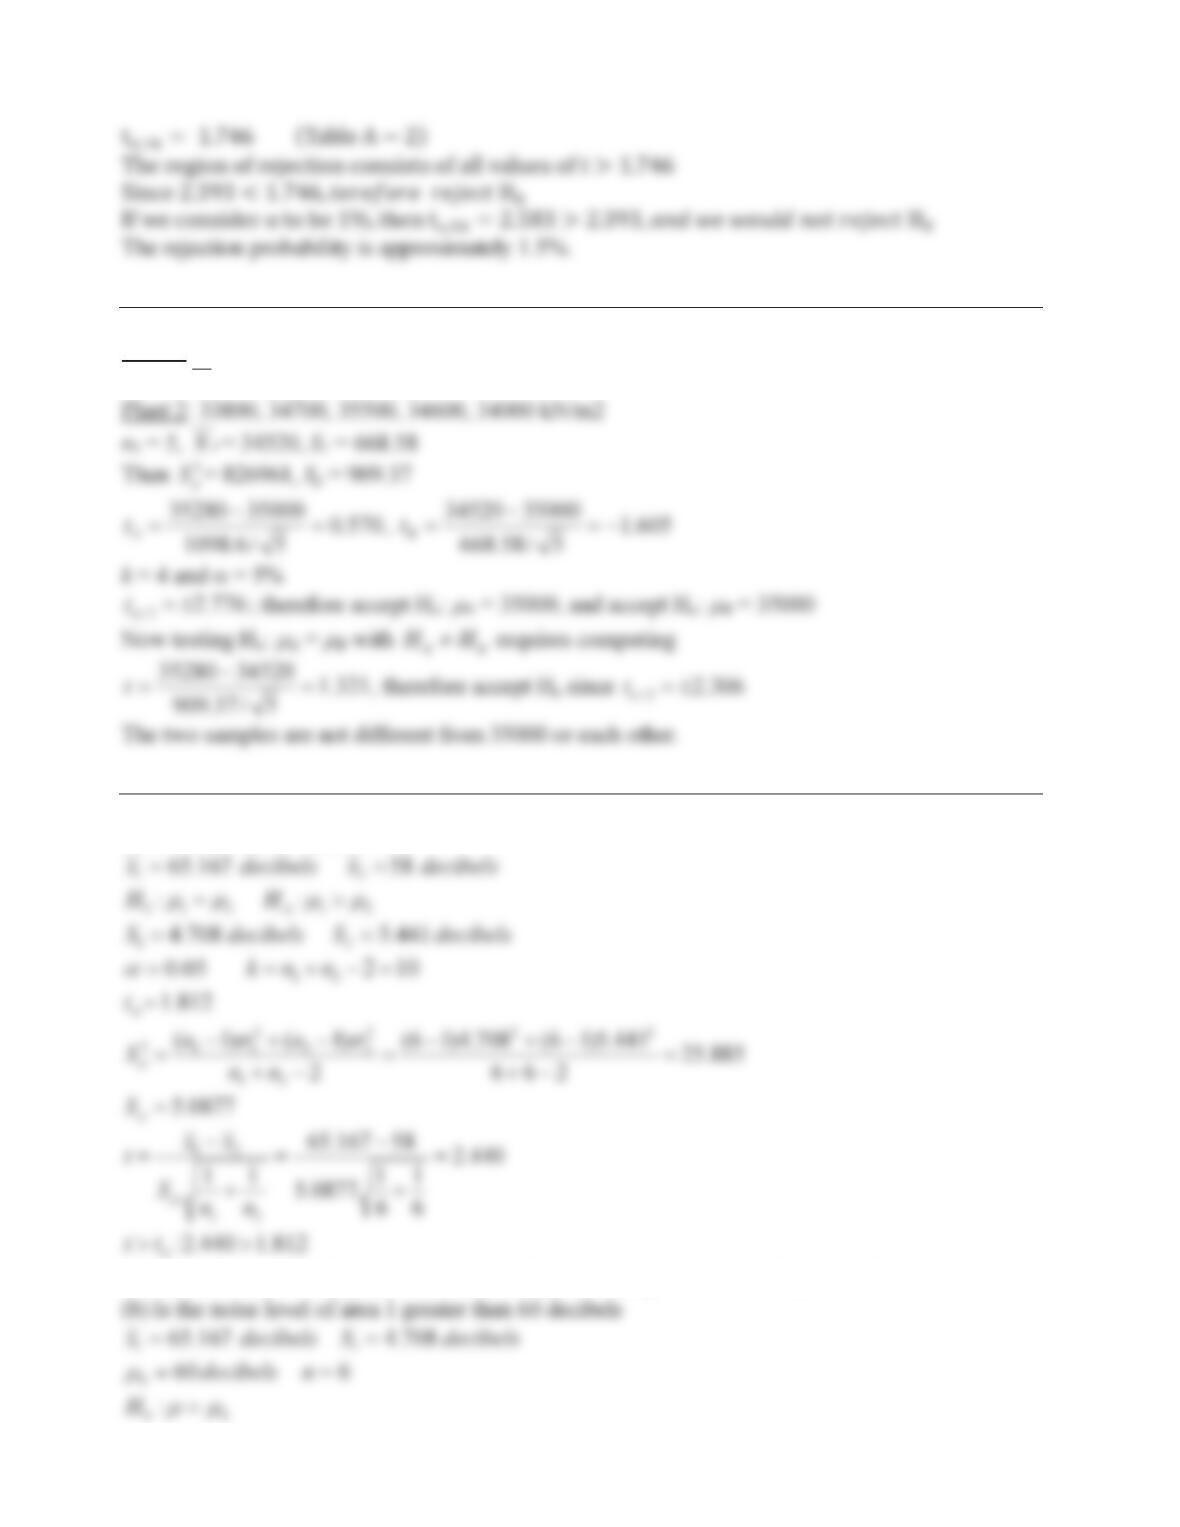
n = 12; x= 240; S = 30; Ho: P = 215; HA: P > 215
Problem 9-28.
Problem 9-29.
μൌͶͶͷ͵ͻͶʹͶͺͷͳ͵Ͷ͵
9-8
Problem 9-30.
Plant 1: 34700, 36800, 35200, 33900, 35800 kN/m2
n1 = 5, 1
X= 35280, S1 = 1098.6
Problem 9-31.
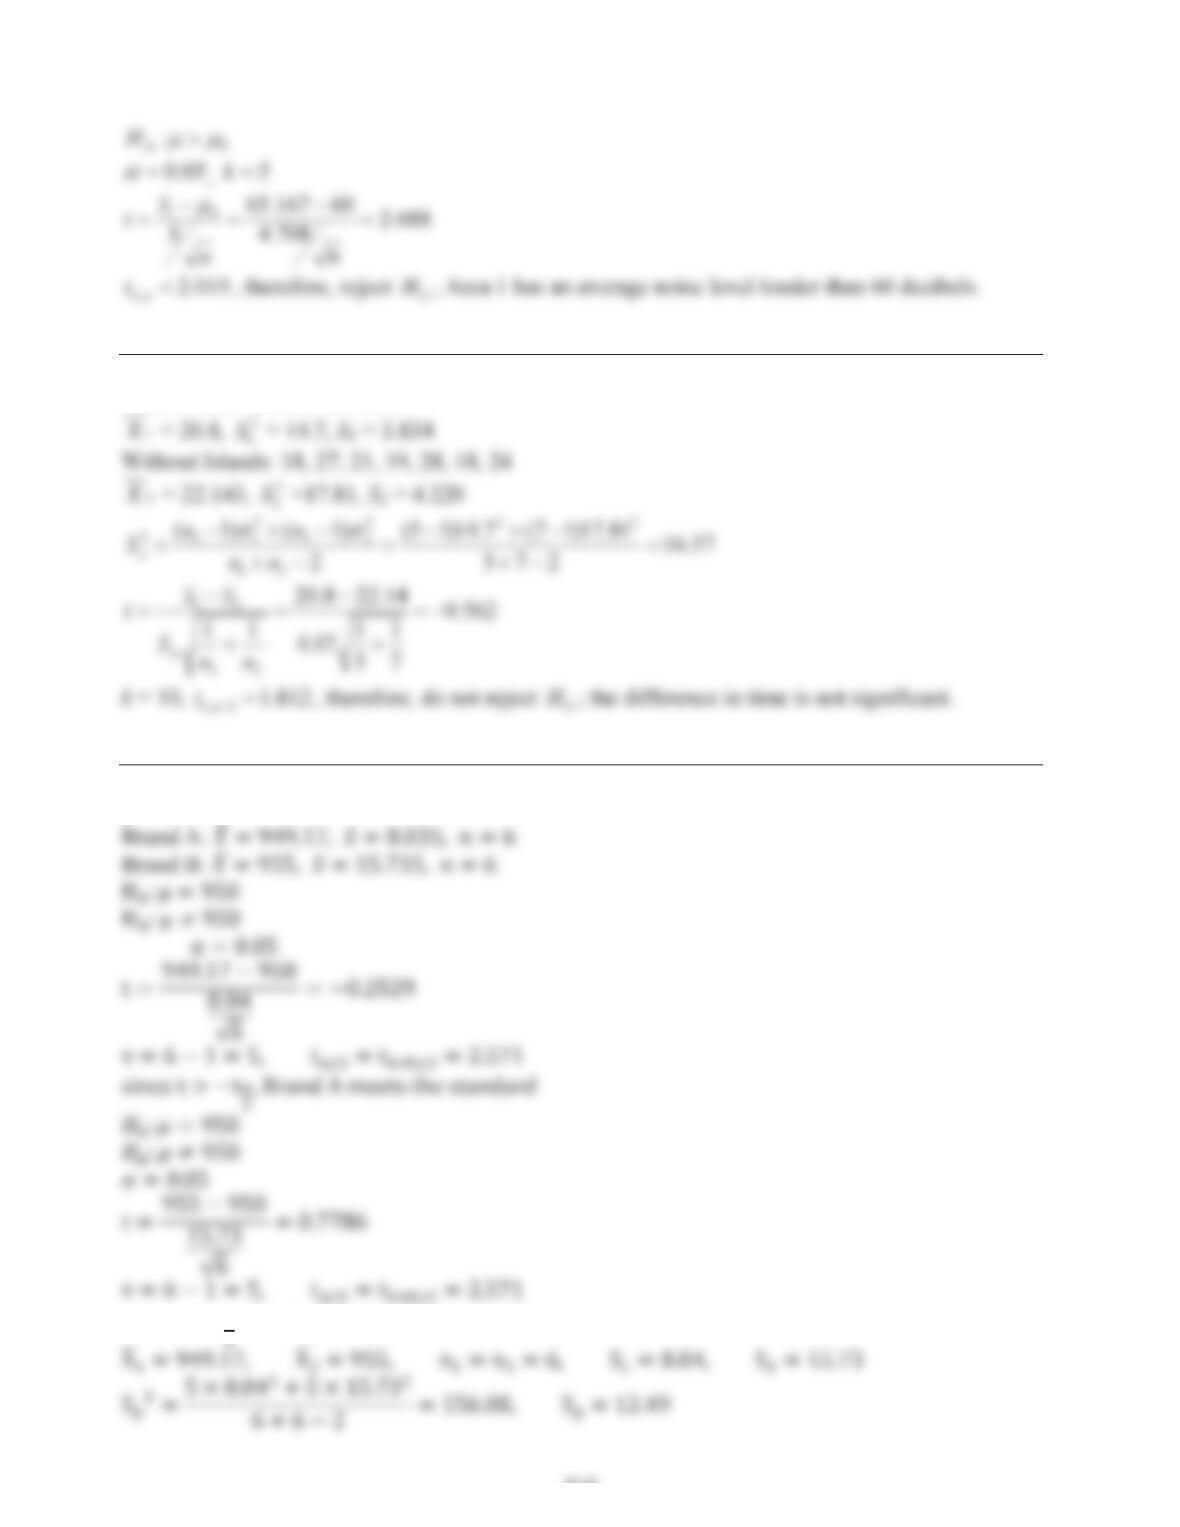
(a) Is Area 1 nosier than area 2?
Therefore, accept the A
H that Area 1 has a higher average noise level than Area 2.
9-9
Problem 9-32.
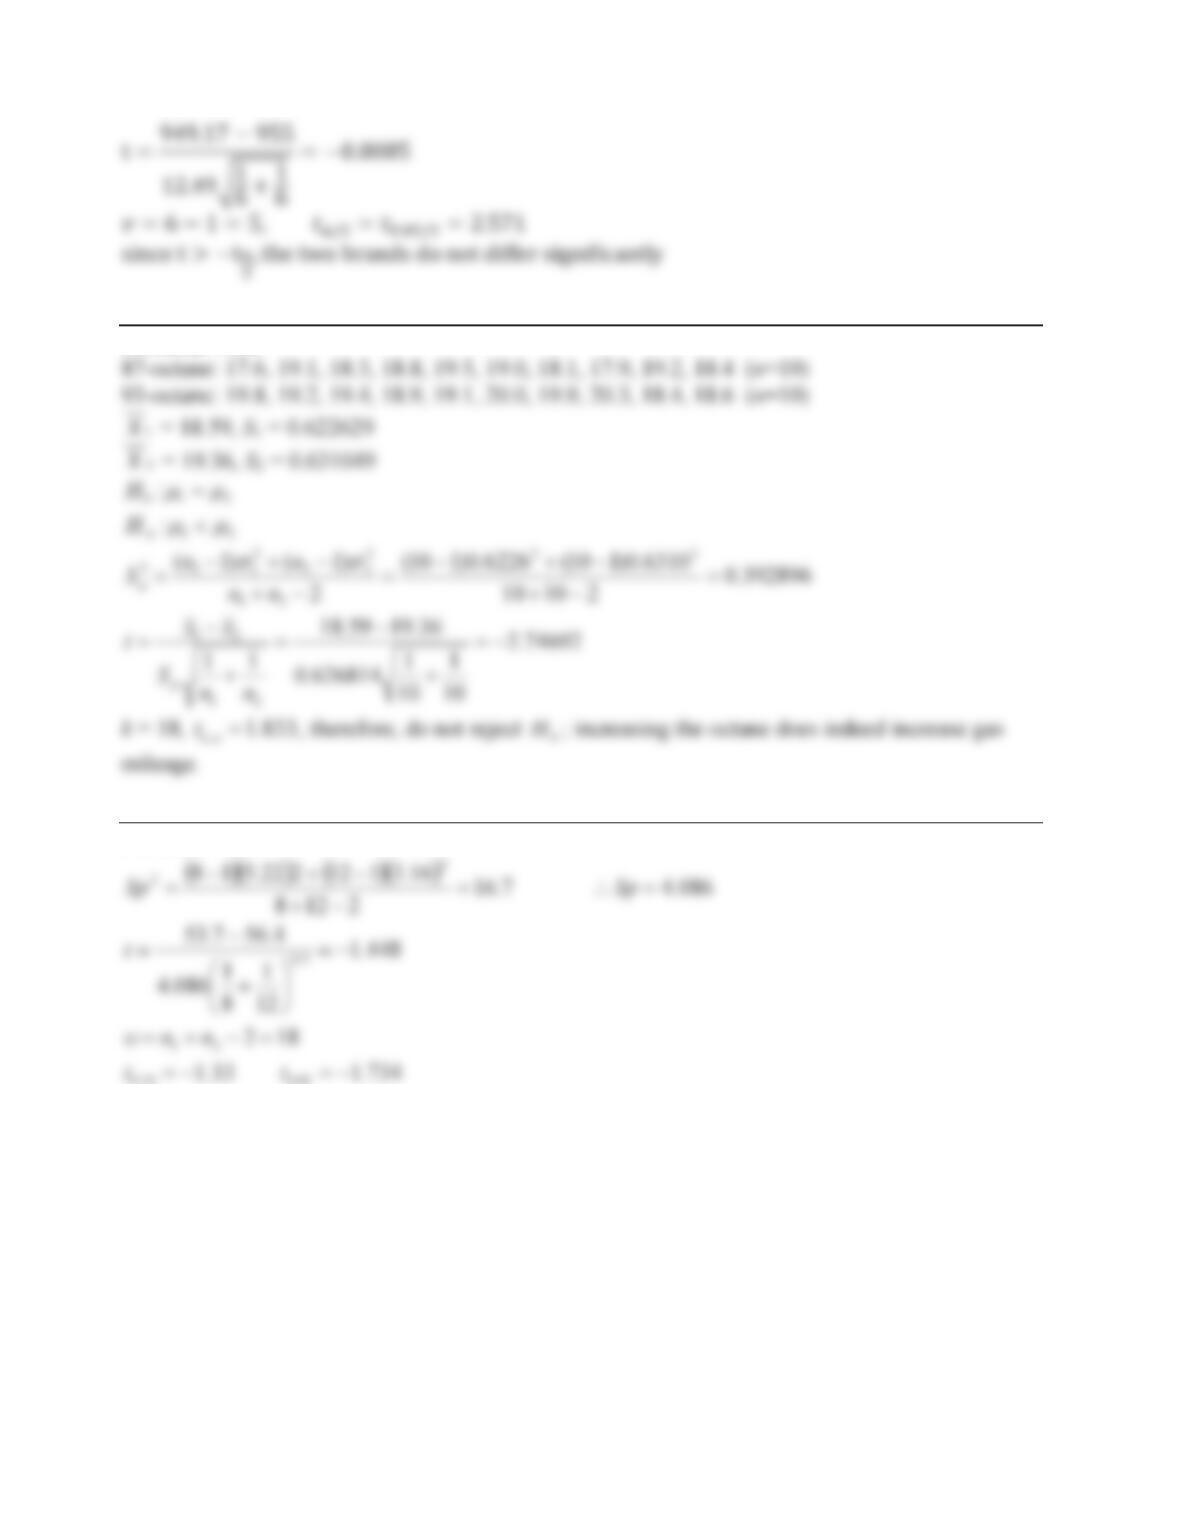
With Islands: 23, 29, 26, 16, 20
Problem 9-33.
ߤ ൌͻͷͲ
൏
9-10
Problem 9-34.
Problem 9-35.
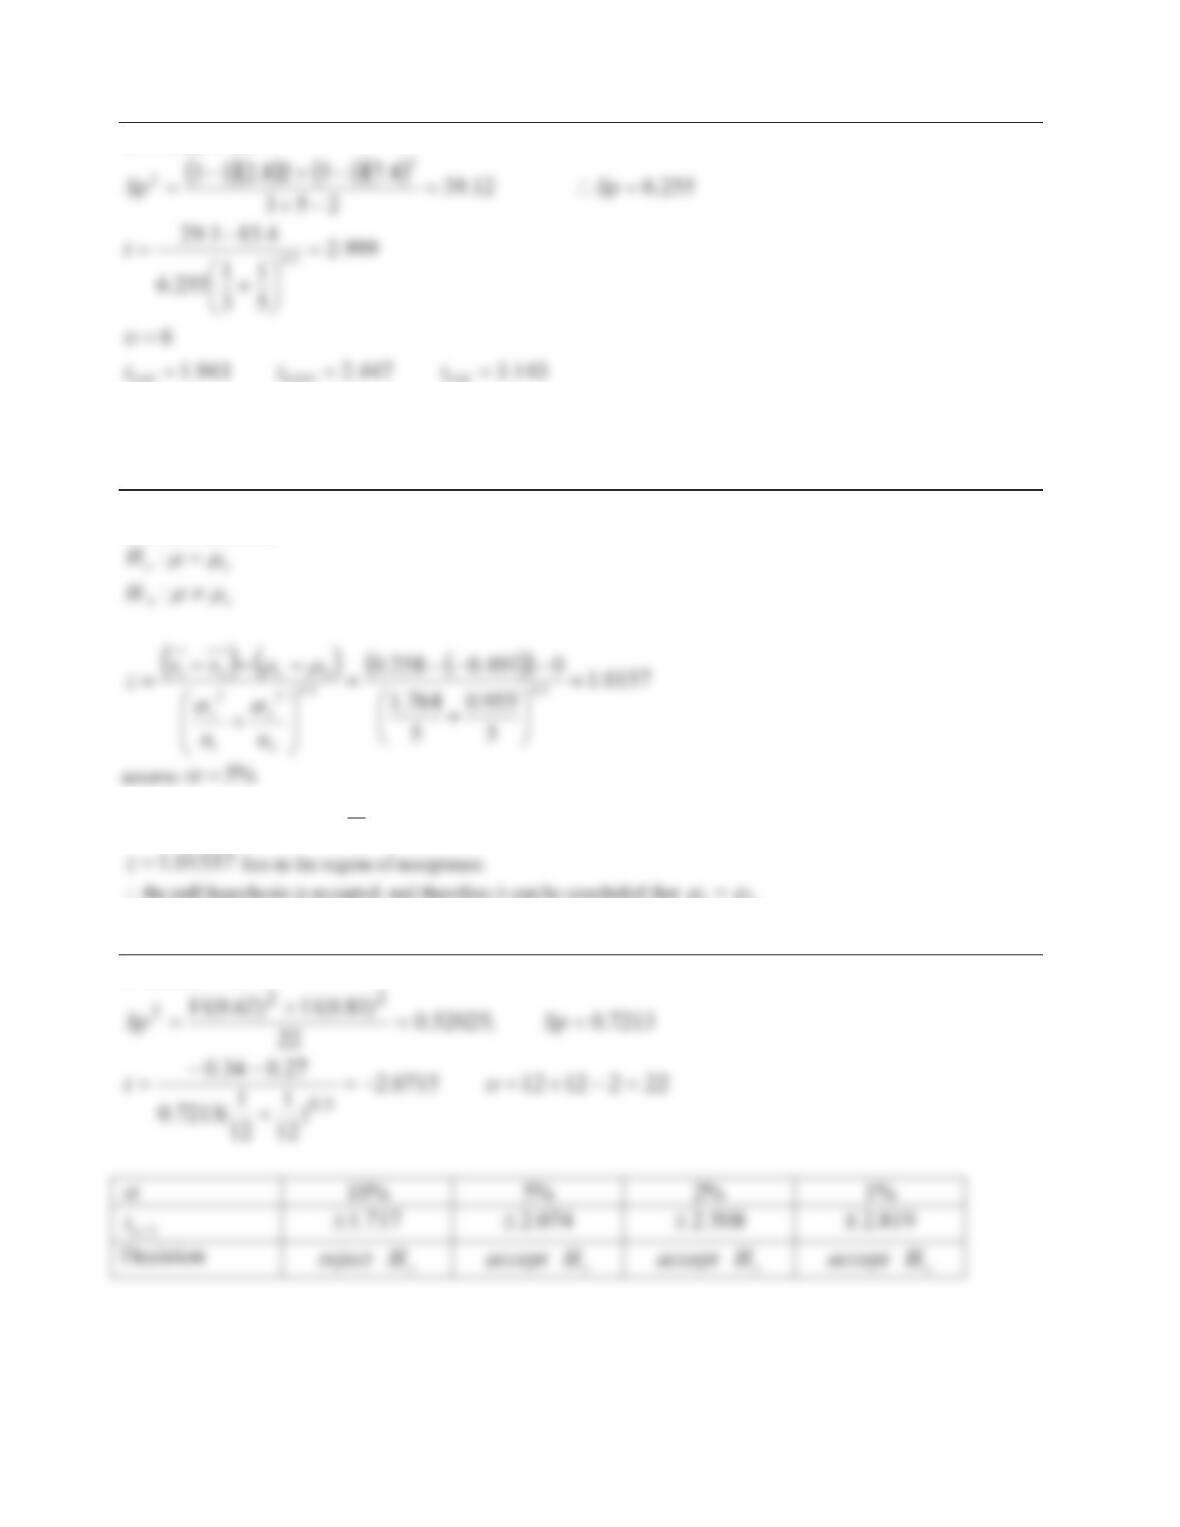
05.010.0
At a 5% level of significance, the test would suggest that the two tests give the same mean
strength.
9-11
Problem 9-36.
01.0025.005.0
With a rejection probability of about 1.2%, the test suggests that the landfill does contribute to the
pollution level.
Problem 9-37.
For a two-tailed test:
From Table A-1, and for 96.1,975.0025.01
2
1r z
D
?
Problem 9-38.